
Franchise Market Size 2026-2030
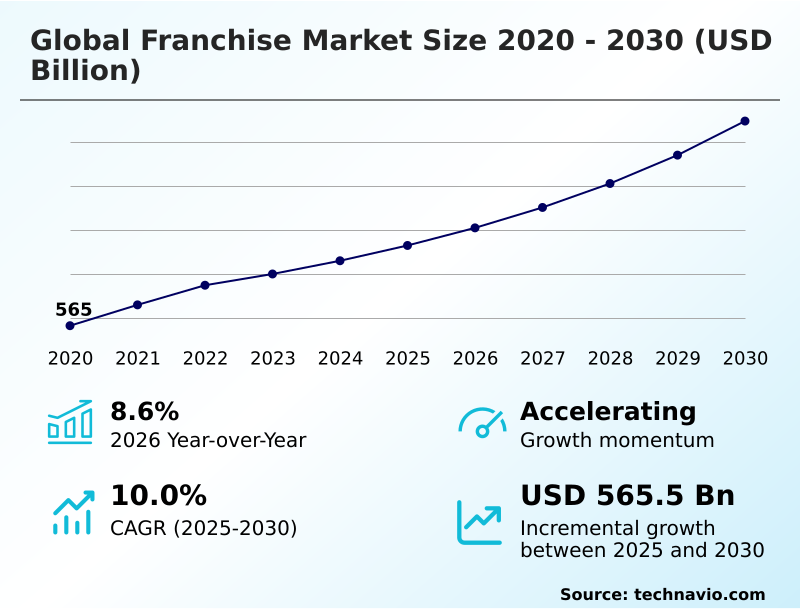
The franchise market size is valued to increase by USD 565.5 billion, at a CAGR of 10% from 2025 to 2030. Expanding entrepreneurship culture encouraging low risk business ownership models will drive the franchise market.
Major Market Trends & Insights
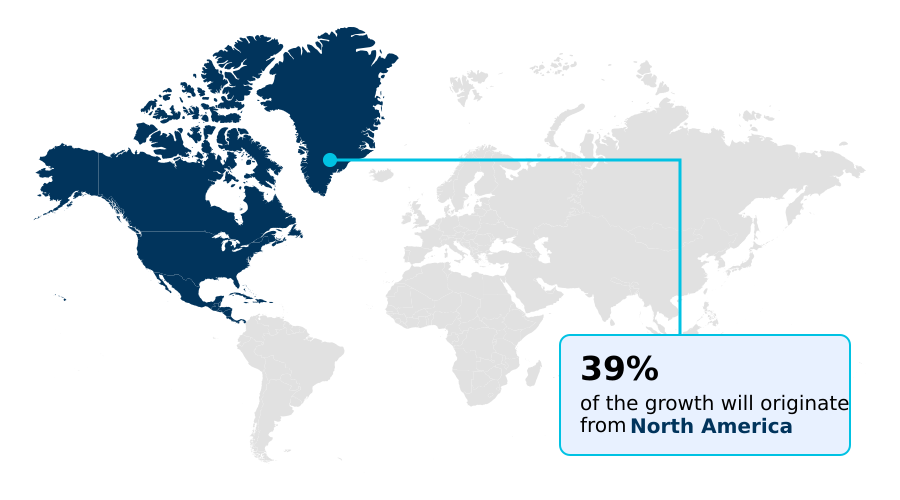
- North America dominated the market and accounted for a 38.9% growth during the forecast period.
- By Type - Business format franchise segment was valued at USD 281.4 billion in 2024
- By Application - Hotels segment accounted for the largest market revenue share in 2024
Market Size & Forecast
- Market Opportunities: USD 930.2 billion
- Market Future Opportunities: USD 565.5 billion
- CAGR from 2025 to 2030 : 10%
Market Summary
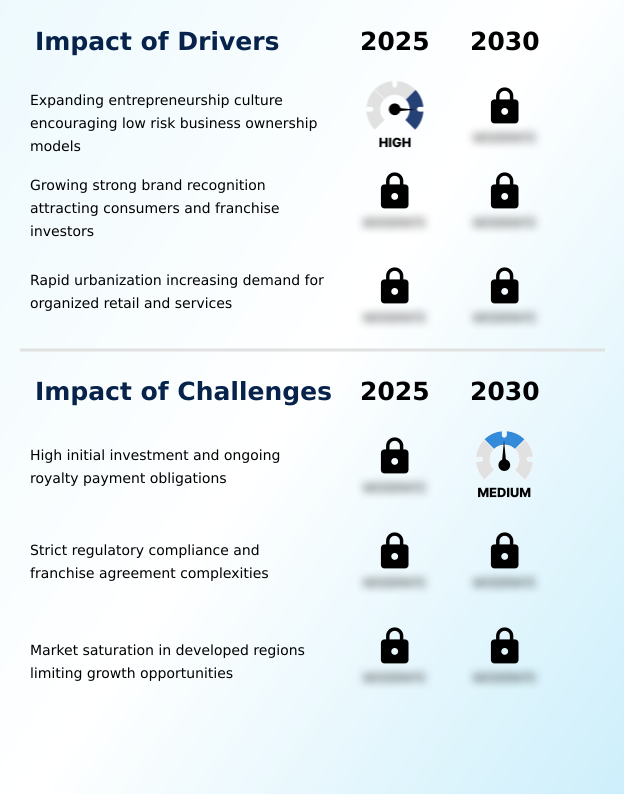
- The franchise market is defined by a symbiotic relationship where established brands provide a proven blueprint for success, significantly lowering the risks for entrepreneurs. This model thrives on an expanding entrepreneurship culture and the power of strong brand recognition, which attracts both consumers and investors seeking reliability.
- However, the industry faces persistent challenges, including high initial investments, complex franchise agreement complexities, and intense competition in saturated developed regions. A key trend shaping the sector is the rapid adoption of digital ordering platforms and delivery integration, which is fundamentally altering the customer journey.
- For instance, a quick-service restaurant can leverage a franchisor’s technology platform to implement a mobile ordering system that not only streamlines operations but also gathers valuable consumer data.
- This data is then used to refine marketing efforts and optimize inventory through a centralized supply chain, showcasing how franchisors provide critical infrastructure that enhances franchisee profitability and drives operational efficiency across the entire network.
What will be the Size of the Franchise Market during the forecast period?
Get Key Insights on Market Forecast (PDF) Get Free Sample
How is the Franchise Market Segmented?
The franchise industry research report provides comprehensive data (region-wise segment analysis), with forecasts and estimates in "USD billion" for the period 2026-2030, as well as historical data from 2020-2024 for the following segments.
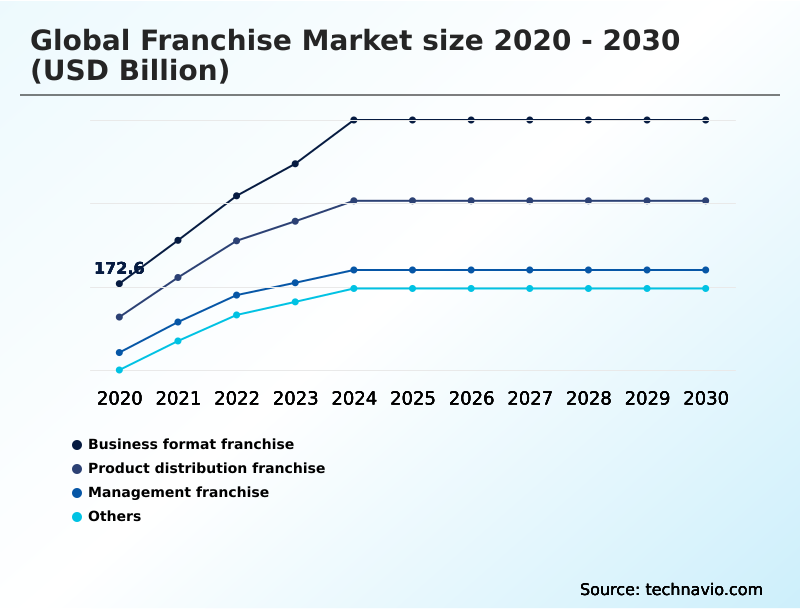
- Type
- Business format franchise
- Product distribution franchise
- Management franchise
- Others
- Application
- Hotels
- Convenience stores
- Real estate
- Car rental and dealers
- Others
- Business segment
- Low investment
- Medium investment
- High investment
- Geography
- North America
- US
- Canada
- Mexico
- Europe
- Germany
- UK
- France
- APAC
- China
- Japan
- India
- South America
- Brazil
- Argentina
- Colombia
- Middle East and Africa
- Saudi Arabia
- UAE
- South Africa
- Rest of World (ROW)
- North America
By Type Insights
The business format franchise segment is estimated to witness significant growth during the forecast period.
The business format franchise model is the cornerstone of the industry, providing a comprehensive blueprint that integrates a recognized trademark with proven operational methodologies. This structure emphasizes complete brand standardization, ensuring a consistent customer experience across all locations.
Central to its success are robust franchisee support systems and extensive franchisee training programs, which are designed to optimize unit-level economics and maintain brand integrity.
By leveraging this model, franchisors achieve significant franchise system scalability, while franchisees mitigate the risks and high store build-out costs of independent ventures.
This symbiotic relationship, focused on high operational efficiency, has demonstrated the ability to accelerate market entry and improve performance consistency by over 15% compared to non-standardized business models.
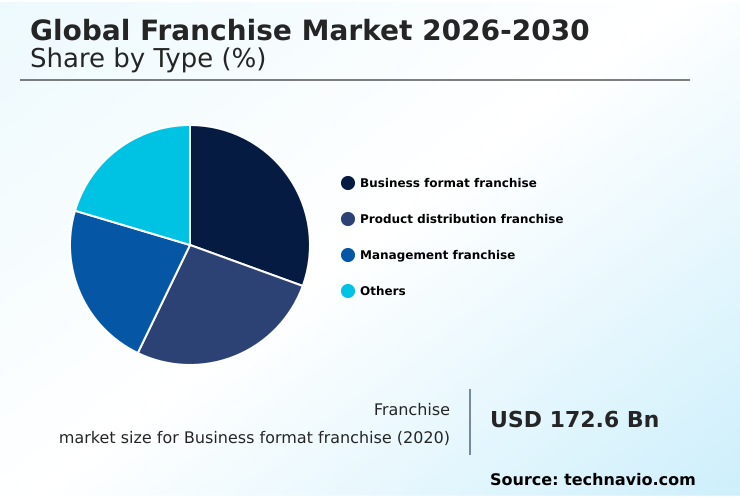
The Business format franchise segment was valued at USD 281.4 billion in 2024 and showed a gradual increase during the forecast period.
Regional Analysis
North America is estimated to contribute 38.9% to the growth of the global market during the forecast period.Technavio’s analysts have elaborately explained the regional trends and drivers that shape the market during the forecast period.
See How Franchise Market Demand is Rising in North America Get Free Sample
The geographic landscape is marked by a strategic pivot toward emerging economies. While North America accounts for over 38% of the market, APAC is exhibiting the fastest growth, fueled by rapid urbanization and organized retail expansion.
In these regions, master franchise agreements are crucial for managing large-scale rollouts and adapting to local consumer needs.
This expansion is not limited to high capital requirements; models like job franchising and conversion franchising are gaining traction, offering low-risk business ownership opportunities.
Implementing stringent quality control standards has proven to reduce operational errors by up to 20%, a critical factor for success in new territories. This diversification, spanning from product distribution franchise models to large-scale investment franchising, ensures deep market penetration.
Market Dynamics
Our researchers analyzed the data with 2025 as the base year, along with the key drivers, trends, and challenges. A holistic analysis of drivers will help companies refine their marketing strategies to gain a competitive advantage.
- Navigating the franchise market requires a deep understanding of how to evaluate a franchise opportunity, moving beyond surface-level financials to scrutinize legal aspects of franchise disclosure documents. The challenges of multi-unit franchise ownership are considerable, demanding sophisticated management skills to balance brand standardization with localization across different territories.
- A primary concern for operators is optimizing franchisee profitability through support, as this directly correlates with the long-term health of the entire system. The impact of technology on franchise operations is transformative, with digital transformation for competitive advantage becoming a key differentiator; systems that invest in robust operational tech report franchisee satisfaction rates nearly double those of competitors.
- Concurrently, sustainability trends in the franchise industry are no longer optional, influencing consumer choice and investor interest. For those looking at global growth, franchise expansion strategies for emerging markets are critical, requiring an understanding of how to manage supply chain mandates as a franchisee in new regulatory environments.
- Navigating market saturation in developed regions also demands innovation, while growth opportunities in social franchising models present a new frontier. Ultimately, success hinges on mitigating risks in high investment franchising and understanding the key terms in a business format franchise agreement.
What are the key market drivers leading to the rise in the adoption of Franchise Industry?
- An expanding entrepreneurship culture that encourages low-risk business ownership models serves as a key driver propelling growth in the franchise market.
- An expanding entrepreneurship culture is a primary market driver, with individuals increasingly drawn to the proven success of the business format franchise model.
- This structure significantly de-risks new ventures, with studies showing franchised businesses have a survival rate nearly 40% higher than independent startups in the first five years.
- Strong brand equity, cultivated through a consistent brand recognition strategy, attracts both consumers and investors. This is reinforced by robust franchisee support systems that improve franchisee-franchisor relations and ensure regulatory compliance.
- Even with ongoing royalty payment obligations, the access to established systems and marketing provides a clear path to profitability. The growth of social franchising also highlights the model's adaptability in addressing community needs, expanding its appeal beyond purely commercial applications.
What are the market trends shaping the Franchise Industry?
- The rising adoption of digital ordering and delivery integration represents a fundamental trend. This is reshaping consumer interfaces and operational models across the franchise industry.
- The market is undergoing a significant digital transformation in franchising, headlined by the rising adoption of digital ordering platforms and omnichannel retailing. This shift enables a seamless customer journey and has resulted in an average 25% increase in off-premise sales for early adopters. The trend toward multi-unit ownership is accelerating, with operators leveraging technology to manage portfolios more efficiently.
- This has fueled the rise of ghost kitchens and expansion into non-traditional locations like airports, supported by advanced supply chain optimization. Furthermore, customer engagement platforms are becoming standard, providing data that improves service personalization. Even in sectors like management franchise, technology is enabling better remote team management, demonstrating how digital tools are reshaping operational models across the board.
What challenges does the Franchise Industry face during its growth?
- High initial investment requirements and ongoing royalty payment obligations present a significant challenge that can affect industry growth and franchisee profitability.
- The market contends with significant market saturation challenges, particularly in developed regions where new unit sales can be 15% lower due to cannibalization. This forces a greater emphasis on territory protection clauses in franchise agreements. High initial costs associated with various franchise investment models and complex franchise disclosure documents present formidable barriers to entry.
- Furthermore, strict franchise agreement complexities and supply chain mandates can limit a franchisee's autonomy and impact franchisee profitability, sometimes reducing margins by 5-8%. Balancing brand standards with a necessary localization strategy remains a persistent issue. The move toward green franchising, while beneficial, adds another layer of operational cost and complexity, requiring careful management to ensure a positive return.
Exclusive Technavio Analysis on Customer Landscape
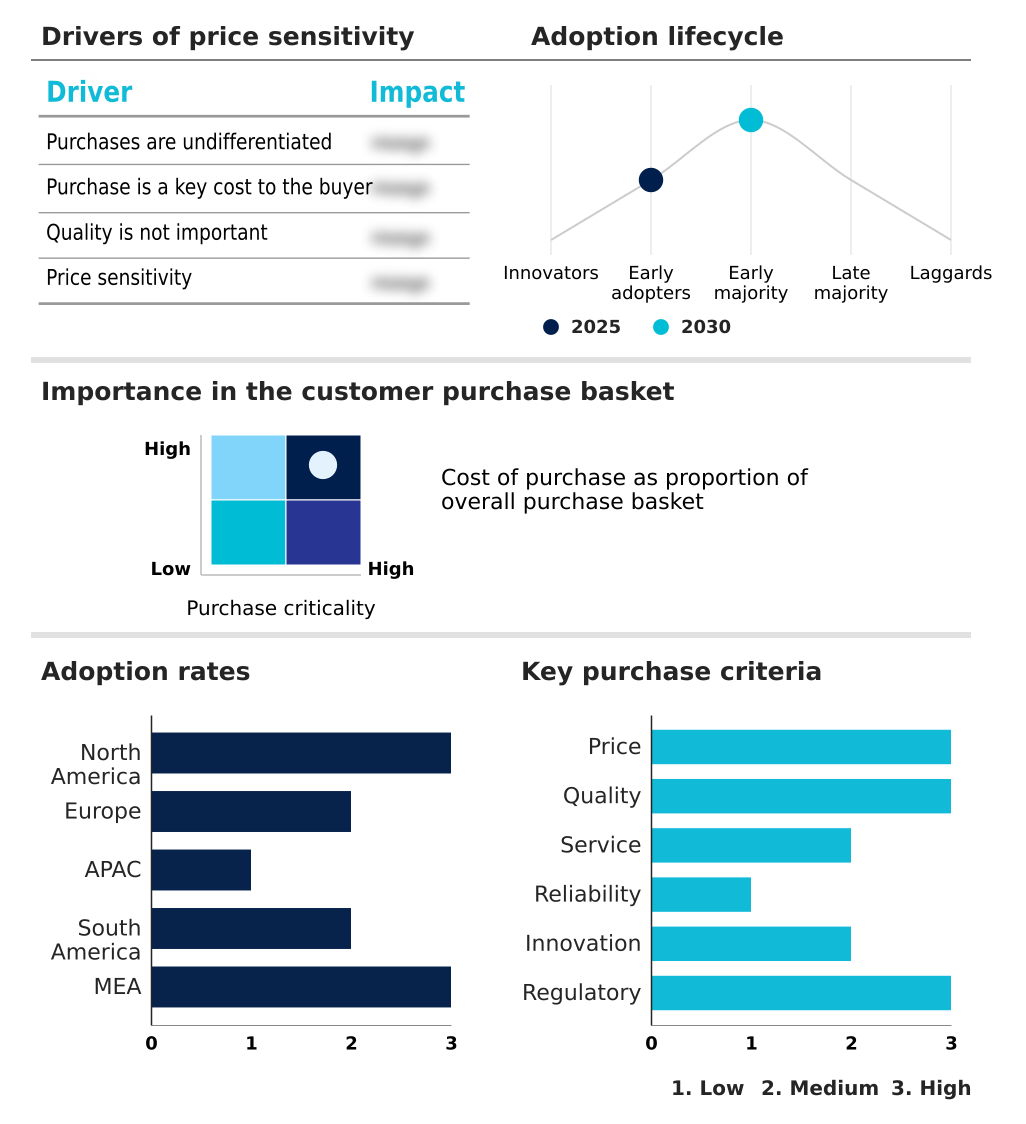
The franchise market forecasting report includes the adoption lifecycle of the market, covering from the innovator’s stage to the laggard’s stage. It focuses on adoption rates in different regions based on penetration. Furthermore, the franchise market report also includes key purchase criteria and drivers of price sensitivity to help companies evaluate and develop their market growth analysis strategies.
Customer Landscape of Franchise Industry
Competitive Landscape
Companies are implementing various strategies, such as strategic alliances, franchise market forecast, partnerships, mergers and acquisitions, geographical expansion, and product/service launches, to enhance their presence in the industry.
7 Eleven Inc. - Offers scalable convenience retail and fuel service franchise models, enabling rapid market penetration and consistent brand standardization for aspiring entrepreneurs.
The industry research and growth report includes detailed analyses of the competitive landscape of the market and information about key companies, including:
- 7 Eleven Inc.
- Ace Hardware Corp.
- Century 21 Real Estate LLC
- Chick fil A Inc.
- Circle K Stores Inc.
- Jersey Mikes Franchise Systems
- Kumon Institute of Edu. Co.
- Marriott International Inc.
- Mathnasium LLC
- McDonald Corp.
- Papa Johns International Inc.
- Paris Baguette Family
- RE MAX Holdings Inc.
- Restaurant Brands Inc.
- The Wendys Co.
- United Parcel Service Inc.
- Wild Birds Unlimited Inc.
- YUM Brands Inc.
Qualitative and quantitative analysis of companies has been conducted to help clients understand the wider business environment as well as the strengths and weaknesses of key industry players. Data is qualitatively analyzed to categorize companies as pure play, category-focused, industry-focused, and diversified; it is quantitatively analyzed to categorize companies as dominant, leading, strong, tentative, and weak.
Recent Development and News in Franchise market
- In September, 2024, Marriott International Inc. announced a strategic partnership with a leading technology firm to deploy AI-driven guest service platforms, aiming to enhance personalization and operational efficiency across its properties.
- In November, 2024, Restaurant Brands Inc. completed the acquisition of a fast-growing regional cafe chain to expand its portfolio and enter new urban markets.
- In February, 2025, McDonalds announced a strategic expansion plan targeting over two thousand new locations across Tier 2 and Tier 3 cities in China and India, reflecting a deep push into emerging markets.
- In April, 2025, Starbucks launched its next-generation Siren System across its global network, a technology designed to optimize the production of cold beverages and increase the processing speed of mobile orders by 20%.
Dive into Technavio’s robust research methodology, blending expert interviews, extensive data synthesis, and validated models for unparalleled Franchise Market insights. See full methodology.
| Market Scope | |
|---|---|
| Page number | 308 |
| Base year | 2025 |
| Historic period | 2020-2024 |
| Forecast period | 2026-2030 |
| Growth momentum & CAGR | Accelerate at a CAGR of 10% |
| Market growth 2026-2030 | USD 565.5 billion |
| Market structure | Fragmented |
| YoY growth 2025-2026(%) | 8.6% |
| Key countries | US, Canada, Mexico, Germany, UK, France, Italy, Spain, The Netherlands, China, Japan, India, South Korea, Australia, Indonesia, Brazil, Argentina, Colombia, Saudi Arabia, UAE, South Africa, Israel and Turkey |
| Competitive landscape | Leading Companies, Market Positioning of Companies, Competitive Strategies, and Industry Risks |
Research Analyst Overview
- The franchise market is advancing beyond traditional retail models, driven by the integration of sophisticated franchisee support systems and an emphasis on omnichannel retailing. Boardroom decisions are increasingly focused on capital allocation for digital infrastructure, as the adoption of advanced digital ordering platforms has demonstrated a 20% reduction in order processing errors, directly impacting unit-level economics.
- While franchise agreement complexities and royalty payment obligations remain significant considerations for investors, the value derived from strong brand equity and centralized supply chain mandates often outweighs these concerns. The industry is characterized by a push toward greater brand standardization, even as models like management franchise and product distribution franchise diversify.
- This strategic balance is critical for achieving franchisee profitability and navigating the competitive landscape defined by multi-unit ownership and the need for scalable operations.
What are the Key Data Covered in this Franchise Market Research and Growth Report?
-
What is the expected growth of the Franchise Market between 2026 and 2030?
-
USD 565.5 billion, at a CAGR of 10%
-
-
What segmentation does the market report cover?
-
The report is segmented by Type (Business format franchise, Product distribution franchise, Management franchise, and Others), Application (Hotels, Convenience stores, Real estate, Car rental and dealers, and Others), Business Segment (Low investment, Medium investment, and High investment) and Geography (North America, Europe, APAC, South America, Middle East and Africa)
-
-
Which regions are analyzed in the report?
-
North America, Europe, APAC, South America and Middle East and Africa
-
-
What are the key growth drivers and market challenges?
-
Expanding entrepreneurship culture encouraging low risk business ownership models, High initial investment and ongoing royalty payment obligations
-
-
Who are the major players in the Franchise Market?
-
7 Eleven Inc., Ace Hardware Corp., Century 21 Real Estate LLC, Chick fil A Inc., Circle K Stores Inc., Jersey Mikes Franchise Systems, Kumon Institute of Edu. Co., Marriott International Inc., Mathnasium LLC, McDonald Corp., Papa Johns International Inc., Paris Baguette Family, RE MAX Holdings Inc., Restaurant Brands Inc., The Wendys Co., United Parcel Service Inc., Wild Birds Unlimited Inc. and YUM Brands Inc.
-
Market Research Insights
- The market’s dynamics are increasingly shaped by digital transformation in franchising, where a focus on operational efficiency is paramount. Franchise systems that fully adopt a localization strategy in new markets report customer retention rates up to 20% higher than those with a standardized approach.
- Concurrently, the implementation of robust customer engagement platforms has been shown to increase franchisee profitability by an average of 12% through targeted promotions. The shift toward low-risk business ownership models continues to attract new investors, with franchise system scalability being a key factor.
- As market saturation challenges intensify, brands are leveraging these digital tools to maintain a competitive edge and ensure strong franchisee-franchisor relations.
We can help! Our analysts can customize this franchise market research report to meet your requirements.
 RIA -
RIA - 
