
Fleet Management Market Size 2025-2029
The fleet management market size is valued to increase USD 52.23 billion, at a CAGR of 15.6% from 2024 to 2029. Rise in e-commerce and last-mile delivery will drive the fleet management market.
Major Market Trends & Insights
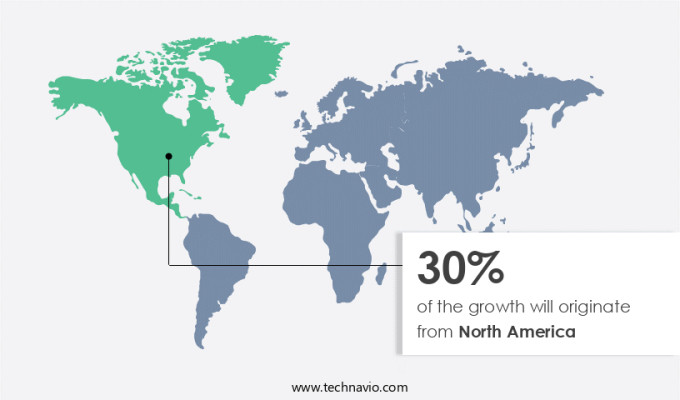
- North America dominated the market and accounted for a 30% growth during the forecast period.
- By Type - Subscription segment was valued at USD 31.92 billion in 2023
- By Vehicle Type - Commercial fleet segment accounted for the largest market revenue share in 2023
Market Size & Forecast
- Market Opportunities: USD 186.63 billion
- Market Future Opportunities: USD 52233.30 billion
- CAGR from 2024 to 2029 : 15.6%
Market Summary
- In the realm of business operations, fleet management has emerged as a critical function, particularly in sectors reliant on logistics and transportation. The market is currently valued at over USD50 billion, underpinned by the surge in e-commerce and the growing demand for efficient last-mile delivery solutions. Telematics, a key technology driving fleet management's evolution, is increasingly adopted to optimize vehicle utilization, enhance safety, and reduce operational costs. Autonomous vehicles, another disruptive trend, are poised to revolutionize fleet management by offering round-the-clock operations and minimizing human error.
- However, challenges persist, such as ensuring reliable GPS connectivity and addressing data security concerns. As businesses navigate these complexities, fleet management continues to evolve, offering innovative solutions to optimize operations and boost productivity.
What will be the Size of the Fleet Management Market during the forecast period?

Get Key Insights on Market Forecast (PDF) Request Free Sample
How is the Fleet Management Market Segmented ?
The fleet management industry research report provides comprehensive data (region-wise segment analysis), with forecasts and estimates in "USD billion" for the period 2025-2029, as well as historical data from 2019-2023 for the following segments.
- Type
- Subscription
- Others
- Vehicle Type
- Commercial fleet
- Passenger car
- Communication Technology
- GNSS
- Cellular System
- Geography
- North America
- US
- Canada
- Europe
- France
- Germany
- Italy
- UK
- APAC
- China
- India
- Japan
- South Korea
- Rest of World (ROW)
- North America
By Type Insights
The subscription segment is estimated to witness significant growth during the forecast period.
In the ever-evolving landscape of fleet management, businesses increasingly turn to subscription-based models to optimize their operations. These flexible solutions enable companies to customize their services according to their fleet size and specific requirements. With predictable and consistent costs, subscription-based fleet management offers simplified financial planning, allowing businesses to manage cash flow effectively and avoid unexpected expenses related to maintenance or upgrades. Cloud-based fleet management systems, a common choice for subscriptions, facilitate quick deployment with minimal hardware setup. Features such as real-time location tracking via GPS, predictive maintenance using data analytics platforms, and route optimization algorithms enhance operational efficiency.
Mobile workforce management, driver communication apps, and wearable technology integration further streamline daily tasks. Subscription models also provide access to advanced capabilities like vehicle diagnostics, fuel efficiency monitoring, and compliance reporting. Telematics systems, geofencing technology, and performance dashboards offer valuable insights into fleet performance and driver behavior. Additionally, fleet security systems, speed monitoring, and mileage tracking ensure safety and regulatory compliance. One significant advantage of subscription-based fleet management is the integration of IoT sensors and on-board diagnostics, which enable remote diagnostics and maintenance scheduling. Furthermore, driver safety monitoring, fuel consumption data, and idle time reduction contribute to overall fleet optimization.
According to recent studies, more than 70% of businesses using fleet management solutions have reported increased operational efficiency. Subscription-based fleet management empowers organizations to adapt to changing needs and stay competitive in the dynamic market.

The Subscription segment was valued at USD 31.92 billion in 2019 and showed a gradual increase during the forecast period.

Regional Analysis
North America is estimated to contribute 30% to the growth of the global market during the forecast period.Technavio’s analysts have elaborately explained the regional trends and drivers that shape the market during the forecast period.
See How Fleet Management Market Demand is Rising in North America Request Free Sample
The North American the market experiences continuous expansion due to the region's economic growth and increasing commercial activities. This thriving economy generates a higher demand for efficient fleet solutions, as businesses require transportation and logistics capabilities to meet their needs. The rise of e-commerce and the growing demand for last-mile delivery services further contribute to the market's expansion. Urbanization and traffic congestion in metropolitan areas necessitate efficient fleet management to optimize operations and reduce transportation costs.
According to recent industry reports, the market in North America is poised for significant growth, reflecting the market's evolving nature and increasing importance in modern business operations.
Market Dynamics
Our researchers analyzed the data with 2024 as the base year, along with the key drivers, trends, and challenges. A holistic analysis of drivers will help companies refine their marketing strategies to gain a competitive advantage.
The market is experiencing significant growth due to the increasing integration of advanced technologies to optimize operations and enhance safety. One key trend is the fusion of GPS tracking with ERP systems, enabling real-time monitoring and analysis of fleet data. Predictive maintenance algorithms, fueled by machine learning, proactively identify vehicle issues, reducing downtime and maintenance costs. Driver behavior modification programs, which utilize telematics data, encourage fuel efficiency and safe driving practices. Real-time location tracking and emergency response systems ensure the safety of drivers and assets, while analyzing vehicle diagnostics enables proactive maintenance scheduling. Geofencing technology improves security and reduces unauthorized vehicle usage, while data visualization dashboards offer an efficient means to manage and monitor fleet performance. Mobile workforce management software facilitates improved communication and task assignment, and wearable tech integration offers insights into driver health. Fuel card integration into fleet management systems streamlines expense tracking, and efficient route planning and optimization algorithms, based on real-time traffic, minimize travel time and fuel consumption. Driver safety scorecards, linked to incentives and reward programs, encourage safe driving habits. Advanced driver-assistance systems significantly impact safety, while telematics data calculation helps reduce carbon emissions. IoT sensors measure and monitor vehicle performance, and cloud-based solutions offer remote diagnostics and fleet management capabilities. Monitoring and reducing vehicle idle time further enhances fuel efficiency, and compliance reporting features ensure regulatory compliance.

What are the key market drivers leading to the rise in the adoption of Fleet Management Industry?
- The surge in e-commerce sales and the resulting demand for efficient last-mile delivery services are primary factors fueling market growth.
- The e-commerce sector's expansion has led to a significant rise in the necessity for diverse delivery vehicles, from compact vans to larger trucks. Businesses rely on fleet management solutions to optimize their fleets and cater to the varying requirements of last-mile delivery. These systems employ sophisticated algorithms, taking into account factors such as traffic conditions, delivery schedules, and fuel efficiency to optimize routes. Real-time tracking and visibility are essential in last-mile delivery, and fleet management solutions offer this functionality, enabling both businesses and customers to monitor delivery status and location.
- Additionally, fleet management tools facilitate efficient resource allocation, including vehicles and drivers, based on demand patterns.
What are the market trends shaping the Fleet Management Industry?
- The increasing adoption of telematics and autonomous vehicles represents a significant market trend. This trend is driven by advancements in technology and the growing demand for more efficient and convenient transportation solutions.
- The telematics industry's evolution began with the integration of telecommunication systems and GPS-based positioning, enabling the sharing of vehicle location details. Initially focusing on GPS navigation systems, this technology is now a necessity for commercial vehicles worldwide. The autonomous vehicle sector's growth will fuel the adoption of sensors, connectivity devices, and network components. The increasing complexity of electric and hybrid vehicles and self-driving cars necessitates a substantial number of semiconductor components, including sensors and integrated circuits (ICs). These vehicles rely on information from connected car networks and the Internet of Things (IoT) for navigation.
- The telematics industry's continuous growth is driven by advancements in technology, with a focus on enhancing safety, efficiency, and convenience across various sectors. The integration of advanced sensors and connectivity devices is transforming industries such as transportation, logistics, and insurance, offering valuable insights and real-time data.
What challenges does the Fleet Management Industry face during its growth?
- The issue of GPS connectivity poses a significant challenge to the industry's growth, as unreliable satellite signals can hinder the effectiveness and efficiency of various applications and services that heavily rely on accurate location data.
- The market faces significant challenges due to connectivity issues. Fleet management relies on satellite and cellular communication networks to determine vehicle location, speed, and direction. A reliable high-speed Internet connection with a GPS tracker is essential for effective fleet monitoring. While developed countries like the US, the UK, and Japan have advanced Internet infrastructure, numerous challenges persist in other regions.
- In suburban areas and highways, cellular connectivity can be weak, particularly in developing countries. Remote mining locations and certain off-road terrains may lack cellular connectivity altogether. These connectivity issues hinder the real-time monitoring and optimization capabilities of fleet management systems, potentially impacting operational efficiency and safety.
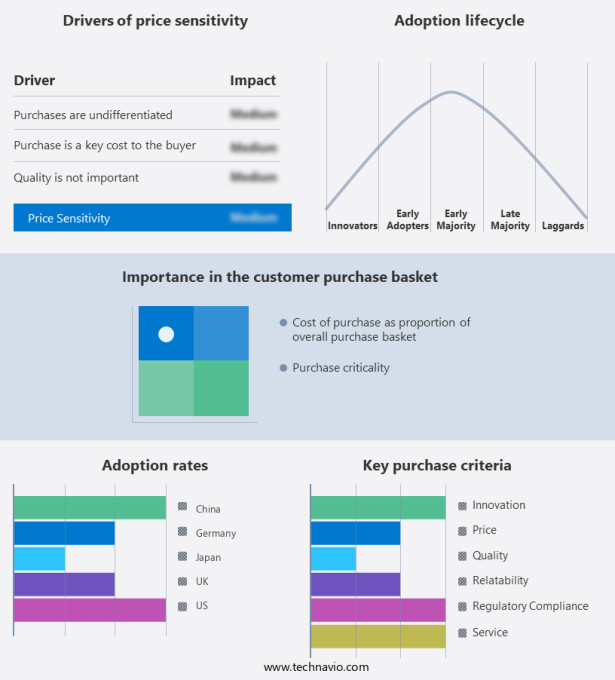
Exclusive Technavio Analysis on Customer Landscape
The fleet management market forecasting report includes the adoption lifecycle of the market, covering from the innovator’s stage to the laggard’s stage. It focuses on adoption rates in different regions based on penetration. Furthermore, the fleet management market report also includes key purchase criteria and drivers of price sensitivity to help companies evaluate and develop their market growth analysis strategies.
Customer Landscape of Fleet Management Industry
Competitive Landscape
Companies are implementing various strategies, such as strategic alliances, fleet management market forecast, partnerships, mergers and acquisitions, geographical expansion, and product/service launches, to enhance their presence in the industry.
AT and T Inc. - This company specializes in fleet management solutions, enhancing operational efficiency by optimizing routes, integrating compliance tools, and minimizing regulatory violations. By reducing fuel and maintenance costs, businesses can streamline their logistics and improve overall profitability.
The industry research and growth report includes detailed analyses of the competitive landscape of the market and information about key companies, including:
- AT and T Inc.
- Avrios International AG
- Bridgestone Corp.
- Chevin Fleet Solutions
- Donlen Corp.
- Element Fleet Management Corp.
- Fleetio
- Geotab Inc.
- GPS Insight
- GURTAM
- Holman Inc.
- MiX Telematics Ltd.
- Motive Technologies Inc.
- NetraDyne Inc.
- Samsara Inc.
- Solera Holdings LLC
- JSC Teltonika
- TomTom NV
- Trimble Inc.
- Verizon Communications Inc.
- Via Transportation Inc.
- Vontier Corp.
Qualitative and quantitative analysis of companies has been conducted to help clients understand the wider business environment as well as the strengths and weaknesses of key industry players. Data is qualitatively analyzed to categorize companies as pure play, category-focused, industry-focused, and diversified; it is quantitatively analyzed to categorize companies as dominant, leading, strong, tentative, and weak.
Recent Development and News in Fleet Management Market
- In January 2024, Volvo Group, a leading truck and bus manufacturer, announced the launch of its new connected services platform, Volvo Connect, aimed at enhancing fleet management and optimizing vehicle uptime for its customers (Volvo Group Press Release, 2024). This platform, which integrates telematics, predictive maintenance, and real-time vehicle data, represents a significant technological advancement in the market.
- In March 2024, Daimler Trucks and Mercedes-Benz Trucks signed a strategic partnership with Microsoft to develop and implement cloud-based fleet management solutions using Microsoft Azure (Microsoft News Center, 2024). This collaboration represents a major shift towards digital transformation in the fleet management industry, enabling real-time data analysis and predictive maintenance for commercial vehicles.
- In April 2025, Trimble, a leading provider of fleet management solutions, announced the acquisition of Webfleet Solutions, a European fleet management software company, for approximately €1.2 billion (Trimble Press Release, 2025). This acquisition significantly expands Trimble's global footprint and market share in the market, positioning it as a major competitor in the European market.
- In May 2025, the European Union passed the Alternative Fuels Infrastructure Regulation, which mandates the installation of alternative fuel infrastructure, including electric vehicle charging points, at a rate of at least 1,000 per 100,000 inhabitants by 2025 (European Parliament, 2025). This regulatory initiative represents a significant government push towards the adoption of electric and alternative fuel vehicles, creating new opportunities for fleet management companies offering electric vehicle solutions.
Dive into Technavio’s robust research methodology, blending expert interviews, extensive data synthesis, and validated models for unparalleled Fleet Management Market insights. See full methodology.
|
Market Scope |
|
|
Report Coverage |
Details |
|
Page number |
197 |
|
Base year |
2024 |
|
Historic period |
2019-2023 |
|
Forecast period |
2025-2029 |
|
Growth momentum & CAGR |
Accelerate at a CAGR of 15.6% |
|
Market growth 2025-2029 |
USD 52.23 billion |
|
Market structure |
Fragmented |
|
YoY growth 2024-2025(%) |
13.5 |
|
Key countries |
US, China, Germany, UK, Japan, Canada, India, South Korea, France, and Italy |
|
Competitive landscape |
Leading Companies, Market Positioning of Companies, Competitive Strategies, and Industry Risks |
Research Analyst Overview
- The market continues to evolve, driven by advancements in technology and the growing demand for efficient operations across various sectors. A prime example of this dynamism is the integration of accident reconstruction data analytics platforms into fleet management systems, enabling more accurate and timely incident response and analysis. Predictive maintenance, fueled by route optimization algorithms and real-time vehicle diagnostics, is revolutionizing fleet maintenance, reducing downtime and maintenance costs. Mobile workforce management, with wearable technology integration and driver communication apps, enhances productivity and safety. Cloud-based fleet management solutions, featuring work order management, performance dashboards, and remote diagnostics, offer flexibility and scalability for businesses.
- Geofencing technology, GPS tracking devices, and IoT sensors provide real-time location tracking and asset monitoring. Fleet security systems, incorporating speed monitoring, mileage tracking, and driver safety monitoring, ensure regulatory compliance and risk mitigation. Maintenance scheduling software, fuel efficiency monitoring, and compliance reporting streamline operations and optimize resources. According to industry reports, the market is expected to grow by over 10% annually, driven by the increasing adoption of telematics systems, on-board diagnostics, and driver behavior analysis. These trends contribute to more efficient fleet operations, improved safety, and reduced costs.
What are the Key Data Covered in this Fleet Management Market Research and Growth Report?
-
What is the expected growth of the Fleet Management Market between 2025 and 2029?
-
USD 52.23 billion, at a CAGR of 15.6%
-
-
What segmentation does the market report cover?
-
The report is segmented by Type (Subscription and Others), Vehicle Type (Commercial fleet and Passenger car), Geography (North America, Europe, APAC, South America, and Middle East and Africa), and Communication Technology (GNSS and Cellular System)
-
-
Which regions are analyzed in the report?
-
North America, Europe, APAC, South America, and Middle East and Africa
-
-
What are the key growth drivers and market challenges?
-
Rise in e-commerce and last-mile delivery, Issues in GPS connectivity
-
-
Who are the major players in the Fleet Management Market?
-
AT and T Inc., Avrios International AG, Bridgestone Corp., Chevin Fleet Solutions, Donlen Corp., Element Fleet Management Corp., Fleetio, Geotab Inc., GPS Insight, GURTAM, Holman Inc., MiX Telematics Ltd., Motive Technologies Inc., NetraDyne Inc., Samsara Inc., Solera Holdings LLC, JSC Teltonika, TomTom NV, Trimble Inc., Verizon Communications Inc., Via Transportation Inc., and Vontier Corp.
-
Market Research Insights
- The market is a dynamic and ever-evolving industry, encompassing various solutions and services. Two key areas of focus are theft prevention and compliance management. For instance, the implementation of advanced technologies, such as electronic logging devices and real-time updates, has led to a significant reduction in vehicle downtime due to regulatory non-compliance. Furthermore, the market is expected to grow at a steady pace, with industry analysts projecting a 10% annual expansion over the next five years. This growth is driven by the increasing demand for data-driven insights, fuel consumption reduction, and improved safety metrics.
- A notable example of this trend is the adoption of proactive maintenance practices, which has resulted in a 25% reduction in unplanned vehicle maintenance costs for many fleet operators.
We can help! Our analysts can customize this fleet management market research report to meet your requirements.