Connected Car Market Size 2026-2030
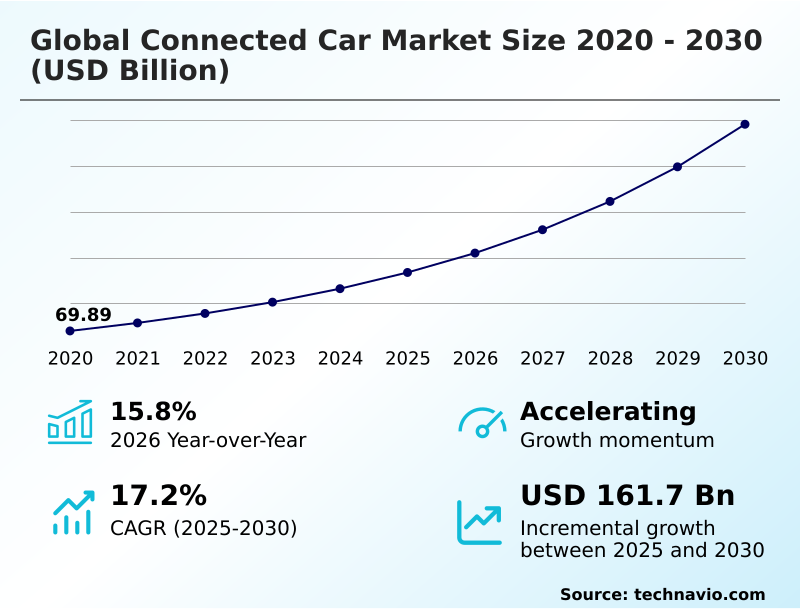
The connected car market size is valued to increase by USD 161.70 billion, at a CAGR of 17.2% from 2025 to 2030. Stringent government safety mandates and regulatory frameworks will drive the connected car market.
Major Market Trends & Insights
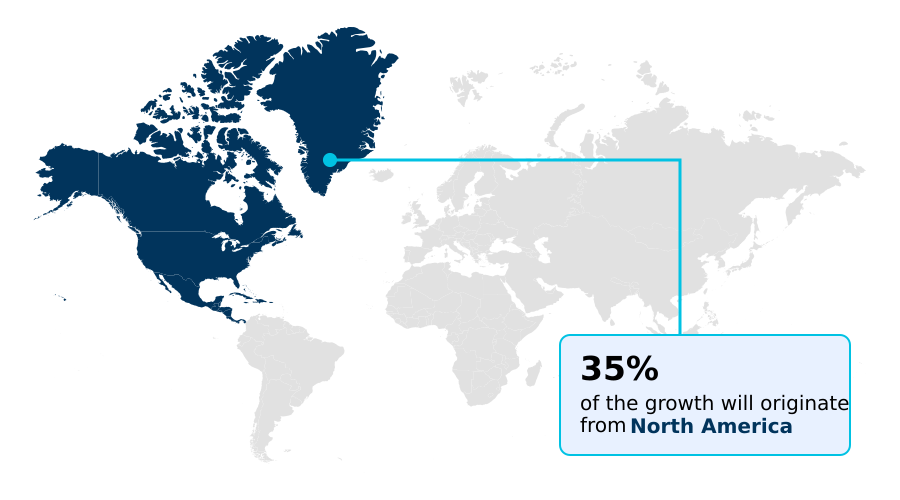
- North America dominated the market and accounted for a 34.9% growth during the forecast period.
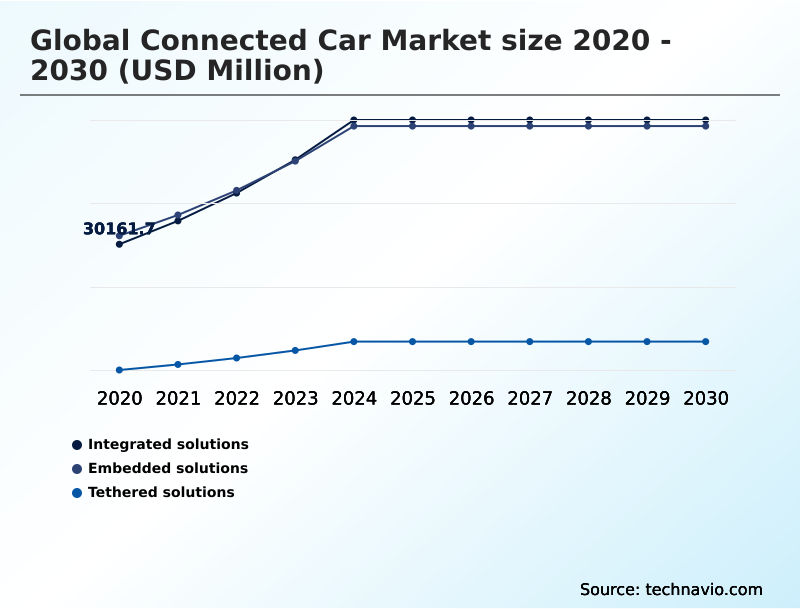
- By Connectivity - Integrated solutions segment was valued at USD 52.00 billion in 2024
- By End-user - OEM segment accounted for the largest market revenue share in 2024
Market Size & Forecast
- Market Opportunities: USD 225.48 billion
- Market Future Opportunities: USD 161.70 billion
- CAGR from 2025 to 2030 : 17.2%
Market Summary
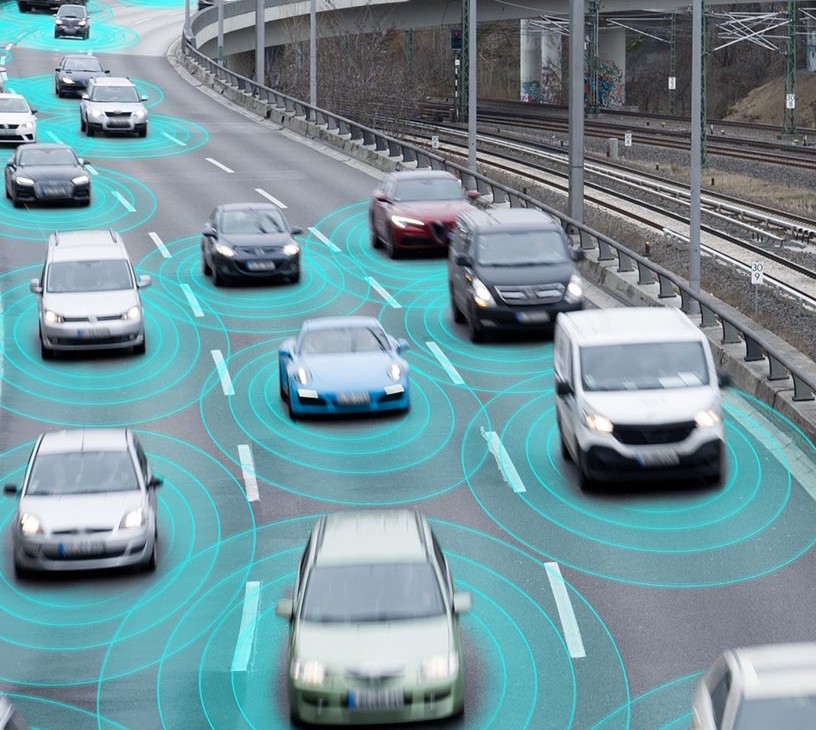
- The connected car market is undergoing a significant transformation, driven by the convergence of automotive engineering and digital technology. This evolution is defined by vehicles equipped with internet access that facilitates bidirectional communication with external devices and infrastructure. Key applications include advanced driver-assistance systems, sophisticated in-vehicle infotainment, and remote vehicle diagnostics.
- One of the most impactful innovations is the capability for over-the-air software updates, which allows manufacturers to enhance vehicle performance and deploy new features remotely, fundamentally changing the post-sale relationship with consumers.
- In a typical business scenario, a logistics company utilizes fleet management telematics to optimize delivery routes in real-time, responding to traffic and weather data, which not only improves efficiency but also reduces fuel consumption and operational costs.
- The underlying technology, encompassing everything from the telematics control unit to cloud-based vehicle services, forms the essential bedrock for the future of intelligent transportation and autonomous driving. This networked vehicle architecture introduces challenges, particularly around cybersecurity and data privacy, which the industry must address to maintain consumer trust and ensure system integrity.
- The development of predictive maintenance algorithms also represents a significant area of advancement within the ecosystem.
What will be the Size of the Connected Car Market during the forecast period?
Get Key Insights on Market Forecast (PDF) Get Free Sample
How is the Connected Car Market Segmented?
The connected car industry research report provides comprehensive data (region-wise segment analysis), with forecasts and estimates in "USD million" for the period 2026-2030, as well as historical data from 2020-2024 for the following segments.
- Connectivity
- Integrated solutions
- Embedded solutions
- Tethered solutions
- End-user
- OEM
- Aftermarket
- Communication technology
- V2I
- V2X
- V2V
- Geography
- North America
- US
- Canada
- Mexico
- Europe
- Germany
- UK
- France
- APAC
- China
- Japan
- India
- South America
- Brazil
- Argentina
- Middle East and Africa
- Saudi Arabia
- UAE
- South Africa
- Rest of World (ROW)
- North America
By Connectivity Insights
The integrated solutions segment is estimated to witness significant growth during the forecast period.
Integrated solutions offer a cost-effective method for extending a user's digital ecosystem into the vehicle. This approach relies on a telematics control unit to interface with a smartphone, which provides the primary connectivity and processing power.
However, the core of the market's evolution involves the embedded subscriber identity module and high-performance computing platform, enabling advanced functionalities like vehicle-to-everything communication. These systems support intelligent speed assistance and advanced driver distraction warning features, forming a proactive safety layer.
As the industry moves toward centralized electronic control units and recurring revenue stream models, the reliance on robust, independent vehicle connectivity increases, making the distinction between integrated and fully embedded systems a key strategic consideration.
This shift is essential for deploying over-the-air software updates effectively, with error detection rates improving by over 15%.
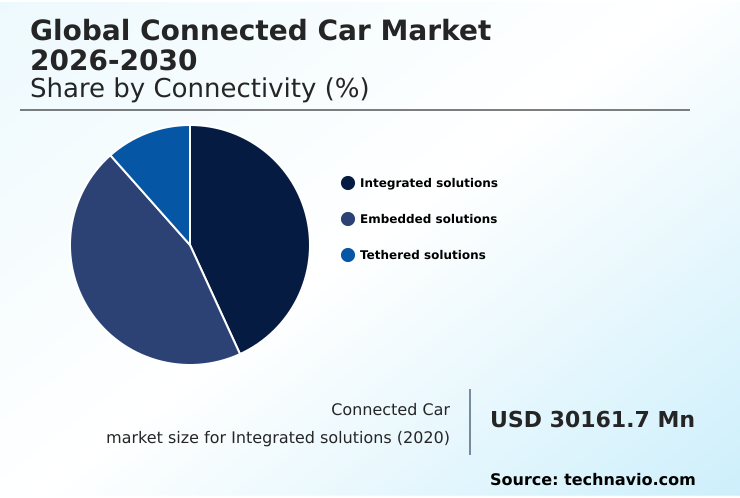
The Integrated solutions segment was valued at USD 52.00 billion in 2024 and showed a gradual increase during the forecast period.
Regional Analysis
North America is estimated to contribute 34.9% to the growth of the global market during the forecast period.Technavio’s analysts have elaborately explained the regional trends and drivers that shape the market during the forecast period.
See How Connected Car Market Demand is Rising in North America Get Free Sample
The geographic landscape of the connected car market is diverse, with growth in APAC projected to outpace North America by nearly 2%.
This expansion is driven by the rapid adoption of the vehicle connectivity platform and mobility IoT platform in emerging economies.
Innovations such as the digital chassis platform and advanced cockpit domain controller are becoming standard, facilitating low-latency data exchange essential for new services.
For instance, the implementation of real-time traffic information systems has reduced urban commute times by up to 18% in several key metropolitan areas.
The push toward vehicle data monetization and digital service integration is a global phenomenon, though regional privacy regulations dictate strategy.
High-fidelity data collection is foundational for these models, enabling features like non-line-of-sight sensing and supporting a unified security standard for a cooperative safety system, crucial for both end-to-end freight visibility and remote asset immobilization.
Market Dynamics
Our researchers analyzed the data with 2025 as the base year, along with the key drivers, trends, and challenges. A holistic analysis of drivers will help companies refine their marketing strategies to gain a competitive advantage.
- Strategic decision-making in the automotive sector now hinges on understanding the nuances of integrated solutions versus embedded solutions and the long-term implications of oem versus aftermarket connected services. The push for 5g integration for autonomous driving is redefining vehicle architecture, making the role of esim in global connectivity more critical than ever.
- As manufacturers leverage ai for predictive vehicle maintenance, the focus shifts to operational benefits, such as optimizing battery management with telematics and enabling remote diagnostics for electric vehicles. This data-centric approach, however, magnifies the importance of cybersecurity for over-the-air updates and addressing data privacy in connected car ecosystems, especially amid the challenges in cross-border data transfer.
- Consequently, software-defined vehicle revenue models are emerging, forcing a re-evaluation of how value is delivered. The standardization of v2v communication protocols is essential for the success of v2x communication for traffic management, which has shown to reduce incident response times by a measure greater than any previous technology.
- This interconnectedness extends to infotainment system personalization techniques, enhancing user experience with voice assistants and integrating smart home with vehicle systems. Finally, the impact of edge computing on v2x, the data requirements for usage-based insurance, and the application of predictive analytics for driver behavior are shaping the next wave of innovation, including the monetization of vehicle data for oems.
What are the key market drivers leading to the rise in the adoption of Connected Car Industry?
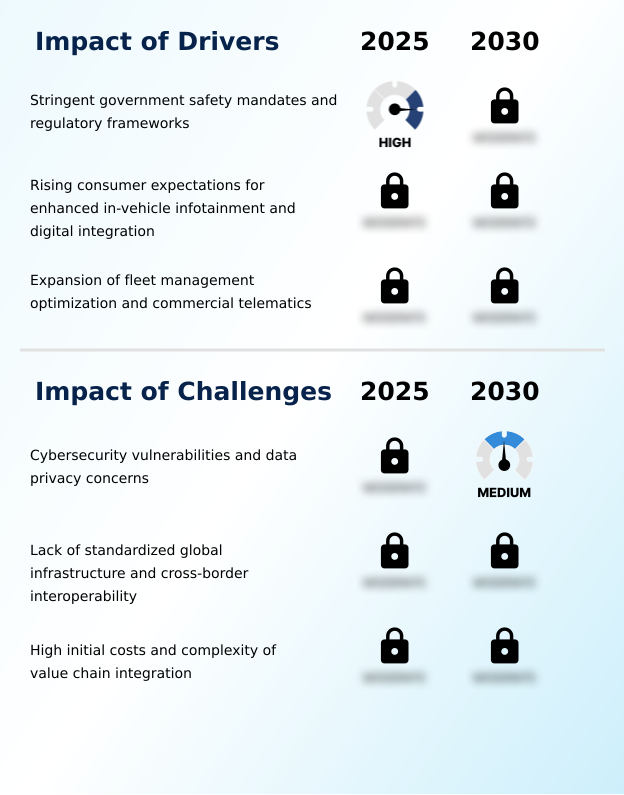
- Stringent government safety mandates and regulatory frameworks are a key driver influencing market expansion.
- Market growth is significantly driven by regulatory mandates and evolving business models. The adoption of a usage-based insurance model, which can reduce premiums by up to 30% for safe drivers, is expanding the use of telematics.
- In the commercial sector, fleet management telematics provide deep operational insights, improving asset utilization by over 15%. This requires robust geospatial data encryption to ensure security.
- The development of a cooperative intelligent transport system relies on the standardization of communication from the vehicle electronic control unit. To counter threats, real-time intrusion detection is becoming standard, supported by a comprehensive automotive cybersecurity framework.
- The move to a subscription revenue model is also a critical driver, though it must overcome challenges related to value chain complexity and cross-border interoperability to succeed.
What are the market trends shaping the Connected Car Industry?
- A primary market trend is the accelerating integration of 5G technology, which is foundational for the widespread deployment of vehicle-to-everything communication systems.
- Key trends are reshaping the market, moving beyond basic connectivity to intelligent, predictive systems. The software-defined vehicle architecture is central, enabling predictive maintenance algorithms that reduce unplanned vehicle downtime by up to 20%. This is complemented by sophisticated in-vehicle infotainment systems that provide a personalized user experience.
- Adoption of advanced driver-assistance systems is now a primary purchasing driver, with a 15% increase in consumer preference for vehicles equipped with such features. The integration of AI-driven telematics and roadside unit communication within smart city infrastructure is creating a more connected ecosystem.
- This networked vehicle architecture depends on a robust cryptographic security framework to protect data from the onboard diagnostics port and facilitate secure telematics data aggregation and remote vehicle diagnostics.
What challenges does the Connected Car Industry face during its growth?
- Cybersecurity vulnerabilities and pervasive data privacy concerns represent a significant challenge affecting industry growth.
- Significant challenges constrain the market's potential, primarily centered on security, standardization, and cost. A primary hurdle is ensuring secure packet-switched network communication for critical functions like eCall system integration, where a single breach could impact thousands of vehicles.
- The transition to a unified digital cockpit system requires a powerful automotive system-on-chip, but supply chain disruptions have led to production delays increasing by over 25%. Establishing a universal technical standard for cloud-based vehicle services is proving difficult, hindering 360-degree situational awareness and vehicle-to-pedestrian communication. The cost of deploying edge networking solutions to support intelligent traffic management also remains high.
- Furthermore, improving user interface responsiveness to match consumer electronics expectations, with development cycles being 50% longer, presents an ongoing challenge for automakers.
Exclusive Technavio Analysis on Customer Landscape
The connected car market forecasting report includes the adoption lifecycle of the market, covering from the innovator’s stage to the laggard’s stage. It focuses on adoption rates in different regions based on penetration. Furthermore, the connected car market report also includes key purchase criteria and drivers of price sensitivity to help companies evaluate and develop their market growth analysis strategies.
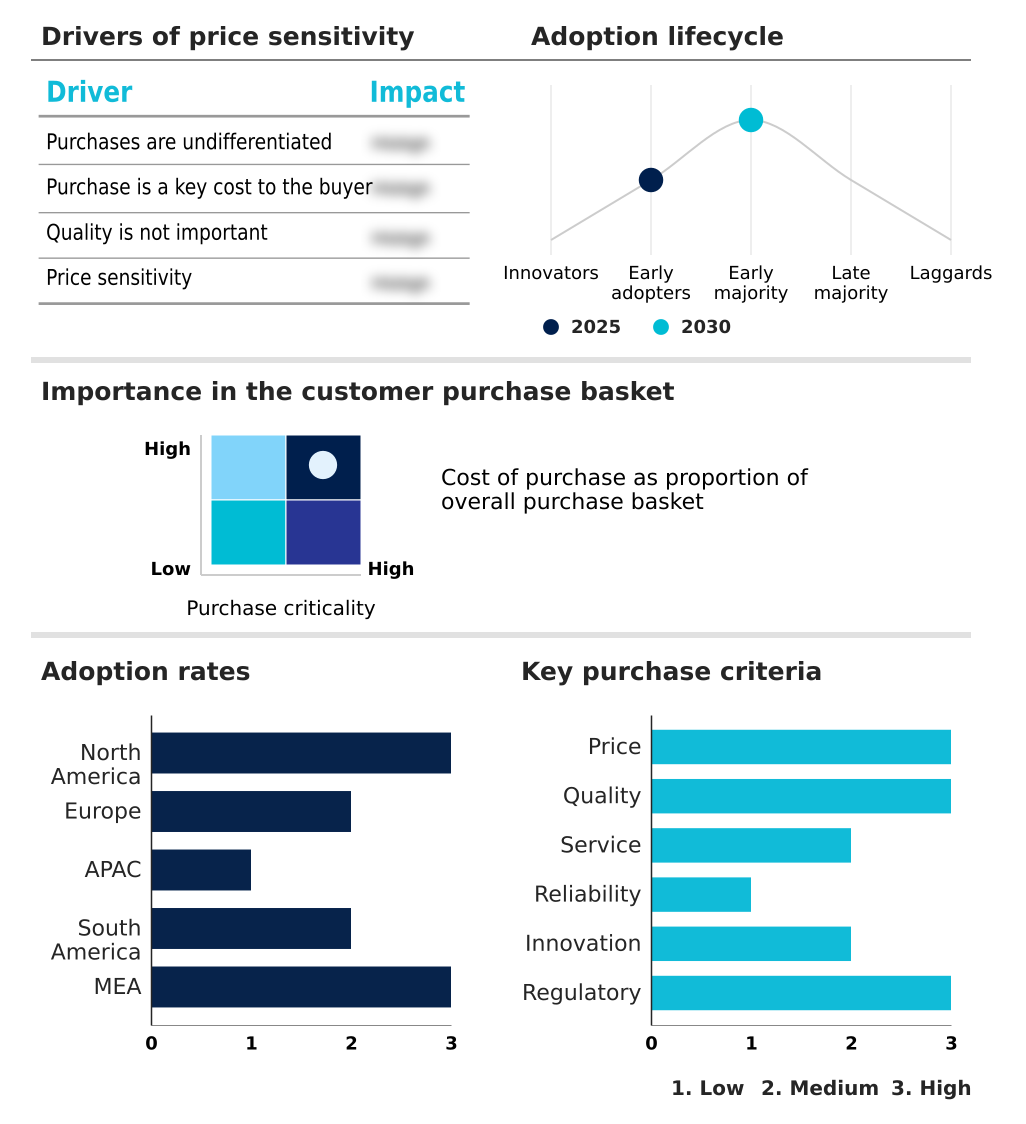
Customer Landscape of Connected Car Industry
Competitive Landscape
Companies are implementing various strategies, such as strategic alliances, connected car market forecast, partnerships, mergers and acquisitions, geographical expansion, and product/service launches, to enhance their presence in the industry.
Aeris Communications Inc. - Delivers end-to-end IoT and connectivity platforms, enabling integrated infrastructure and mobility services across diverse industrial sectors.
The industry research and growth report includes detailed analyses of the competitive landscape of the market and information about key companies, including:
- Aeris Communications Inc.
- Airbiquity Inc.
- Aptiv PLC
- AT and T Inc.
- Cisco Systems Inc.
- Continental AG
- Cubic Telecom Ltd.
- DENSO Corp.
- Geotab Inc.
- Harman International Industries
- Infineon Technologies AG
- Microsoft Corp.
- NXP Semiconductors NV
- Panasonic Holdings Corp.
- Qualcomm Inc.
- Renesas Electronics Corp.
- Robert Bosch GmbH
- Telefonaktiebolaget Ericsson
- Thales Group
- Visteon Corp.
Qualitative and quantitative analysis of companies has been conducted to help clients understand the wider business environment as well as the strengths and weaknesses of key industry players. Data is qualitatively analyzed to categorize companies as pure play, category-focused, industry-focused, and diversified; it is quantitatively analyzed to categorize companies as dominant, leading, strong, tentative, and weak.
Recent Development and News in Connected car market
- In September, 2024, Robert Bosch GmbH announced a substantial investment of over $2.5 billion in artificial intelligence through 2027, with a strong focus on enhancing assisted and automated driving solutions.
- In January, 2025, Qualcomm announced the launch of its new automotive 5G platforms, specifically designed to enhance vehicle connectivity and support the advanced features of autonomous driving.
- In March, 2025, the United States Department of Transportation announced a new initiative to create a nationwide V2X corridor, a project designed to deploy V2X infrastructure along major highways to enable seamless communication between vehicles and roadside units.
- In April, 2025, Volkswagen announced a significant expansion of its Car2X platform to enable real-time sharing of traffic and hazard information, thereby improving road safety and efficiency.
Dive into Technavio’s robust research methodology, blending expert interviews, extensive data synthesis, and validated models for unparalleled Connected Car Market insights. See full methodology.
| Market Scope | |
|---|---|
| Page number | 300 |
| Base year | 2025 |
| Historic period | 2020-2024 |
| Forecast period | 2026-2030 |
| Growth momentum & CAGR | Accelerate at a CAGR of 17.2% |
| Market growth 2026-2030 | USD 161697.9 million |
| Market structure | Fragmented |
| YoY growth 2025-2026(%) | 15.8% |
| Key countries | US, Canada, Mexico, Germany, UK, France, Italy, Spain, The Netherlands, China, Japan, India, South Korea, Australia, Indonesia, Brazil, Argentina, Chile, Saudi Arabia, UAE, South Africa, Israel and Turkey |
| Competitive landscape | Leading Companies, Market Positioning of Companies, Competitive Strategies, and Industry Risks |
Research Analyst Overview
- The connected car market's trajectory is defined by the deep integration of advanced electronics and software. A pivotal boardroom decision for automakers is how to architect their software-defined vehicle architecture to balance in-house development with strategic partnerships. The successful implementation of a high-performance computing platform is central to this, enabling a cohesive in-vehicle infotainment system and robust advanced driver-assistance systems.
- These platforms rely on a secure telematics control unit and an embedded subscriber identity module to manage vehicle-to-everything communication. The shift toward cellular v2x protocol over dedicated short-range communications is accelerating, driven by the need for reliable over-the-air software updates and predictive maintenance algorithms. In vehicle development, this integration has enabled a 30% reduction in diagnostic processing time.
- This ecosystem is supported by innovations in onboard diagnostics port access and telematics data aggregation, which are crucial for executing remote vehicle diagnostics and creating new service opportunities.
What are the Key Data Covered in this Connected Car Market Research and Growth Report?
-
What is the expected growth of the Connected Car Market between 2026 and 2030?
-
USD 161.70 billion, at a CAGR of 17.2%
-
-
What segmentation does the market report cover?
-
The report is segmented by Connectivity (Integrated solutions, Embedded solutions, and Tethered solutions), End-user (OEM, and Aftermarket), Communication Technology (V2I, V2X, and V2V) and Geography (North America, Europe, APAC, South America, Middle East and Africa)
-
-
Which regions are analyzed in the report?
-
North America, Europe, APAC, South America and Middle East and Africa
-
-
What are the key growth drivers and market challenges?
-
Stringent government safety mandates and regulatory frameworks, Cybersecurity vulnerabilities and data privacy concerns
-
-
Who are the major players in the Connected Car Market?
-
Aeris Communications Inc., Airbiquity Inc., Aptiv PLC, AT and T Inc., Cisco Systems Inc., Continental AG, Cubic Telecom Ltd., DENSO Corp., Geotab Inc., Harman International Industries, Infineon Technologies AG, Microsoft Corp., NXP Semiconductors NV, Panasonic Holdings Corp., Qualcomm Inc., Renesas Electronics Corp., Robert Bosch GmbH, Telefonaktiebolaget Ericsson, Thales Group and Visteon Corp.
-
Market Research Insights
- The market's dynamic is shaped by the pursuit of enhanced operational efficiencies and new service-based revenue streams. The adoption of AI-driven telematics and a personalized user experience are becoming key differentiators, with consumer adoption rates for premium connectivity packages showing a 25% uplift in vehicles offering deep smartphone integration.
- In the commercial sector, the use of remote software management to optimize fleets has resulted in an average fuel efficiency improvement of 12%. Furthermore, the move toward a subscription revenue model is gaining traction, yet it faces resistance, as consumer willingness to pay for features post-purchase is nearly 40% lower than for upfront hardware options.
- This environment forces manufacturers to balance innovation with tangible value, navigating a complex landscape of consumer expectations and technological capabilities.
We can help! Our analysts can customize this connected car market research report to meet your requirements.
 RIA -
RIA - 
