
Alternative Fuels Market Size 2024-2028
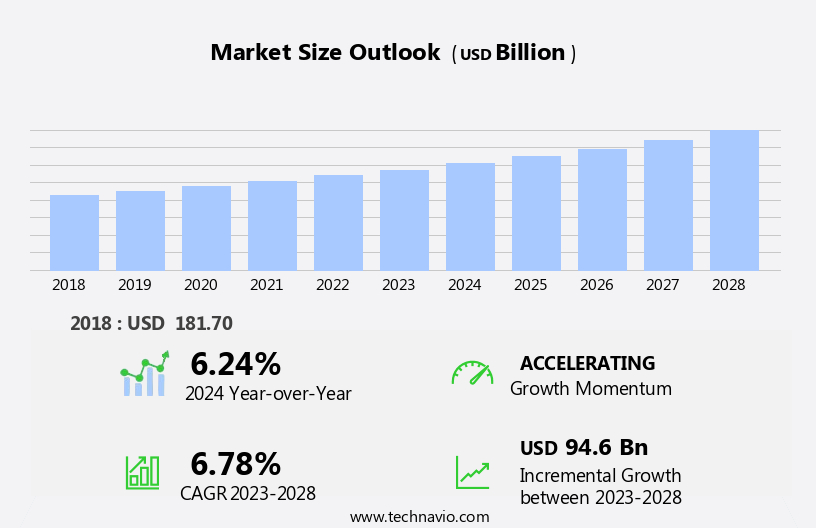
The alternative fuels market size is forecast to increase by USD 94.6 billion at a CAGR of 6.78% between 2023 and 2028.
- The market is experiencing significant growth due to increasing global concerns over greenhouse gas emissions and the need to reduce reliance on traditional fossil fuels. One of the most prominent sectors driving this market's expansion is the transportation industry, where alternative fuels such as biodiesel, ethanol, and compressed natural gas are increasingly being adopted. Furthermore, fluctuations in global crude oil prices continue to make alternative fuels a more cost-effective and attractive option for consumers and businesses alike. However, the market is not without challenges. Regulatory frameworks and infrastructure development are crucial factors that impact market growth. Governments and private entities must invest in the necessary infrastructure to support the production, distribution, and consumption of alternative fuels.
- Additionally, ongoing research and development efforts are essential to improve the efficiency and sustainability of alternative fuel technologies. Companies seeking to capitalize on this market's opportunities must stay abreast of regulatory developments and invest in research and development to stay competitive. By doing so, they can effectively navigate challenges and capitalize on the growing demand for alternative fuels.
What will be the Size of the Alternative Fuels Market during the forecast period?
- The market in the United States is experiencing significant growth as businesses and consumers seek to reduce reliance on fossil fuels and mitigate the environmental impact of conventional vehicles. This market encompasses various alternatives to petroleum-based fuels, including liquefied petroleum gas (LPG), propane, ethanol, biodiesel, hydrogen (H2), and renewable sources such as wind, solar, and hydropower. Key growth factors include increasing environmental consciousness, stringent emission regulations, and the rising cost of imported oil. The market's size is substantial, with millions of gallons of alternative fuels consumed annually. Renewable energy sources, such as wind turbines and solar power, are gaining popularity due to their emission-free nature and ability to reduce greenhouse gas emissions, contributing to the global effort to combat pollution levels and address issues related to global warming.
- Automakers are also investing in clean mobility solutions, such as electric and hydrogen fuel cell vehicles, further driving the demand for alternative fuels. As the market continues to evolve, it is expected to maintain a growth trajectory, with non-renewable resources like petroleum, petrol, diesel, and toxic gases gradually being replaced by cleaner, more sustainable alternatives.
How is this Alternative Fuels Industry segmented?
The alternative fuels industry research report provides comprehensive data (region-wise segment analysis), with forecasts and estimates in "USD billion" for the period 2024-2028, as well as historical data from 2018-2022 for the following segments.
- Application
- Automotive
- Aviation
- Type
- Passenger cars
- Commercial vehicles
- Geography
- APAC
- China
- Japan
- South Korea
- North America
- US
- Europe
- Germany
- South America
- Middle East and Africa
- APAC
By Application Insights
The automotive segment is estimated to witness significant growth during the forecast period.
The European Union (EU) automotive market is witnessing a shift towards alternative fuels, driven by the increasing production of passenger cars and commercial vehicles. Fossil fuels, particularly petroleum, have long been the dominant energy source for the transportation sector. However, concerns over urban air quality, climate change, and emission standards are driving the adoption of alternative fuels such as natural gas, electric mobility, fuel cells, and other fuel types. Natural gas, specifically Compressed Natural Gas (CNG) and Liquefied Natural Gas (LNG), is gaining popularity due to its low-cost and cleaner emissions compared to conventional vehicles. Electric mobility, including battery-electric cars and plug-in hybrids, is also on the rise, with initiatives from automakers like Volvo Cars and VinFast introducing emission-free fleets.
The defense sector is also exploring alternative fuels, particularly hydrogen (H2) and synthetic fuels, for military applications. Hydrogen fuel cells offer zero emissions and high energy efficiency, making them an attractive alternative to traditional fossil fuels. Other fuel types, such as Liquid Ammonia, Biofuels like Bioethanol, Biodiesel, and Dimethyl ether (DME), and even renewable energy sources like Wind turbines and Solar power, are being tested and adopted for various applications in the transportation sector. The increasing adoption of these alternative fuels is expected to reduce the reliance on imported oil and contribute to environmental conservation. The energy sector is also investing in the development of hydrogen filling stations, electric charging points, and other infrastructure to support the transition to cleaner, alternative fuels.
The commercial vehicle segment, including light-duty vehicles and heavy-duty vehicles, is also undergoing electrification, with hybrids and electric buses becoming increasingly common. However, challenges like the rising prices of conventional fuels and the need for a charging and refueling infrastructure remain. The transportation sector, particularly the aviation sector, still relies heavily on fossil fuels, and the transition to alternative fuels is expected to be gradual. In , the automotive market is undergoing a significant transformation, driven by the need to reduce carbon emissions and improve fuel efficiency. Alternative fuels, including natural gas, electric mobility, and renewable energy sources, are expected to play a key role in this transition.
The challenges remain, but positive initiatives from various stakeholders offer hope for a cleaner, more sustainable future for the transportation sector.

Get a glance at the market report of share of various segments Request Free Sample
The Automotive segment was valued at USD 149.20 billion in 2018 and showed a gradual increase during the forecast period.
Regional Analysis
APAC is estimated to contribute 39% to the growth of the global market during the forecast period.Technavio’s analysts have elaborately explained the regional trends and drivers that shape the market during the forecast period.

For more insights on the market size of various regions, Request Free Sample
The European Union (EU) and other regions are pushing for clean mobility solutions to mitigate the impact of transportation on urban air quality and combat climate change. Alternative fuels, including natural gas, electric mobility, fuel cells, and other fuel types, are gaining traction as low-emission alternatives to conventional vehicles. Passenger cars, sedans, and hatchbacks are being transformed into emission-free fleets with electric vehicles (EVs), battery-electric cars, plugin hybrids, and hydrogen (H2) fuel cell vehicles. Natural gas, specifically compressed natural gas (CNG) and liquefied natural gas (LNG), is a popular alternative fuel for passenger cars and commercial vehicles due to its lower carbon intensity compared to conventional fuels.
The energy sector is also investing in renewable energy sources, such as wind turbines and hydroelectricity, to power electric buses and EV-charging stations. The defense sector is also embracing alternative fuels, with some countries testing fuel cell prototypes for military applications. Fuel efficiency is a critical factor in the adoption of alternative fuels, with formulations like biofuels, biodiesel, ethanol, dimethyl ether (DME), propane, and liquefied petroleum gas (LPG) offering improved fuel efficiency and lower carbon emissions. The aviation sector is also exploring alternative fuels, such as synthetic fuels and hydrogen, to reduce carbon emissions. The rising prices of imported oil and increasing emission control standards are further driving the demand for alternative fuels in the logistics and transportation sector.
The future of clean mobility lies in the electrification of vehicles and the expansion of charging points, hydrogen filling stations, and other renewable energy sources.
Market Dynamics
Our researchers analyzed the data with 2023 as the base year, along with the key drivers, trends, and challenges. A holistic analysis of drivers will help companies refine their marketing strategies to gain a competitive advantage.
What are the key market drivers leading to the rise in the adoption of Alternative Fuels Industry?
- Increasing emissions of GHGs is the key driver of the market.
- The global shift towards sustainable energy sources is gaining momentum in response to growing concerns over the environmental impact of fossil fuels. The primary contributors to greenhouse gas (GHG) emissions are transportation, electricity generation, and industrial activities. These emissions result in detrimental effects on the environment, including negative impacts on human health, water quality, crop and livestock damage, and increased energy demand. Furthermore, GHG emissions contribute to climate change, leading to rising temperatures and sea levels. To mitigate these effects and minimize damage to the ecosystem, there is a pressing need for the development and adoption of eco-friendly energy production methods and renewable energy sources.
- This trend is expected to continue as the world strives for a more sustainable energy future.
What are the market trends shaping the Alternative Fuels Industry?
- Increasing use of alternative fuels in transportation sector is the upcoming market trend.
- The transportation sector, which accounts for approximately 30% of global greenhouse gas (GHG) emissions according to the International Energy Agency (IEA), is undergoing a significant transformation towards the adoption of alternative fuels. The growing awareness of climate change, energy security concerns, and the need to reduce reliance on fossil fuels are key drivers propelling this shift. Alternative fuels, including biofuels, natural gas, hydrogen, and electricity, are increasingly being used to power automobiles as part of an ongoing effort to decrease the sector's carbon footprint.
- This trend is expected to continue, as the benefits of alternative fuels become more apparent and technological advancements make their use more practical and cost-effective. The transportation sector's transition to alternative fuels represents a significant opportunity for businesses and investors to capitalize on this growing market.
What challenges does the Alternative Fuels Industry face during its growth?
- Fluctuations in global crude oil prices is a key challenge affecting the industry growth.
- The volatility of global crude oil prices has long-term implications for the market. The price fluctuations of crude oil significantly influence the cost of conventional fuels, such as gasoline and lubricants, which are derived from it. indicates that this dynamic can impact the adoption rate of alternative fuels. For instance, in the aviation industry, which is a major consumer of alternative fuels due to its carbon emissions reduction goals, the use of alternative jet fuels became less economically viable during periods when conventional jet fuel prices dropped below those of alternative fuels.
- This trend underscores the importance of monitoring global crude oil pricing when evaluating the market potential for alternative fuels.
Exclusive Customer Landscape
The alternative fuels market forecasting report includes the adoption lifecycle of the market, covering from the innovator’s stage to the laggard’s stage. It focuses on adoption rates in different regions based on penetration. Furthermore, the alternative fuels market report also includes key purchase criteria and drivers of price sensitivity to help companies evaluate and develop their market growth analysis strategies.

Customer Landscape
Key Companies & Market Insights
Companies are implementing various strategies, such as strategic alliances, alternative fuels market forecast, partnerships, mergers and acquisitions, geographical expansion, and product/service launches, to enhance their presence in the industry.
Ballard Power Systems Inc. - The company specializes in providing advanced fuel solutions for energy stacks and backup power systems, focusing on sustainable and innovative alternatives to traditional fuels. Our offerings cater to various industries, enhancing efficiency, reliability, and reducing environmental impact. These fuel options are designed to seamlessly integrate with existing systems, ensuring minimal disruption to operations. By staying at the forefront of fuel technology, we empower businesses to future-proof their energy strategies and contribute to a more sustainable energy landscape.
The industry research and growth report includes detailed analyses of the competitive landscape of the market and information about key companies, including:
- Ballard Power Systems Inc.
- Blossman Propane Gas and Appliance Inc.
- BP Plc
- Chevron Corp.
- China Petrochemical Corp.
- CNOOC Ltd.
- ENGIE SA
- Equinor ASA
- Exxon Mobil Corp.
- Gazprom International Ltd.
- Gevo Inc.
- Hindustan Petroleum Corp. Ltd.
- Honeywell International Inc.
- LanzaTech Global Inc.
- Neste Corp.
- Nuvera Fuel Cells LLC
- OMV Aktiengesellschaft
- Petroleo Brasileiro SA
- PJSC LUKOIL
- UGI Corp.
Qualitative and quantitative analysis of companies has been conducted to help clients understand the wider business environment as well as the strengths and weaknesses of key industry players. Data is qualitatively analyzed to categorize companies as pure play, category-focused, industry-focused, and diversified; it is quantitatively analyzed to categorize companies as dominant, leading, strong, tentative, and weak.
Research Analyst Overview
Alternative fuels have gained significant attention in the global energy sector as the world shifts towards cleaner and more sustainable energy solutions. The market for alternative fuels is driven by various factors, including urban air quality concerns, emission standards, and the need to reduce reliance on non-renewable resources. Natural gas and electric mobility are two prominent alternative fuel options for the transportation sector. Natural gas, specifically Compressed Natural Gas (CNG) and Liquefied Natural Gas (LNG), offer lower carbon emissions compared to conventional vehicle fuels. The rapid expansion of CNG and LNG infrastructure, including filling stations, is expected to boost the demand for these fuels in the passenger car market.
Electric mobility, on the other hand, is gaining popularity due to its zero-emission capabilities. The market for electric vehicles (EVs), including battery-electric cars and plug-in hybrids, is growing rapidly as automakers invest in research and development and governments offer incentives to promote clean mobility. The availability of public charging infrastructure and the increasing affordability of EVs are also contributing to their adoption. Fuel cells, specifically hydrogen fuel cells, are another alternative fuel technology that is gaining traction. Hydrogen (H2) can be produced from renewable sources, making it a promising alternative to fossil fuels. The defense sector is also exploring the use of hydrogen fuel cells for military applications due to their high energy density and emission-free operation.
The energy sector is also witnessing a shift towards renewable energy sources, including wind turbines and solar power, for the production of alternative fuels. Biofuels, such as bioethanol, biodiesel, and biomethanol, are produced from renewable sources and offer lower carbon emissions compared to conventional fuels. However, the production of biofuels from food crops has been a subject of controversy due to its impact on food prices and availability. The market for alternative fuels is not limited to passenger cars. The logistics and transportation sector, including commercial vehicles and heavy-duty vehicles, are also exploring alternative fuel options to reduce their carbon footprint.
Liquid ammonia, dimethyl ether (DME), and liquid nitrogen are some of the alternative fuels being considered for use in commercial vehicles. The trend towards clean mobility is driven by various factors, including rising prices of imported oil, emission control standards, and the need to address climate change. The electrification of transportation is expected to continue, with EVs and hybrid EVs becoming more affordable and accessible. The availability of charging infrastructure and the expansion of renewable energy sources are key enablers of this trend. The market for alternative fuels is dynamic and evolving, with new technologies and initiatives being developed constantly.
For instance, Vinfast, a Vietnamese automaker, recently unveiled its first electric SUV and plans to build hydrogen filling stations in Vietnam. The use of alternative fuels in the aviation sector is also gaining attention, with companies exploring the use of synthetic fuels and sustainable aviation fuel (SAF) derived from renewable sources. In , the market is driven by various factors, including urban air quality concerns, emission standards, and the need to reduce reliance on non-renewable resources. The market for alternative fuels is diverse, with various technologies and fuel types, including natural gas, electric mobility, fuel cells, biofuels, and renewable energy sources, gaining traction.
The trend towards clean mobility is expected to continue, with electrification and the expansion of renewable energy sources being key enablers.
|
Market Scope |
|
|
Report Coverage |
Details |
|
Page number |
177 |
|
Base year |
2023 |
|
Historic period |
2018-2022 |
|
Forecast period |
2024-2028 |
|
Growth momentum & CAGR |
Accelerate at a CAGR of 6.78% |
|
Market growth 2024-2028 |
USD 94.6 billion |
|
Market structure |
Fragmented |
|
YoY growth 2023-2024(%) |
6.24 |
|
Key countries |
China, US, Japan, South Korea, and Germany |
|
Competitive landscape |
Leading Companies, Market Positioning of Companies, Competitive Strategies, and Industry Risks |
What are the Key Data Covered in this Alternative Fuels Market Research and Growth Report?
- CAGR of the Alternative Fuels industry during the forecast period
- Detailed information on factors that will drive the growth and forecasting between 2024 and 2028
- Precise estimation of the size of the market and its contribution of the industry in focus to the parent market
- Accurate predictions about upcoming growth and trends and changes in consumer behaviour
- Growth of the market across APAC, North America, Europe, South America, and Middle East and Africa
- Thorough analysis of the market’s competitive landscape and detailed information about companies
- Comprehensive analysis of factors that will challenge the alternative fuels market growth of industry companies
We can help! Our analysts can customize this alternative fuels market research report to meet your requirements.
 RIA -
RIA - 
