
Gene Panel Market Size 2024-2028
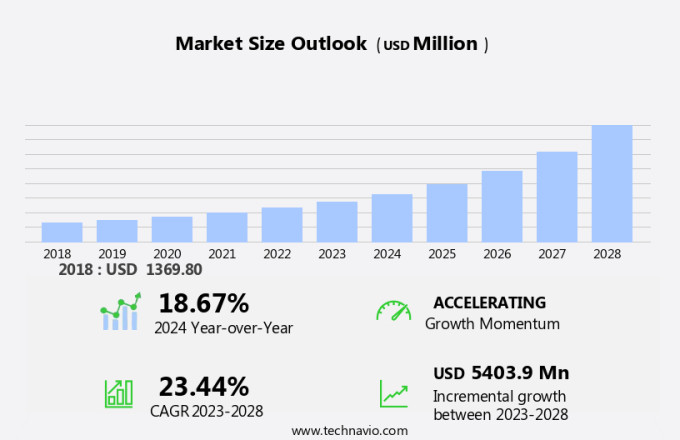
The gene panel market size is forecast to increase by USD 5.40 billion at a CAGR of 23.44% between 2023 and 2028.
- The market is experiencing significant growth due to the increasing utilization of genotyping technologies in various applications, such as cancer risk assessment and the diagnosis of rare disorders. One trend driving market expansion is the adoption of next-generation sequencing (NGS) panels, which offer higher throughput and improved accuracy compared to traditional hybridization approaches. Small panel testing, a type of genetic testing, focuses on the examination of multiple specific genes related to a particular genetic condition. Additionally, collaborations between hospitals, diagnostic laboratories, and research institutions are maximizing research efficiency and driving innovation in gene panel development. However, challenges remain, including the validation of CRISP-based gene panels and addressing issues related to the identification and interpretation of inherited single nucleotide polymorphisms (SNPs) and indels. CD Genomics and other leading players in the market are working to overcome these challenges and expand the reach of gene panels in clinical settings, including the development of pan-cancer and hereditary cancer panels.
What will be the Size of the Market During the Forecast Period?
- Gene panels have emerged as a significant tool in the field of genetics, playing a crucial role in identifying genetic predispositions to various hereditary disorders. These panels consist of multiple genes associated with specific diseases or conditions, enabling clinicians to diagnose and manage genetic disorders more effectively. Genetic predispositions to conditions such as cancer, cardiovascular diseases, diabetes, and arthritis can significantly impact mortality rates and disease progression. Gene panels facilitate the identification of genetic alterations linked to these disorders, allowing for personalized therapeutic interventions and improved disease prognostics.
- In addition, the importance of gene panels extends beyond monogenic defects, as they also play a vital role in oncology. With increasing cancer rates, gene panels help clinicians identify genetic compositions associated with specific types of cancer, enabling early detection and more effective treatment plans. Gene panels are not limited to adult populations; they also play a critical role in diagnosing genetic conditions in children. These panels can help clinicians understand the genetic basis of various disorders, leading to more effective treatment plans and better disease management. The use of gene panels in disease prognostics and therapeutics is a growing trend in personalized medicine.
How is this market segmented and which is the largest segment?
The market research report provides comprehensive data (region-wise segment analysis), with forecasts and estimates in "USD billion" for the period 2024-2028, as well as historical data from 2018-2022 for the following segments.
- Product
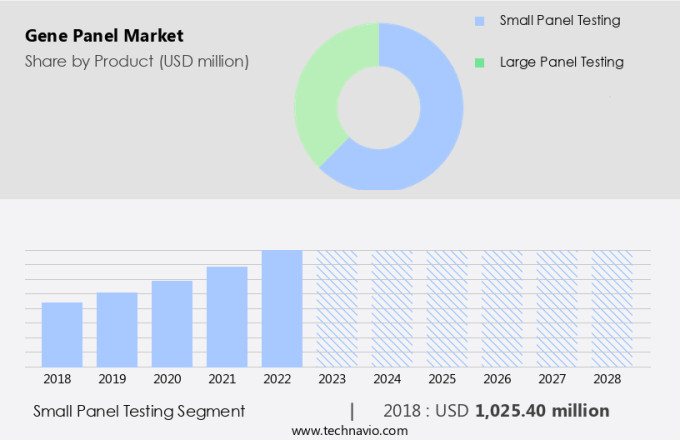
- Small panel testing
- Large panel testing
- Technique
- Amplicon
- Hybridization
- Geography
- North America
- US
- Europe
- Germany
- UK
- France
- Asia
- China
- Rest of World (ROW)
- North America
By Product Insights
- The small panel testing segment is estimated to witness significant growth during the forecast period.
The market experienced significant growth in 2023, with small panel testing accounting for the largest market share. This technique provides valuable information regarding the genetic makeup of an individual, specifically the exons of 1 to 100 genes. The increasing awareness and need to identify known gene mutations within families have fueled the adoption of small panel testing. Genomic Technologies and Genomics have played a crucial role in the advancement of genetic testing, enabling the identification of genetic disorders, including congenital diseases and hereditary conditions. The application of gene panel testing in oncology has also gained traction due to the rising cancer rates and the potential for personalized medicine. In summary, the market is poised for continued expansion as the demand for genetic testing to understand genetic disorders and alterations increases.
Get a glance at the market report of share of various segments Request Free Sample
The small panel testing segment was valued at USD 1.03 billion in 2018 and showed a gradual increase during the forecast period.
Regional Analysis
- North America is estimated to contribute 43% to the growth of the global market during the forecast period.
Technavio's analysts have elaborately explained the regional trends and drivers that shape the market during the forecast period.

For more insights on the market share of various regions, Request Free Sample
In North America, hereditary disorders and cancer continue to drive the growth of the market. The region's advanced healthcare infrastructure provides an excellent platform for companies to develop and research gene panels. Easy accessibility to patients and samples is another significant factor attracting investments in the market. Consequently, the region hosts a substantial number of large and mid-size companies, including Agilent Technologies Inc., offering diverse gene panel solutions. Clinicians increasingly rely on gene panels for diagnosing genetic conditions, estimating mortality rates, and predicting disease prognostics. Furthermore, gene panels aid in identifying genetic predispositions to various monogenic defects and cancer, enabling timely therapeutic interventions.
Market Dynamics
Our researchers analyzed the data with 2023 as the base year, along with the key drivers, trends, and challenges. A holistic analysis of drivers will help companies refine their marketing strategies to gain a competitive advantage.
What are the key market drivers leading to the rise in adoption of Gene Panel Market?
Growing use of gene panels in cancer-targeted therapies is the key driver of the market.
- The market is experiencing significant growth due to the increasing use of these panels for early screening and identification of risk factors for various diseases, particularly cancer. Gene panels are pre-designed or customizable tests that analyze multiple genes simultaneously to identify genetic discrepancies. These tests play a crucial role in the prognostic steps and therapeutic regimes for numerous conditions. In the field of oncology, gene panels are increasingly being utilized for targeted therapies. The rising incidence of cancer and the need for effective treatment options have led pharmaceutical companies to invest heavily in research and development of targeted therapies.
- In addition, many solid tumors are caused by mutations in specific genes, making gene panels an essential tool for identifying these mutations and developing therapies to address them. The integration of clinically relevant target sequences into Next-Generation Sequencing (NGS) based gene panel tests is a significant trend in the market. These tests provide genetic level awareness, enabling early screening for pre-gestational, prenatal, and neonatal conditions, as well as identifying genetic discrepancies associated with Down syndrome and other genetic disorders. The use of methylation microarrays and other advanced technologies further enhances the capabilities of gene panels, making them a valuable tool for healthcare professionals and researchers alike.
What are the market trends shaping the Gene Panel Market?
Collaboration to maximize research efficiency is the upcoming trend in the market.
- In the life sciences sector, there is a growing emphasis on cost reduction, leading numerous companies to form strategic partnerships along the value chain. The market is experiencing a rise in collaborations between companies and academic institutions. These alliances enable companies to tackle the challenges encountered during the research, production, and marketing of gene panels. Furthermore, technology transfer to regional companies is a common aspect of these collaborations. For instance, Agilent Technologies Inc., a major player in the market, entered into a Memorandum of Understanding with Theragen Bio in South Korea in April 2023. These alliances contribute significantly to the advancement of gene panel technology, particularly in areas such as genotyping, CRISP validation, and the identification of Inherited Single Nucleotide Polymorphisms (SNPs), Indels, and other genetic variations.
- In addition, the use of NGS panels, including Pan-cancer panels and hereditary cancer panels, is expanding in hospitals and diagnostic laboratories for rare disorders diagnosis and cancer risk assessment. CD Genomics, a leading provider of gene panel services, is another example of a company collaborating with academic institutions to enhance its offerings. These collaborations underscore the importance of partnerships in driving innovation and growth in the market.
What challenges does Gene Panel Market face during the growth?
Large NGS gene panel implementation issues is a key challenge affecting the market growth.
- The market is witnessing significant growth due to the increasing demand for advanced genetic testing in various medical applications, particularly in transplants and oncology. HLA typing plays a crucial role in organ transplants, ensuring compatibility between donor and recipient. In the case of kidney, liver, and bone marrow transplants, accurate HLA typing is essential for successful outcomes. NGS technologies, such as those offered by Illumina, are revolutionizing the market by enabling the identification of tumor genes, biomarkers, and genomic signatures. Microsatellite instability (MSI) testing is a notable application of gene panels, which is particularly relevant in the context of colorectal cancer.
- Moreover, NGS technologies, including amplicon-based approaches and next-generation sequencing, offer several advantages over traditional methods like Sanger sequencing. They provide faster, more cost-effective, and more comprehensive results, making them increasingly popular in the healthcare sector. The test kits segment of the market is expected to experience substantial growth due to the rising demand for accurate and efficient genetic testing solutions. As the understanding of the role of genetics in various diseases deepens, the need for advanced gene panel testing will continue to grow. In conclusion, the market in the US is poised for substantial growth, driven by the increasing demand for advanced genetic testing in medical applications such as transplants and oncology.
Exclusive Customer Landscape
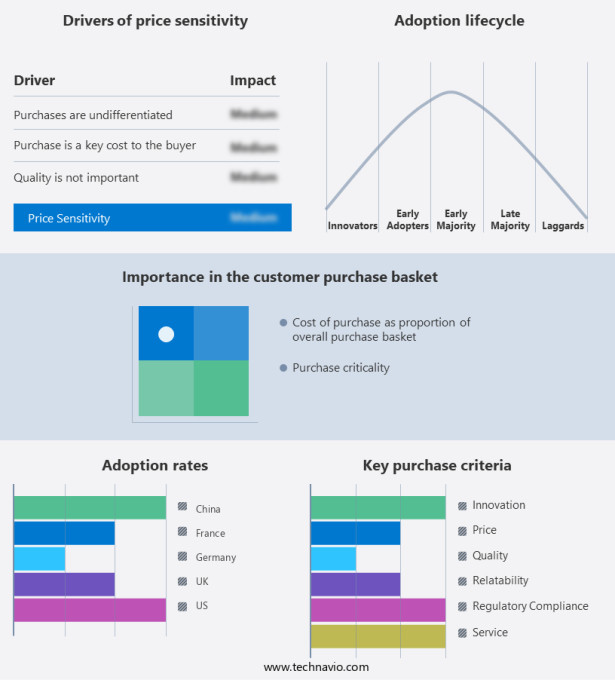
The market forecasting report includes the adoption lifecycle of the market, covering from the innovator's stage to the laggard's stage. It focuses on adoption rates in different regions based on penetration. Furthermore, the market report also includes key purchase criteria and drivers of price sensitivity to help companies evaluate and develop their market growth analysis strategies.
Customer Landscape
Key Companies & Market Insights
Companies are implementing various strategies, such as strategic alliances, market forecast, partnerships, mergers and acquisitions, geographical expansion, and product/service launches, to enhance their presence in the market.
The market research and growth report includes detailed analyses of the competitive landscape of the market and information about key companies, including:
- Agilent Technologies Inc.
- Azenta Inc.
- BGI Genomics Co. Ltd.
- CENTOGENE NV
- Color Health Inc.
- Danaher Corp.
- Eurofins Scientific SE
- F. Hoffmann La Roche Ltd.
- Fagron NV
- GenXPro GmbH
- Illumina Inc.
- Invitae Corp.
- MedGenome Labs Ltd.
- MGZ Medizinisch Genetisches Zentrum
- Novogene Co. Ltd.
- OPKO Health Inc.
- Oxford Nanopore Technologies plc
- QIAGEN NV
- Quest Diagnostics Inc.
- Thermo Fisher Scientific Inc.
Qualitative and quantitative analysis of companies has been conducted to help clients understand the wider business environment as well as the strengths and weaknesses of key market players. Data is qualitatively analyzed to categorize companies as pure play, category-focused, industry-focused, and diversified; it is quantitatively analyzed to categorize companies as dominant, leading, strong, tentative, and weak.
Research Analyst Overview
Gene panels have emerged as a crucial tool in the field of genetics, playing a significant role in the diagnosis and management of various hereditary disorders, including those linked to cancer. These panels allow for the simultaneous screening of multiple genes associated with specific conditions, offering early detection and improved disease prognostics. The incidence rate of genetically predisposed conditions, such as monogenic defects and cancer, continues to rise, making gene panels an essential resource for clinicians. These panels aid in cancer risk assessment, enabling early screening and therapeutic regimes for individuals with a genetic predisposition. Gene panels can be pre-designed or customizable, catering to various therapeutic areas, including oncology, rare disorders, and congenital diseases.
Moreover, technologies like methylation microarray, next-generation sequencing, and genotyping are employed in the creation of these panels, which can identify genetic discrepancies linked to diseases like Down syndrome, HLA typing for transplants, and tumor genes with biomarkers and genomic signatures. Genetic level awareness has increased, leading to pre-gestational, prenatal, and neonatal screening, as well as carrier screening panels, pharmacogenomic panels, and cancer panels. The test kits segment, utilizing approaches like amplicon-based and hybridization, contributes to the growth of this market. Standardization, reimbursement policies, and insurance coverage are essential factors influencing the clinical value and adoption of gene panels. Data analysis, permission, and genetic information are critical components in the effective implementation of these panels. Gene panels have significant implications for chronic diseases like cardiovascular diseases, diabetes, and arthritis, which affect adults with multiple chronic conditions. These panels contribute to personalized medicine and improved patient outcomes.
|
Market Scope |
|
|
Report Coverage |
Details |
|
Page number |
170 |
|
Base year |
2023 |
|
Historic period |
2018-2022 |
|
Forecast period |
2024-2028 |
|
Growth momentum & CAGR |
Accelerate at a CAGR of 23.44% |
|
Market growth 2024-2028 |
USD 5.40 billion |
|
Market structure |
Fragmented |
|
YoY growth 2023-2024(%) |
18.67 |
|
Key countries |
US, Germany, UK, China, and France |
|
Competitive landscape |
Leading Companies, Market Positioning of Companies, Competitive Strategies, and Industry Risks |
What are the Key Data Covered in this Market Research and Growth Report?
- CAGR of the market during the forecast period
- Detailed information on factors that will drive the market growth and forecasting between 2024 and 2028
- Precise estimation of the size of the market and its contribution of the market in focus to the parent market
- Accurate predictions about upcoming market growth and trends and changes in consumer behaviour
- Growth of the market across North America, Europe, Asia, and Rest of World (ROW)
- Thorough analysis of the market's competitive landscape and detailed information about companies
- Comprehensive analysis of factors that will challenge the growth of market companies
We can help! Our analysts can customize this market research report to meet your requirements. Get in touch