Biomarkers Market Size 2024-2028
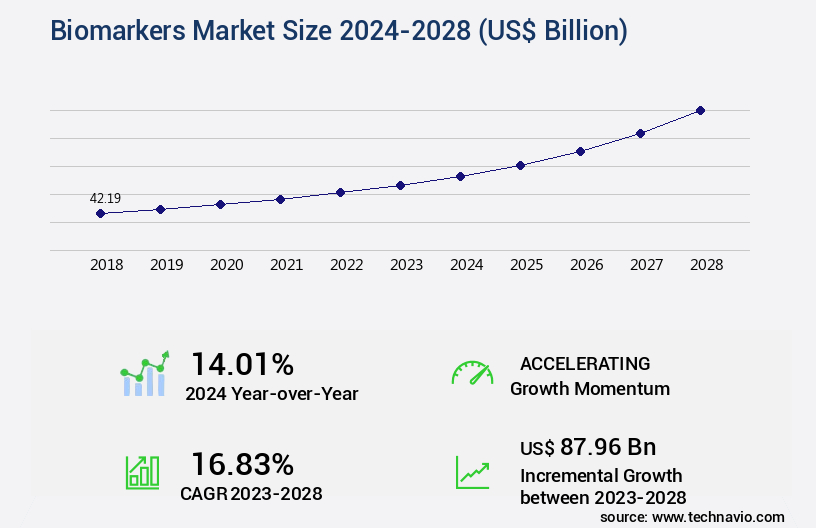
The biomarkers market size is valued to increase USD 87.96 billion, at a CAGR of 16.83% from 2023 to 2028. Increasing prevalence of heart diseases will drive the biomarkers market.
Major Market Trends & Insights
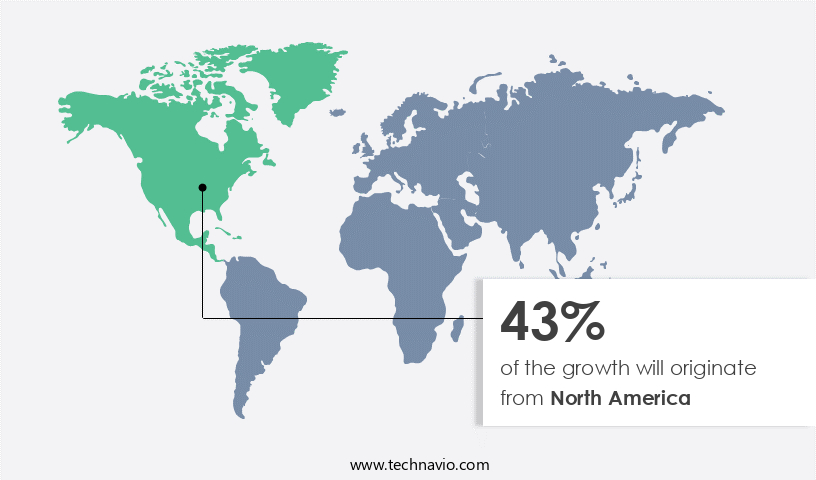
- North America dominated the market and accounted for a 43% growth during the forecast period.
- By Type - Safety segment was valued at USD 23.74 billion in 2022
- By Application - Drug discovery and development segment accounted for the largest market revenue share in 2022
Market Size & Forecast
- Market Opportunities: USD 285.75 billion
- Market Future Opportunities: USD 87960.40 billion
- CAGR : 16.83%
- North America: Largest market in 2022
Market Summary
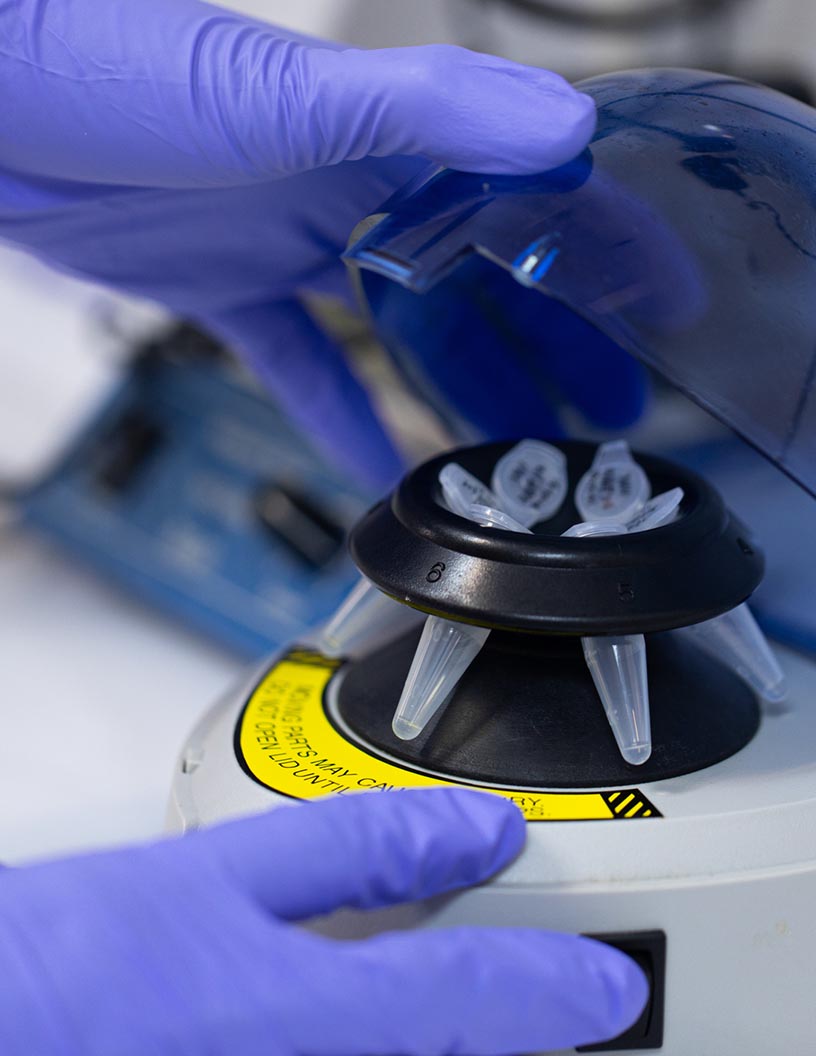
- The market represents a significant and continually evolving sector in the healthcare industry. This market encompasses the development, identification, and utilization of various biological molecules to detect diseases or determine the effectiveness of medical treatments. Core technologies and applications, such as proteomics, genomics, and metabolomics, are driving innovation in this field. The increasing prevalence of heart diseases, cancer, and neurological disorders is fueling the growing number of research and development programs and new product launches. However, the high cost associated with the development and validation of biomarker tests and infrastructure poses a challenge.
What will be the Size of the Biomarkers Market during the forecast period?
Get Key Insights on Market Forecast (PDF) Request Free Sample
How is the Biomarkers Market Segmented and what are the key trends of market segmentation?
The biomarkers industry research report provides comprehensive data (region-wise segment analysis), with forecasts and estimates in "USD billion" for the period 2024-2028, as well as historical data from 2018-2022 for the following segments.
- Type
- Safety
- Efficacy
- Validation
- Application
- Drug discovery and development
- Diagnostics
- Personalized medicine
- Offering
- Consumables (Assay Kits, Reagents, Columns & Filters)
- Services
- Software
- Disease Area
- Oncology
- Neurology
- Cardiology
- Infectious Diseases
- Inflammatory Diseases
- Geography
- North America
- US
- Canada
- Europe
- France
- Germany
- Italy
- UK
- Middle East and Africa
- Egypt
- KSA
- Oman
- UAE
- APAC
- China
- India
- Japan
- South America
- Argentina
- Brazil
- Rest of World (ROW)
- North America
By Type Insights
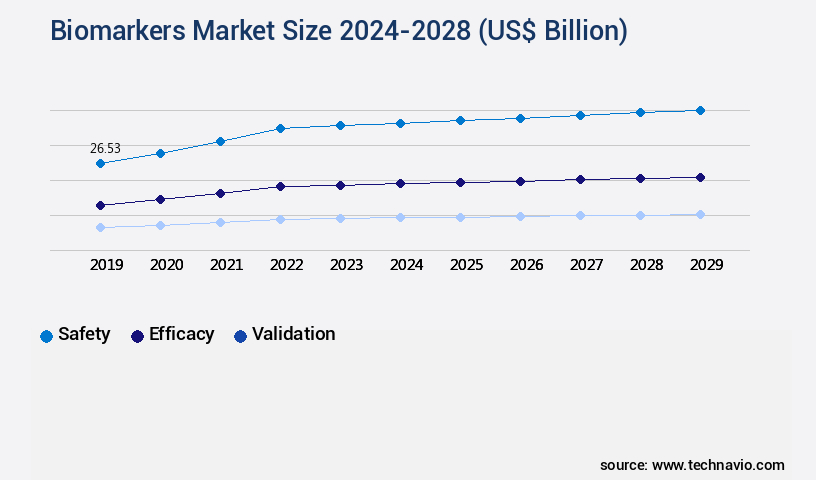
The safety segment is estimated to witness significant growth during the forecast period.
In the dynamic and evolving market, various types of assays, such as multiplex and immunological, play a pivotal role in biomarker discovery and analysis. Statistical modeling, pathway enrichment analysis, and gene ontology analysis are integral to early disease detection and personalized medicine. Biomarker discovery platforms, including next-generation sequencing and genomic biomarker discovery, are driving innovation. Biomarker data analysis, diagnostic test accuracy, and biomarker validation studies are crucial for the development of biomarker signatures, which aid in disease progression monitoring. Liquid biopsy techniques, clinical trial biomarkers, and miRNA expression profiling contribute to cancer biomarker identification. Metabolic pathway analysis and molecular imaging biomarkers are essential for drug response prediction.
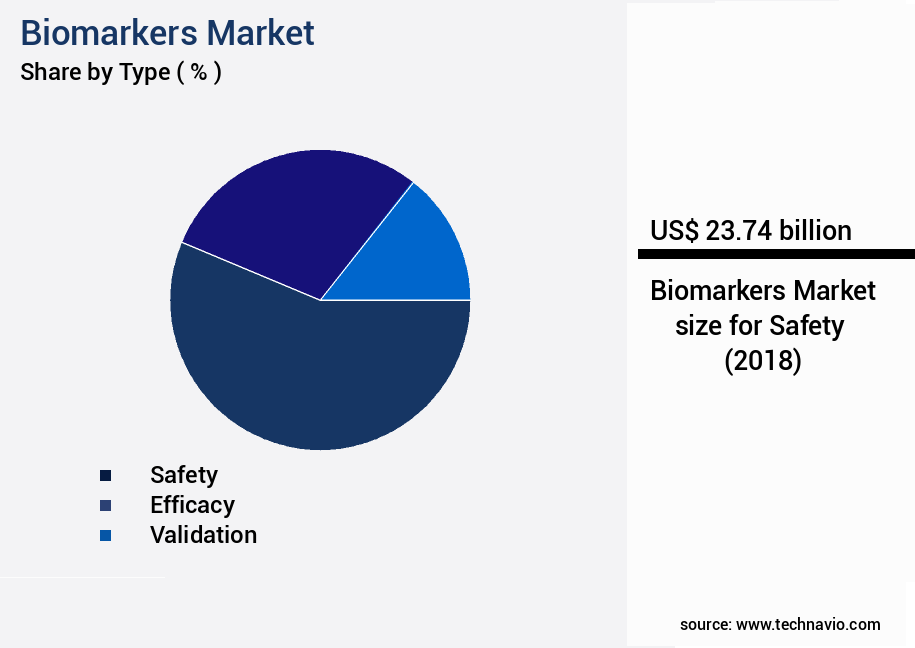
The Safety segment was valued at USD 23.74 billion in 2018 and showed a gradual increase during the forecast period.
Network analysis, high-throughput screening, and gene expression signatures are integral to understanding protein post-translational modifications and circulating tumor cells. Machine learning algorithms are increasingly used to analyze complex biomarker data. The market for biomarkers is substantial, with safety biomarks accounting for 55% of the market share in 2023. Moreover, the market is projected to expand significantly, with diagnostic markers expected to grow by 30% and proteomic biomarker profiling by 25%. These trends underscore the importance of biomarkers in various sectors, including healthcare, pharmaceuticals, and research.
Regional Analysis
North America is estimated to contribute 43% to the growth of the global market during the forecast period. Technavio's analysts have elaborately explained the regional trends and drivers that shape the market during the forecast period.
See How Biomarkers Market Demand is Rising in North America Request Free Sample
The North American region led the market in 2023, with the US accounting for the largest market share. Over the past decade, there's been a significant increase in drug labels with molecular biomarker information approved by the US Food and Drug Administration (USFDA). This trend is driven by the rising prevalence of chronic diseases in the US, where six out of ten adults have at least one chronic condition, and four out of ten adults have two or more.
According to the National Center for Chronic Disease Prevention and Health Promotion, updated in January 2021, this trend is expected to continue, necessitating the development and adoption of efficient and precise biomarkers. In the last ten years, the number of approved drug labels with molecular biomarker information has surged, underscoring the market's dynamic nature.
Market Dynamics
Our researchers analyzed the data with 2023 as the base year, along with the key drivers, trends, and challenges. A holistic analysis of drivers will help companies refine their marketing strategies to gain a competitive advantage.
The market encompasses the development, identification, and application of various molecular indicators for disease diagnosis, prognosis, and therapeutic response prediction. This market witnesses significant growth due to the increasing focus on personalized medicine and early disease detection. Plasma protein biomarker identification plays a crucial role in disease prediction, while mRNA expression levels provide valuable insights into disease progression. In the realm of cancer research, tumor microenvironment biomarker analysis and novel cancer biomarker discovery approaches are gaining prominence. Multi-omics biomarker integration, combining data from genomic, proteomic, and metabolomic analyses, offers a more comprehensive understanding of disease mechanisms.
Non-invasive biomarker detection methods, such as liquid biopsy biomarker panel development and circulating exosome biomarker detection, have emerged as essential tools for early detection and disease monitoring. Microrna biomarker identification in cancer and disease severity biomarker measurement are other key areas of research. The biomarker development regulatory guidelines and clinical trial biomarker qualification ensure the validation and statistical methods used for biomarker discovery are rigorous and reliable. High-throughput biomarker screening assays facilitate the efficient identification of potential biomarkers. Compared to traditional diagnostic methods, the adoption of biomarker-based approaches is growing rapidly. For instance, more than 60% of new diagnostic tests in development incorporate biomarkers, indicating a substantial shift towards more precise and personalized diagnostic tools.
This trend is expected to continue, driving market growth and transforming the diagnostic landscape.
What are the key market drivers leading to the rise in the adoption of Biomarkers Industry?
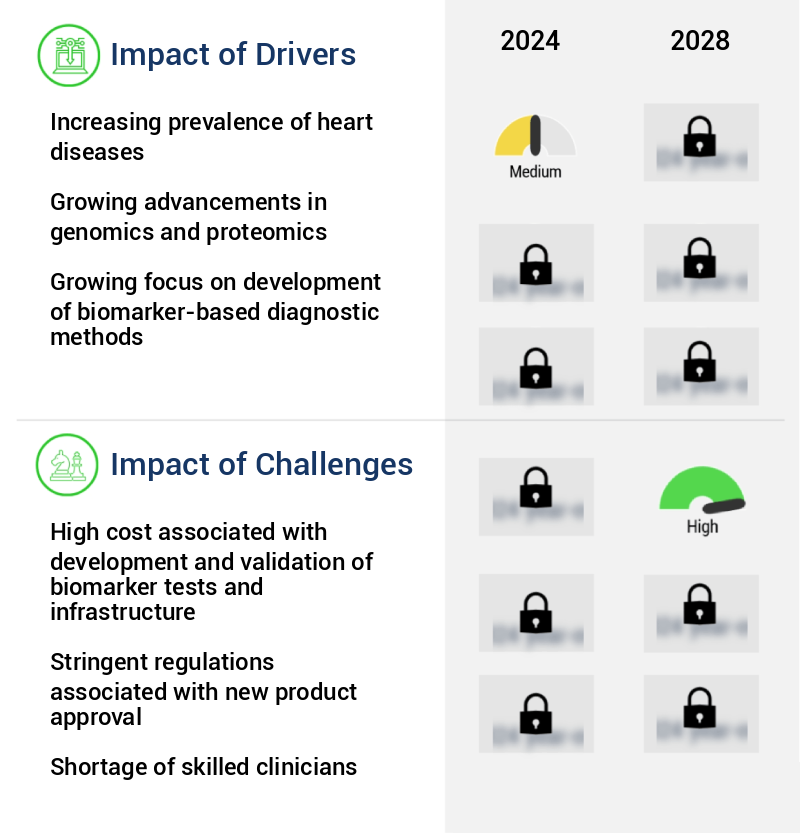
- The escalating incidence of heart diseases serves as the primary market driver.
- The market for biomarkers is experiencing notable growth due to the increasing prevalence of various health conditions, particularly heart diseases. Heart disease is a significant health concern, accounting for a substantial number of deaths across racial and ethnic groups in the United States. Biomarkers play a crucial role in identifying and managing these conditions. For instance, natriuretic peptides are extensively used to diagnose heart failure and monitor its progression. C-reactive protein, another biomarker, is employed to detect inflammation, which is a common factor in heart diseases.
- The demand for biomarkers is expected to persist as heart diseases continue to pose a major health challenge. Incorporating biomarkers into healthcare practices enhances the accuracy of diagnoses and facilitates effective treatment plans. The ongoing advancements in biotechnology and the expanding application scope of biomarkers further fuel market growth.
What are the market trends shaping the Biomarkers Industry?
- The increasing number of research and development programs and the subsequent new product launches represent a significant market trend.
- The market is experiencing significant momentum, driven by the increasing number of research initiatives and new product launches. For instance, a study published in the British Journal of Cancer in October 2022 highlighted the potential of using the BC-116 biomarker panel for detecting primary Bladder Cancer. This test could potentially reduce the need for frequent cystoscopies during surveillance if it achieves a high negative predictive value. The BC-116 panel demonstrated an 89% sensitivity and 67% specificity in its validation. Moreover, in February 2022, the Foundation for the National Institutes of Health (FNIH) initiated a new project, "Neurofilament as a Fluid Biomarker of Neurodegeneration in Familial Frontotemporal Degeneration (FTD)," to identify the most effective blood tests for measuring a crucial protein in the early detection of rare neurodegenerative diseases.
- These developments underscore the market's continuous evolution and the growing importance of biomarkers in various sectors, including healthcare and diagnostics.
What challenges does the Biomarkers Industry face during its growth?
- The high cost of developing and validating biomarker tests and infrastructure poses a significant challenge to the growth of the industry. This expense encompasses the research, development, and implementation of advanced technologies and regulatory compliance, which can hinder market expansion.
- The market is characterized by significant challenges related to cost and infrastructure. Developing and validating biomarker tests necessitates substantial investments in specialized facilities, advanced technologies, and skilled personnel. These infrastructure requirements can be prohibitive for smaller institutions or healthcare providers with limited resources, restricting their participation in biomarker research and the provision of biomarker-based diagnostics and therapies. Furthermore, the expenses involved in biomarker discovery, validation, and commercialization can be substantial.
- These financial hurdles can hinder the widespread adoption and accessibility of biomarker-based solutions, limiting their potential impact on healthcare and disease management. Despite these challenges, the market continues to evolve, with ongoing research and innovation driving advancements in diagnostic and therapeutic applications.
Exclusive Customer Landscape
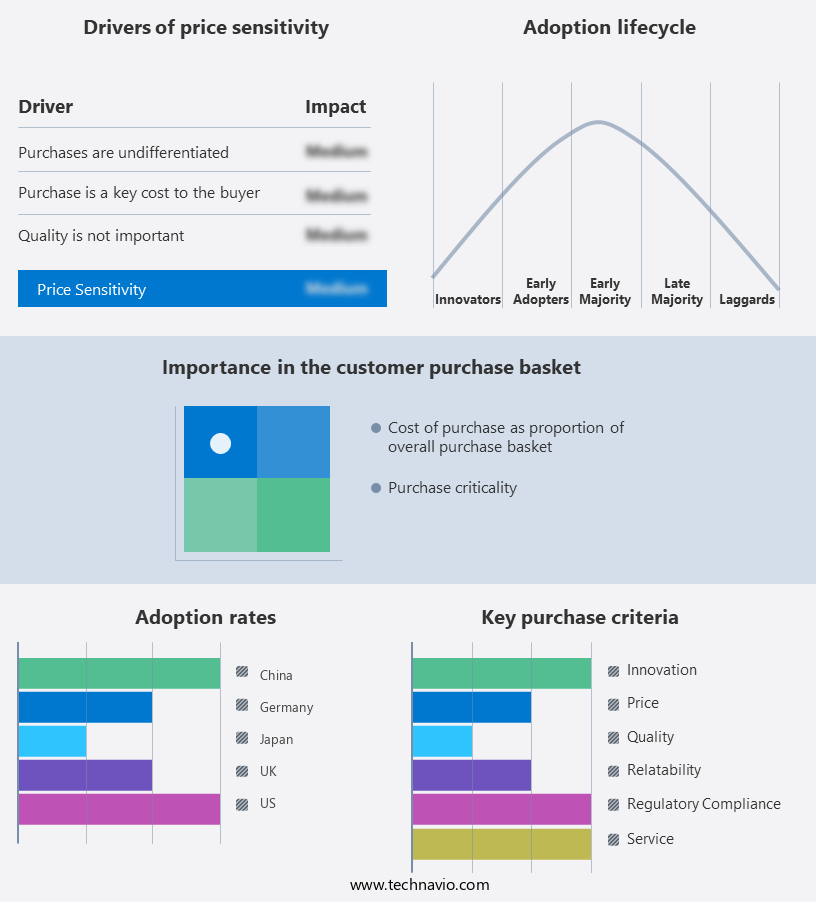
The biomarkers market forecasting report includes the adoption lifecycle of the market, covering from the innovator's stage to the laggard's stage. It focuses on adoption rates in different regions based on penetration. Furthermore, the biomarkers market report also includes key purchase criteria and drivers of price sensitivity to help companies evaluate and develop their market growth analysis strategies.
Customer Landscape of Biomarkers Industry
Competitive Landscape & Market Insights
Companies are implementing various strategies, such as strategic alliances, biomarkers market forecast, partnerships, mergers and acquisitions, geographical expansion, and product/service launches, to enhance their presence in the industry.
Abbott Laboratories - This company specializes in the development and provision of innovative biomarkers, including proprietary assays for cardiovascular health, infectious diseases, and oncology.
The industry research and growth report includes detailed analyses of the competitive landscape of the market and information about key companies, including:
- Abbott Laboratories
- Abcam plc
- Agilent Technologies Inc.
- Becton Dickinson and Co.
- BG Medicine Inc.
- Bio Techne Corp.
- CENTOGENE NV
- Charles River Laboratories International Inc.
- DiaSorin Spa
- EKF Diagnostics Holdings Plc
- Eurofins Scientific SE
- F. Hoffmann La Roche Ltd.
- General Electric Co.
- Merck KGaA
- Meso Scale Diagnostics LLC
- Nexus Dx Inc.
- QIAGEN NV
- Quest Diagnostics Inc.
- Siemens AG
- Thermo Fisher Scientific Inc.
Qualitative and quantitative analysis of companies has been conducted to help clients understand the wider business environment as well as the strengths and weaknesses of key industry players. Data is qualitatively analyzed to categorize companies as pure play, category-focused, industry-focused, and diversified; it is quantitatively analyzed to categorize companies as dominant, leading, strong, tentative, and weak.
Recent Development and News in Biomarkers Market
- In January 2024, Roche Diagnostics announced the launch of its new Elecsys MAGLUMI 200 Pro platform, which includes a test for the detection of major biomarkers associated with liver diseases, such as Alpha-Fetoprotein, Alkaline Phosphatase, and Total Bilirubin. This expansion of their diagnostic offerings underscores their commitment to improving disease management and patient care in the field of liver health (Roche Diagnostics Press Release).
- In March 2024, Illumina and Mayo Clinic Laboratories entered into a strategic collaboration to develop and commercialize next-generation sequencing-based biomarker tests for various diseases, including cancer and neurological disorders. This partnership combines Illumina's expertise in genomic sequencing and Mayo Clinic's clinical and research capabilities to advance the field of personalized medicine (Illumina Press Release).
- In May 2024, Quanterix, a leading provider of ultra-sensitive biomarker detection technologies, raised USD 120 million in a Series F financing round, bringing their total funding to over USD 500 million. The funds will be used to support the commercialization of their Single Molecule Array (Simoa) technology and expand their global reach (Quanterix Press Release).
- In April 2025, the US Food and Drug Administration (FDA) granted approval to Myriad Genetics for their BRACAnalysis CDx test, which identifies HER2 mutations in breast cancer patients, enabling personalized treatment with Herceptin. This approval marks a significant milestone in the field of precision medicine and underscores the importance of biomarker testing in cancer care (FDA Press Release).
Dive into Technavio's robust research methodology, blending expert interviews, extensive data synthesis, and validated models for unparalleled Biomarkers Market insights. See full methodology.
|
Market Scope |
|
|
Report Coverage |
Details |
|
Page number |
167 |
|
Base year |
2023 |
|
Historic period |
2018-2022 |
|
Forecast period |
2024-2028 |
|
Growth momentum & CAGR |
Accelerate at a CAGR of 16.83% |
|
Market growth 2024-2028 |
USD 87.96 billion |
|
Market structure |
Fragmented |
|
YoY growth 2023-2024(%) |
14.01 |
|
Key countries |
US, Canada, Germany, UK, Italy, France, China, India, Japan, Brazil, Egypt, UAE, Oman, Argentina, KSA, UAE, Brazil, and Rest of World (ROW) |
|
Competitive landscape |
Leading Companies, Market Positioning of Companies, Competitive Strategies, and Industry Risks |
Research Analyst Overview
- The market is a dynamic and evolving landscape, driven by advancements in technology and research. Multiplex biomarker assays have emerged as a significant area of focus, enabling the simultaneous measurement of multiple biomarkers for enhanced disease diagnosis and monitoring. Statistical modeling plays a crucial role in biomarker discovery and analysis, helping to identify patterns and correlations within complex biological data. Immunological biomarker assays, for instance, have shown promise in early disease detection and disease progression monitoring. Pathway enrichment analysis and gene ontology analysis are essential tools in understanding the underlying biological mechanisms of various diseases. Biomarker discovery platforms, such as next-generation sequencing and genomic biomarker discovery, continue to uncover new personalized medicine markers.
- Biomarker data analysis, including diagnostic test accuracy and biomarker validation studies, is crucial for ensuring the reliability and clinical utility of these markers. Biomarker signatures, derived from liquid biopsy techniques, molecular imaging biomarkers, and cancer biomarker identification, are transforming disease diagnosis and treatment. Machine learning algorithms, including protein post-translational modifications, circulating tumor cells, drug response prediction, network analysis, and high-throughput screening, are revolutionizing the field of biomarker research. These advanced technologies enable the identification of gene expression signatures and biofluid analysis techniques, contributing to more accurate and effective disease diagnosis and treatment strategies. In summary, the market is characterized by continuous innovation and growth, with ongoing research and technological advancements driving the discovery and application of new biomarkers for various diseases.
What are the Key Data Covered in this Biomarkers Market Research and Growth Report?
-
What is the expected growth of the Biomarkers Market between 2024 and 2028?
-
USD 87.96 billion, at a CAGR of 16.83%
-
-
What segmentation does the market report cover?
-
The report segmented by Type (Safety, Efficacy, and Validation), Application (Drug discovery and development, Diagnostics, and Personalized medicine), Geography (North America, Europe, Asia, and Rest of World (ROW)), Offering (Consumables (Assay Kits, Reagents, Columns & Filters), Services, and Software), and Disease Area (Oncology, Neurology, Cardiology, Infectious Diseases, and Inflammatory Diseases)
-
-
Which regions are analyzed in the report?
-
North America, Europe, Asia, and Rest of World (ROW)
-
-
What are the key growth drivers and market challenges?
-
Increasing prevalence of heart diseases, High cost associated with development and validation of biomarker tests and infrastructure
-
-
Who are the major players in the Biomarkers Market?
-
Key Companies Abbott Laboratories, Abcam plc, Agilent Technologies Inc., Becton Dickinson and Co., BG Medicine Inc., Bio Techne Corp., CENTOGENE NV, Charles River Laboratories International Inc., DiaSorin Spa, EKF Diagnostics Holdings Plc, Eurofins Scientific SE, F. Hoffmann La Roche Ltd., General Electric Co., Merck KGaA, Meso Scale Diagnostics LLC, Nexus Dx Inc., QIAGEN NV, Quest Diagnostics Inc., Siemens AG, and Thermo Fisher Scientific Inc.
-
Market Research Insights
- The market encompasses a diverse range of technologies and applications, including single-cell analysis, tissue biomarker staining, digital PCR, cell surface markers, genotyping technologies, bioinformatics tools, Western blotting, ELISA assays, diagnostic applications, biomarker databases, therapeutic applications, receptor-ligand interactions, quantitative PCR, serum biomarker detection, imaging mass cytometry, plasma biomarker levels, intracellular signaling, proteomics technologies, flow cytometry, clinical validation, microarray technology, predictive applications, enzyme activity assays, metabolomics technologies, and prognostic applications.
- Notably, diagnostic applications accounted for the largest market share in 2020, while therapeutic applications are anticipated to experience the fastest growth during the forecast period. The integration of advanced technologies, such as digital PCR and bioinformatics tools, is driving innovation and expanding the scope of biomarker applications across various industries.
We can help! Our analysts can customize this biomarkers market research report to meet your requirements.
 RIA -
RIA - 
