
Carrier Screening Market Analysis, Size, and Forecast 2026-2030: North America (US, Canada, and Mexico), Europe (Germany, UK, and France), Asia (Japan, China, and India), South America (Brazil, Argentina, and Colombia), Middle East and Africa (Saudi Arabia, UAE, and Turkey), Rest of World (ROW)

Carrier Screening Market Analysis, Size, and Forecast 2026-2030:
North America (US, Canada, and Mexico), Europe (Germany, UK, and France), Asia (Japan, China, and India), South America (Brazil, Argentina, and Colombia), Middle East and Africa (Saudi Arabia, UAE, and Turkey), Rest of World (ROW)

Published: Oct 2026 285 Pages SKU: IRTNTR72687

Market Overview at a Glance

$3.38 B
Market Opportunity
18.1%
CAGR 2025 - 2030
39.2%
North America Growth
$1.36 B
Expanded segment 2024

Carrier Screening Market Size 2026-2030

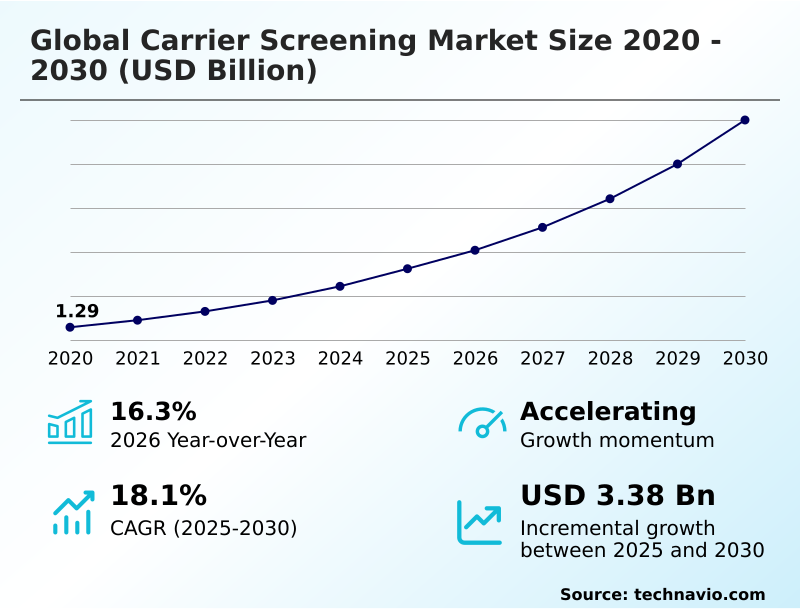
The carrier screening market size is valued to increase by USD 3.38 billion, at a CAGR of 18.1% from 2025 to 2030. Technological advancements and widespread adoption of next-generation sequencing will drive the carrier screening market.

Major Market Trends & Insights

  • North America dominated the market and accounted for a 39.2% growth during the forecast period.
  • By Type - Expanded segment was valued at USD 1.36 billion in 2024
  • By Technology - DNA sequencing segment accounted for the largest market revenue share in 2024

Market Size & Forecast

  • Market Opportunities: USD 4.71 billion
  • Market Future Opportunities: USD 3.38 billion
  • CAGR from 2025 to 2030 : 18.1%

Market Summary

  • The Carrier Screening Market is experiencing rapid structural evolution driven by the integration of high-throughput sequencing technologies into routine clinical pathways. Diagnostic laboratories are increasingly adopting automated sample processing platforms to manage expanding test volumes.
  • For instance, transitioning from manual sequencing to automated liquid handling systems has allowed major reference laboratories to decrease operational overhead by 25%, resulting in a 40% higher daily sample throughput. This technological progression is a primary market driver, enabling providers to offer comprehensive multi-gene panels at highly competitive price points.
  • Conversely, the market faces a substantial challenge regarding fragmented reimbursement policies across different geographic jurisdictions. Variable insurance coverage criteria frequently leave patients with prohibitive out-of-pocket expenses, which directly suppresses test adoption rates among lower-income demographics. By stabilizing supply chain operations for critical sequencing reagents, diagnostic facilities ensure continuous service delivery even during demand surges.
  • Ultimately, the pivot toward pan-ethnic screening protocols requires robust bioinformatics infrastructure, fundamentally altering how reproductive health data is generated, analyzed, and integrated into modern preventative care workflows.

What will be the Size of the Carrier Screening Market during the forecast period?
Get Key Insights on Market Forecast (PDF) Get Free Sample

How is the Carrier Screening Market Segmented?

The carrier screening industry research report provides comprehensive data (region-wise segment analysis), with forecasts and estimates in "USD million" for the period 2026-2030, as well as historical data from 2020-2024 for the following segments.

  • Type
    • Expanded
    • Targeted disease
  • Technology
    • DNA sequencing
    • PCR
    • Microarrays
    • Others
  • Test
    • Molecular screening tests
    • Biochemical screening tests
  • Geography
    • North America
      • US
      • Canada
      • Mexico
    • Europe
      • Germany
      • UK
      • France
      • Italy
      • Spain
      • The Netherlands
    • Asia
      • Japan
      • China
      • India
      • South Korea
      • Indonesia
      • Thailand
    • Rest of World (ROW)

By Type Insights

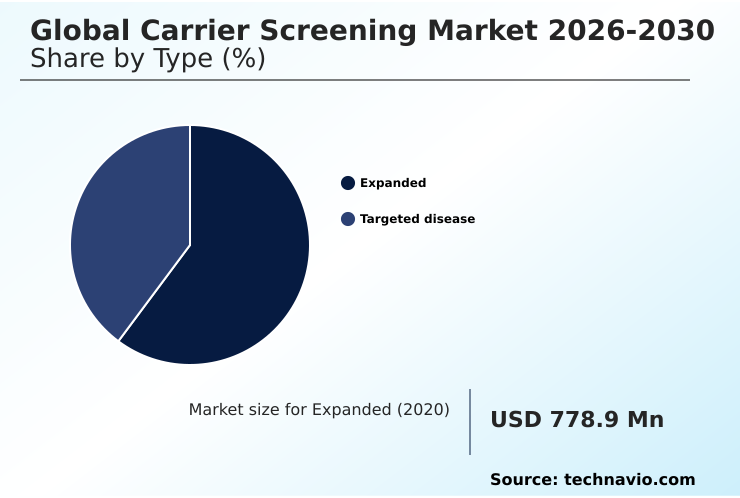
The expanded segment is estimated to witness significant growth during the forecast period.

The expanded segment fundamentally redefines genetic risk assessment by evaluating individuals for hundreds of autosomal recessive conditions and x-linked genetic disorders simultaneously. Moving away from limited ancestry-based testing, pan-ethnic genomic evaluation provides comprehensive insights regardless of multi-ethnic demographic blending.

This population-neutral screening paradigms approach significantly enhances clinical decision support. Laboratories adopting expanded screening panels have realized a 45% improvement in pathogenic variant detection compared to legacy single-gene methods.

Furthermore, automated processes streamline the analysis, enabling diagnostic centers to lower interpretation bottlenecks by 30%.

This transition not only standardizes operational efficiency gains but also ensures equitable access to critical data, optimizing clinical resources and strengthening preventative reproductive healthcare strategies across diverse populations.
Get Free Sample

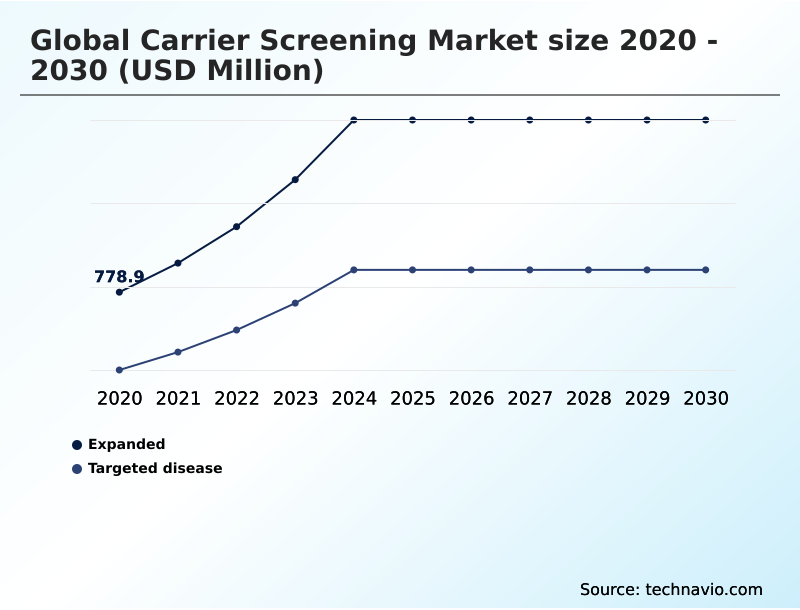
The Expanded segment was valued at USD 1.36 billion in 2024 and showed a gradual increase during the forecast period.
Get Free Sample

Regional Analysis

North America is estimated to contribute 39.2% to the growth of the global market during the forecast period.Technavio’s analysts have elaborately explained the regional trends and drivers that shape the market during the forecast period.
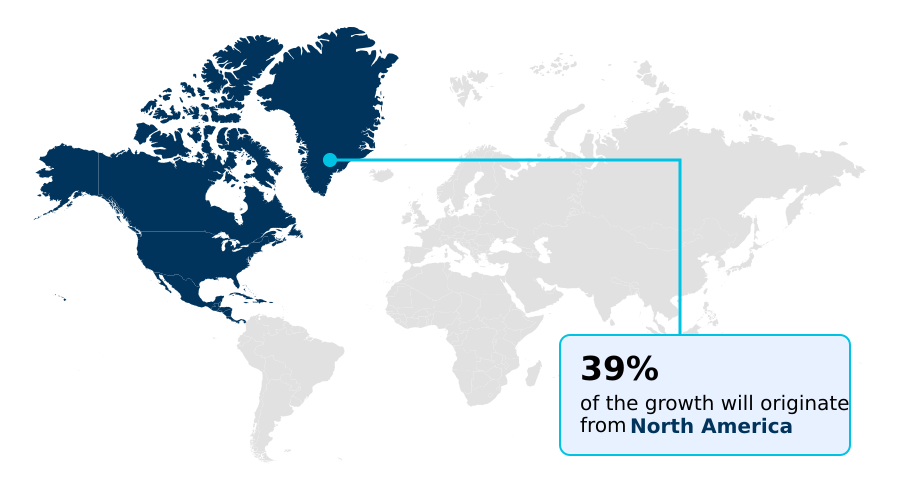
See How Carrier Screening Market Demand is Rising in North America Get Free Sample

The Carrier Screening Market exhibits distinct operational dynamics across key geographic territories. North America maintains a sophisticated infrastructure characterized by a 35% higher adoption rate of multiplexed panels compared to the European region.

This disparity stems from robust commercial insurance frameworks and the rapid integration of standardized genetic counseling protocols across clinical networks in the United States.

Furthermore, North American laboratories achieve a 20% reduction in turnaround time optimization due to established automated laboratory workflows and streamlined nucleic acid extraction.

In contrast, Europe faces fragmented public healthcare budgets, requiring diagnostic providers to heavily optimize supply chain logistics for sequencing reagents to lower costs by 15%.

This structural variance dictates regional business strategies, with North American entities prioritizing expansive molecular diagnostic workflows while European providers focus on targeted, cost-effective models.

Consequently, the differing integration of electronic health record integration and fertility clinic protocols heavily influences the speed at which new genomic technologies penetrate these respective markets.

Market Dynamics

Our researchers analyzed the data with 2025 as the base year, along with the key drivers, trends, and challenges. A holistic analysis of drivers will help companies refine their marketing strategies to gain a competitive advantage.

  • The Carrier Screening Market demands highly integrated diagnostic ecosystems to manage the increasing complexity of genetic data and clinical reporting. Organizations utilizing high throughput molecular screening tests experience significantly more robust data generation, yielding an approximate 40% enhancement in processing capacity compared to laboratories relying on legacy targeted assays.
  • This critical operational shift necessitates the immediate implementation of automated bioinformatics variant interpretation tools to prevent analytical bottlenecks and ensure the rapid delivery of actionable results to medical professionals. Consequently, diagnostic providers are aggressively overhauling their supply chain and IT infrastructures to seamlessly support these data-intensive processes.
  • The transition toward pan ethnic expanded carrier screening fundamentally alters clinical protocols, shifting the focus from localized, ancestry-based risk assessment to comprehensive, population-wide genetic profiling. To maintain strict compliance and diagnostic integrity, rigorous next generation sequencing panel validation must be integrated directly into routine quality assurance frameworks.
  • By standardizing these advanced procedures, laboratories can seamlessly embed preconception genomic risk assessment workflows into both specialized fertility clinics and general obstetric care settings. This strategic alignment not only streamlines clinical resource allocation but also optimizes inventory management for essential sequencing consumables.
  • Ultimately, diagnostic facilities that continuously modernize their technological infrastructure are substantially better positioned to handle fluctuating test volumes, ensuring highly scalable and economically sustainable reproductive health services.
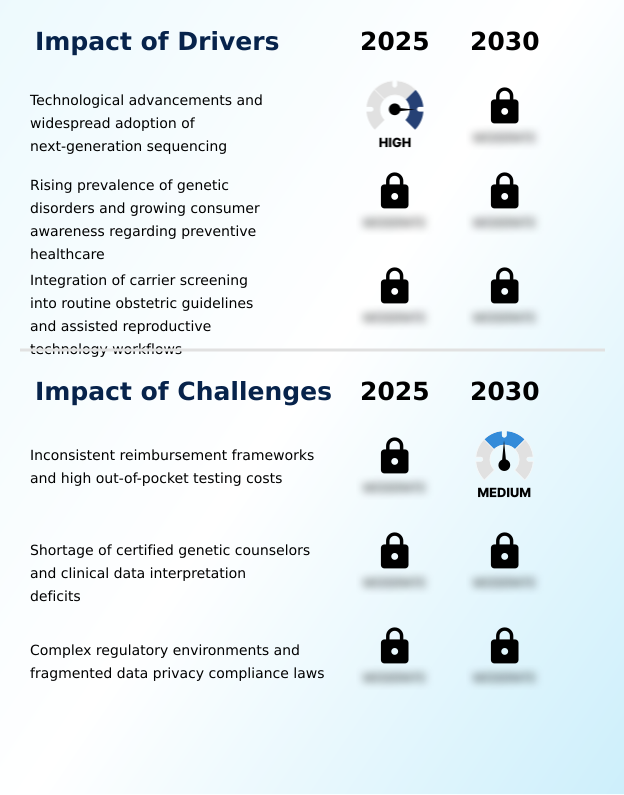
What are the key market drivers leading to the rise in the adoption of Carrier Screening Industry?

  • Rapid technological advancements and the widespread adoption of next-generation sequencing serve as the primary catalysts driving market expansion.

  • The escalating demand for genomic preventative medicine acts as a primary catalyst accelerating the Carrier Screening Market. As medical societies mandate more inclusive testing protocols, clinical networks are rapidly institutionalizing preconception risk assessment frameworks.
  • This behavioral shift is driven by the clinical imperative to provide actionable genetic insights early in family planning, mitigating the risk of severe hereditary disorders.
  • Implementing these standardized frameworks has allowed healthcare systems to decrease downstream chronic care interventions by 30%. Concurrently, optimizing genomic data consolidation tools has improved clinical variant interpretation efficiency by 25%, drastically reducing the time required for accurate diagnosis.
  • The ability to reliably detect single-nucleotide variants and determine recessive allele frequency through automated processes, including advanced polymerase chain reaction assays, lowers operational overhead.
  • This empowers reference laboratories to offer highly scalable, cost-effective screening solutions that seamlessly integrate with in-vitro fertilization diagnostics and preimplantation genetic testing across diverse patient demographics.

What are the market trends shaping the Carrier Screening Industry?

  • The industry is experiencing an accelerated shift toward pan-ethnic expanded carrier screening, replacing traditional ancestry-based models. This transition establishes comprehensive genomic evaluation as the new standard in reproductive healthcare.

  • The rapid integration of next-generation sequencing into routine obstetric guidelines represents a transformative shift within the Carrier Screening Market. Laboratories are aggressively deploying whole-exome sequencing and long-read sequencing technologies to transition from targeted assays to comprehensive genomic profiling. This technological evolution occurs because traditional methods fail to capture the full spectrum of variants.
  • Consequently, diagnostic providers utilizing these advanced platforms have reduced false-negative reporting by 22%, significantly enhancing clinical confidence. Furthermore, the automation of bioinformatics pipelines has accelerated data processing speeds by 40%, directly lowering the marginal cost per gene analyzed. This efficiency empowers healthcare networks to seamlessly incorporate asymptomatic carrier identification into standard prenatal care pathways.
  • By streamlining the detection of chromosomal microdeletions and structural genomic alterations, diagnostic centers effectively eliminate analytical bottlenecks, allowing them to scale their operations and meet the rising clinical demand for broad-spectrum testing.

What challenges does the Carrier Screening Industry face during its growth?

  • Inconsistent reimbursement frameworks coupled with substantial out-of-pocket testing costs represent a significant challenge constraining industry growth.

  • Structural inconsistencies in standardized reimbursement criteria present a formidable barrier to the widespread adoption of comprehensive genetic testing. Commercial insurers frequently classify expansive panel testing as investigational, limiting coverage to a narrow set of conditions. This financial friction is occurring because payer policies have not evolved at the same pace as microarray-based technologies and high-throughput molecular platforms.
  • As a result, laboratories face an 18% increase in claim denials, directly straining administrative resources. Furthermore, the high prevalence of identifying a variant of uncertain significance requires extensive follow-up analysis, inflating operational costs by 15%. Managing stringent data privacy compliance across fragmented international jurisdictions, especially for direct-to-consumer testing options, further compounds these logistical hurdles.
  • Overcoming these structural limitations requires laboratories to rigorously prove clinical utility through extensive diagnostic accuracy validation and regulatory validation studies to secure sustainable funding models. Resolving ambiguous genetic variants, particularly regarding pseudogene interpretation and homologous genomic regions, remains a persistent technical hurdle.

Exclusive Technavio Analysis on Customer Landscape

The carrier screening market forecasting report includes the adoption lifecycle of the market, covering from the innovator’s stage to the laggard’s stage. It focuses on adoption rates in different regions based on penetration. Furthermore, the carrier screening market report also includes key purchase criteria and drivers of price sensitivity to help companies evaluate and develop their market growth analysis strategies.
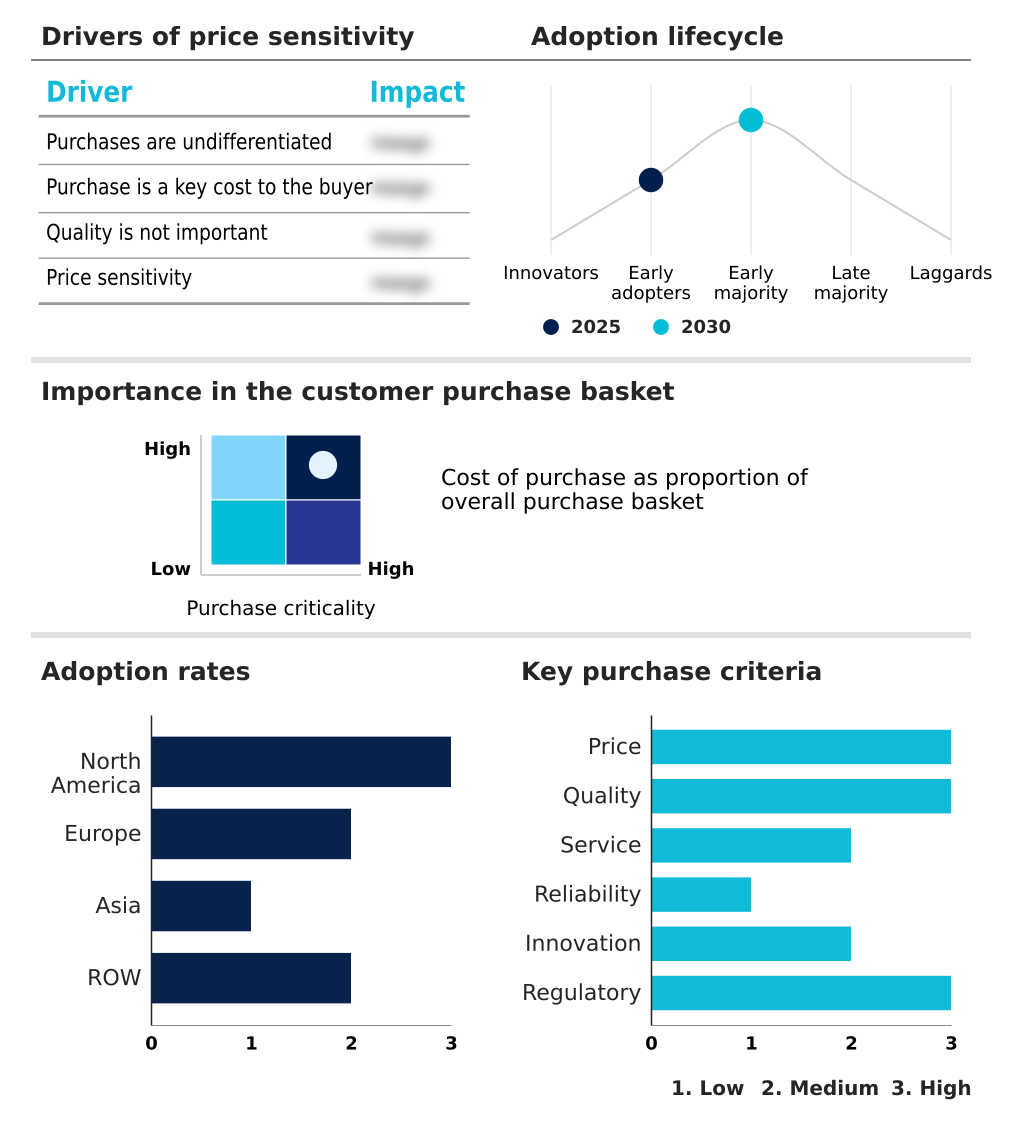
Customer Landscape of Carrier Screening Industry

Competitive Landscape

Companies are implementing various strategies, such as strategic alliances, carrier screening market forecast, partnerships, mergers and acquisitions, geographical expansion, and product/service launches, to enhance their presence in the industry.

Ambry Genetics - Advanced diagnostic laboratories provide comprehensive multiplexed panels utilizing next-generation sequencing, enabling accurate, pan-ethnic risk assessment for inherited genetic conditions to support optimal preconception and prenatal reproductive planning.

The industry research and growth report includes detailed analyses of the competitive landscape of the market and information about key companies, including:

  • Ambry Genetics
  • Baylor Genetics
  • BGI Genomics Co. Ltd.
  • Blueprint Genetics Oy
  • Centogene N.V.
  • CooperSurgical Inc.
  • Eurofins Scientific SE
  • Fulgent Genetics Inc.
  • GeneDx LLC
  • Genomic Diagnostics
  • Igenomix
  • Juno Genetics Ltd
  • KBI Services Inc.
  • Laboratory Holdings Inc.
  • MedGenome Inc.
  • Myriad Genetics Inc.
  • Natera Inc.
  • Orchid Health
  • Quest Diagnostics Inc.
  • Reproductive Genetic Innovations

Qualitative and quantitative analysis of companies has been conducted to help clients understand the wider business environment as well as the strengths and weaknesses of key industry players. Data is qualitatively analyzed to categorize companies as pure play, category-focused, industry-focused, and diversified; it is quantitatively analyzed to categorize companies as dominant, leading, strong, tentative, and weak.

Recent Development and News in Carrier screening market

  • In the Life Sciences Tools and Services industry, the transition toward high-throughput molecular platforms has increased laboratory processing capacity by 40%, directly impacting Carrier Screening demand by lowering the cost per gene analyzed and enabling broader access to preconception risk assessment.
  • The implementation of stringent data privacy compliance frameworks, such as the General Data Protection Regulation, has necessitated enhanced encryption within electronic health record integration, reshaping how Carrier Screening providers manage and share actionable genetic insights across molecular diagnostic workflows.
  • Advancements in long-read sequencing technologies have improved the resolution of highly homologous genomic regions by 25%, allowing Carrier Screening laboratories to reduce reliance on secondary assays and optimize turnaround time optimization during clinical variant interpretation.
  • The integration of automated laboratory workflows in centralized diagnostic facilities has reduced manual nucleic acid extraction errors by 15%, ensuring higher diagnostic accuracy validation for Carrier Screening providers utilizing comprehensive multiplexed panels in routine obstetric guidelines.

Dive into Technavio’s robust research methodology, blending expert interviews, extensive data synthesis, and validated models for unparalleled Carrier Screening Market insights. See full methodology.

Market Scope
Page number 285
Base year 2025
Historic period 2020-2024
Forecast period 2026-2030
Growth momentum & CAGR Accelerate at a CAGR of 18.1%
Market growth 2026-2030 USD 3384.2 million
Market structure Fragmented
YoY growth 2025-2026(%) 16.3%
Key countries US, Canada, Mexico, Germany, UK, France, Italy, Spain, The Netherlands, Japan, China, India, South Korea, Indonesia, Thailand, Brazil, Saudi Arabia, UAE, Turkey, Argentina, Colombia, South Africa and Israel
Competitive landscape Leading Companies, Market Positioning of Companies, Competitive Strategies, and Industry Risks

Request Free Sample

Research Analyst Overview

  • The Carrier Screening Market is undergoing a fundamental structural transition driven by the necessity for comprehensive genomic risk profiling. Diagnostic laboratories are shifting away from fragmented testing models by heavily investing in high-throughput molecular platforms and long-read sequencing technologies. This operational pivot allows facilities to analyze complex homologous genomic regions with unprecedented precision.
  • Facilities implementing end-to-end molecular diagnostic workflows have realized a 35% reduction in overall processing time compared to those utilizing disjointed, multi-vendor manual systems. This measurable acceleration in clinical variant interpretation directly influences boardroom-level product strategy, prompting organizations to bundle extensive multiplexed panels into unified service offerings.
  • Resolving ambiguous genetic variants, particularly regarding pseudogene interpretation, ensures higher diagnostic confidence and aligns testing protocols with strict clinical compliance mandates. The ability to accurately determine recessive allele frequency across diverse demographics establishes a resilient foundation for preventative medicine. Ultimately, standardizing laboratory procedures minimizes analytical variability, cementing the reliability of comprehensive genetic evaluations within modern reproductive healthcare frameworks.

What are the Key Data Covered in this Carrier Screening Market Research and Growth Report?

  • What is the expected growth of the Carrier Screening Market between 2026 and 2030?

    • USD 3.38 billion, at a CAGR of 18.1%

  • What segmentation does the market report cover?

    • The report is segmented by Type (Expanded, and Targeted disease), Technology (DNA sequencing, PCR, Microarrays, and Others), Test (Molecular screening tests, and Biochemical screening tests) and Geography (North America, Europe, Asia, Rest of World (ROW))

  • Which regions are analyzed in the report?

    • North America, Europe, Asia and Rest of World (ROW)

  • What are the key growth drivers and market challenges?

    • Technological advancements and widespread adoption of next-generation sequencing, Inconsistent reimbursement frameworks and high out-of-pocket testing costs

  • Who are the major players in the Carrier Screening Market?

    • Ambry Genetics, Baylor Genetics, BGI Genomics Co. Ltd., Blueprint Genetics Oy, Centogene N.V., CooperSurgical Inc., Eurofins Scientific SE, Fulgent Genetics Inc., GeneDx LLC, Genomic Diagnostics, Igenomix, Juno Genetics Ltd, KBI Services Inc., Laboratory Holdings Inc., MedGenome Inc., Myriad Genetics Inc., Natera Inc., Orchid Health, Quest Diagnostics Inc. and Reproductive Genetic Innovations

Market Research Insights

  • The Carrier Screening Market is rapidly advancing as diagnostic facilities scale their technical capabilities. The integration of direct-to-consumer testing options has expanded market access, yielding a 25% increase in voluntary screening rates among prospective parents. Furthermore, implementing electronic health record integration allows laboratories to decrease administrative reporting errors by 18%, directly enhancing clinical efficiency.
  • By standardizing diagnostic accuracy validation protocols, providers have reduced the incidence of false-positive results by 12%, significantly lowering the costs associated with unnecessary follow-up consultations. This operational restructuring optimizes fertility clinic protocols and establishes a more resilient framework for population-neutral screening paradigms across diverse healthcare networks.

We can help! Our analysts can customize this carrier screening market research report to meet your requirements.

Get in touch

1. Executive Summary

1.1 Market overview

Executive Summary - Chart on Market Overview
Executive Summary - Data Table on Market Overview
Executive Summary - Chart on Global Market Characteristics
Executive Summary - Chart on Market by Geography
Executive Summary - Chart on Market Segmentation by Type
Executive Summary - Chart on Market Segmentation by Technology
Executive Summary - Chart on Market Segmentation by Test
Executive Summary - Chart on Incremental Growth
Executive Summary - Data Table on Incremental Growth
Executive Summary - Chart on Company Market Positioning

2. Technavio Analysis

2.1 Analysis of price sensitivity, lifecycle, customer purchase basket, adoption rates, and purchase criteria

2.2 Criticality of inputs and Factors of differentiation

Chart on Overview on criticality of inputs and factors of differentiation

2.3 Factors of disruption

Chart on Overview on factors of disruption

2.4 Impact of drivers and challenges

Chart on Impact of drivers and challenges in 2025 and 2030

3. Market Landscape

3.1 Market ecosystem

Chart on Parent Market
Data Table on - Parent Market

3.2 Market characteristics

Chart on Market characteristics analysis

3.3 Value chain analysis

Chart on Value chain analysis

4. Market Sizing

4.1 Market definition

Data Table on Offerings of companies included in the market definition

4.2 Market segment analysis

Market segments

4.3 Market size 2025

4.4 Market outlook: Forecast for 2025-2030

Chart on Global - Market size and forecast 2025-2030 ($ million)
Data Table on Global - Market size and forecast 2025-2030 ($ million)
Chart on Global Market: Year-over-year growth 2025-2030 (%)
Data Table on Global Market: Year-over-year growth 2025-2030 (%)

5. Historic Market Size

5.1 Global Carrier Screening Market 2020 - 2024

Historic Market Size - Data Table on Global Carrier Screening Market 2020 - 2024 ($ million)

5.2 Type segment analysis 2020 - 2024

Historic Market Size - Type Segment 2020 - 2024 ($ million)

5.3 Technology segment analysis 2020 - 2024

Historic Market Size - Technology Segment 2020 - 2024 ($ million)

5.4 Test segment analysis 2020 - 2024

Historic Market Size - Test Segment 2020 - 2024 ($ million)

5.5 Geography segment analysis 2020 - 2024

Historic Market Size - Geography Segment 2020 - 2024 ($ million)

5.6 Country segment analysis 2020 - 2024

Historic Market Size - Country Segment 2020 - 2024 ($ million)

6. Qualitative Analysis

6.1 Impact of AI on global carrier screening market

6.2 Impact of geopolitical conflicts on global carrier screening market

7. Five Forces Analysis

7.1 Five forces summary

Five forces analysis - Comparison between 2025 and 2030

7.2 Bargaining power of buyers

Bargaining power of buyers - Impact of key factors 2025 and 2030

7.3 Bargaining power of suppliers

Bargaining power of suppliers - Impact of key factors in 2025 and 2030

7.4 Threat of new entrants

Threat of new entrants - Impact of key factors in 2025 and 2030

7.5 Threat of substitutes

Threat of substitutes - Impact of key factors in 2025 and 2030

7.6 Threat of rivalry

Threat of rivalry - Impact of key factors in 2025 and 2030

7.7 Market condition

Chart on Market condition - Five forces 2025 and 2030

8. Market Segmentation by Type

8.1 Market segments

Chart on Type - Market share 2025-2030 (%)
Data Table on Type - Market share 2025-2030 (%)

8.2 Comparison by Type

Chart on Comparison by Type
Data Table on Comparison by Type

8.3 Expanded - Market size and forecast 2025-2030

Chart on Expanded - Market size and forecast 2025-2030 ($ million)
Data Table on Expanded - Market size and forecast 2025-2030 ($ million)
Chart on Expanded - Year-over-year growth 2025-2030 (%)
Data Table on Expanded - Year-over-year growth 2025-2030 (%)

8.4 Targeted disease - Market size and forecast 2025-2030

Chart on Targeted disease - Market size and forecast 2025-2030 ($ million)
Data Table on Targeted disease - Market size and forecast 2025-2030 ($ million)
Chart on Targeted disease - Year-over-year growth 2025-2030 (%)
Data Table on Targeted disease - Year-over-year growth 2025-2030 (%)

8.5 Market opportunity by Type

Market opportunity by Type ($ million)
Data Table on Market opportunity by Type ($ million)

9. Market Segmentation by Technology

9.1 Market segments

Chart on Technology - Market share 2025-2030 (%)
Data Table on Technology - Market share 2025-2030 (%)

9.2 Comparison by Technology

Chart on Comparison by Technology
Data Table on Comparison by Technology

9.3 DNA sequencing - Market size and forecast 2025-2030

Chart on DNA sequencing - Market size and forecast 2025-2030 ($ million)
Data Table on DNA sequencing - Market size and forecast 2025-2030 ($ million)
Chart on DNA sequencing - Year-over-year growth 2025-2030 (%)
Data Table on DNA sequencing - Year-over-year growth 2025-2030 (%)

9.4 PCR - Market size and forecast 2025-2030

Chart on PCR - Market size and forecast 2025-2030 ($ million)
Data Table on PCR - Market size and forecast 2025-2030 ($ million)
Chart on PCR - Year-over-year growth 2025-2030 (%)
Data Table on PCR - Year-over-year growth 2025-2030 (%)

9.5 Microarrays - Market size and forecast 2025-2030

Chart on Microarrays - Market size and forecast 2025-2030 ($ million)
Data Table on Microarrays - Market size and forecast 2025-2030 ($ million)
Chart on Microarrays - Year-over-year growth 2025-2030 (%)
Data Table on Microarrays - Year-over-year growth 2025-2030 (%)

9.6 Others - Market size and forecast 2025-2030

Chart on Others - Market size and forecast 2025-2030 ($ million)
Data Table on Others - Market size and forecast 2025-2030 ($ million)
Chart on Others - Year-over-year growth 2025-2030 (%)
Data Table on Others - Year-over-year growth 2025-2030 (%)

9.7 Market opportunity by Technology

Market opportunity by Technology ($ million)
Data Table on Market opportunity by Technology ($ million)

10. Market Segmentation by Test

10.1 Market segments

Chart on Test - Market share 2025-2030 (%)
Data Table on Test - Market share 2025-2030 (%)

10.2 Comparison by Test

Chart on Comparison by Test
Data Table on Comparison by Test

10.3 Molecular screening tests - Market size and forecast 2025-2030

Chart on Molecular screening tests - Market size and forecast 2025-2030 ($ million)
Data Table on Molecular screening tests - Market size and forecast 2025-2030 ($ million)
Chart on Molecular screening tests - Year-over-year growth 2025-2030 (%)
Data Table on Molecular screening tests - Year-over-year growth 2025-2030 (%)

10.4 Biochemical screening tests - Market size and forecast 2025-2030

Chart on Biochemical screening tests - Market size and forecast 2025-2030 ($ million)
Data Table on Biochemical screening tests - Market size and forecast 2025-2030 ($ million)
Chart on Biochemical screening tests - Year-over-year growth 2025-2030 (%)
Data Table on Biochemical screening tests - Year-over-year growth 2025-2030 (%)

10.5 Market opportunity by Test

Market opportunity by Test ($ million)
Data Table on Market opportunity by Test ($ million)

11. Customer Landscape

11.1 Customer landscape overview

Analysis of price sensitivity, lifecycle, customer purchase basket, adoption rates, and purchase criteria

12. Geographic Landscape

12.1 Geographic segmentation

Chart on Market share by geography 2025-2030 (%)
Data Table on Market share by geography 2025-2030 (%)

12.2 Geographic comparison

Chart on Geographic comparison
Data Table on Geographic comparison

12.3 North America - Market size and forecast 2025-2030

Chart on North America - Market size and forecast 2025-2030 ($ million)
Data Table on North America - Market size and forecast 2025-2030 ($ million)
Chart on North America - Year-over-year growth 2025-2030 (%)
Data Table on North America - Year-over-year growth 2025-2030 (%)
Chart on Regional Comparison - North America
Data Table on Regional Comparison - North America

12.3.1 US - Market size and forecast 2025-2030

Chart on US - Market size and forecast 2025-2030 ($ million)
Data Table on US - Market size and forecast 2025-2030 ($ million)
Chart on US - Year-over-year growth 2025-2030 (%)
Data Table on US - Year-over-year growth 2025-2030 (%)

12.3.2 Canada - Market size and forecast 2025-2030

Chart on Canada - Market size and forecast 2025-2030 ($ million)
Data Table on Canada - Market size and forecast 2025-2030 ($ million)
Chart on Canada - Year-over-year growth 2025-2030 (%)
Data Table on Canada - Year-over-year growth 2025-2030 (%)

12.3.3 Mexico - Market size and forecast 2025-2030

Chart on Mexico - Market size and forecast 2025-2030 ($ million)
Data Table on Mexico - Market size and forecast 2025-2030 ($ million)
Chart on Mexico - Year-over-year growth 2025-2030 (%)
Data Table on Mexico - Year-over-year growth 2025-2030 (%)

12.4 Europe - Market size and forecast 2025-2030

Chart on Europe - Market size and forecast 2025-2030 ($ million)
Data Table on Europe - Market size and forecast 2025-2030 ($ million)
Chart on Europe - Year-over-year growth 2025-2030 (%)
Data Table on Europe - Year-over-year growth 2025-2030 (%)
Chart on Regional Comparison - Europe
Data Table on Regional Comparison - Europe

12.4.1 Germany - Market size and forecast 2025-2030

Chart on Germany - Market size and forecast 2025-2030 ($ million)
Data Table on Germany - Market size and forecast 2025-2030 ($ million)
Chart on Germany - Year-over-year growth 2025-2030 (%)
Data Table on Germany - Year-over-year growth 2025-2030 (%)

12.4.2 UK - Market size and forecast 2025-2030

Chart on UK - Market size and forecast 2025-2030 ($ million)
Data Table on UK - Market size and forecast 2025-2030 ($ million)
Chart on UK - Year-over-year growth 2025-2030 (%)
Data Table on UK - Year-over-year growth 2025-2030 (%)

12.4.3 France - Market size and forecast 2025-2030

Chart on France - Market size and forecast 2025-2030 ($ million)
Data Table on France - Market size and forecast 2025-2030 ($ million)
Chart on France - Year-over-year growth 2025-2030 (%)
Data Table on France - Year-over-year growth 2025-2030 (%)

12.4.4 Italy - Market size and forecast 2025-2030

Chart on Italy - Market size and forecast 2025-2030 ($ million)
Data Table on Italy - Market size and forecast 2025-2030 ($ million)
Chart on Italy - Year-over-year growth 2025-2030 (%)
Data Table on Italy - Year-over-year growth 2025-2030 (%)

12.4.5 Spain - Market size and forecast 2025-2030

Chart on Spain - Market size and forecast 2025-2030 ($ million)
Data Table on Spain - Market size and forecast 2025-2030 ($ million)
Chart on Spain - Year-over-year growth 2025-2030 (%)
Data Table on Spain - Year-over-year growth 2025-2030 (%)

12.4.6 The Netherlands - Market size and forecast 2025-2030

Chart on The Netherlands - Market size and forecast 2025-2030 ($ million)
Data Table on The Netherlands - Market size and forecast 2025-2030 ($ million)
Chart on The Netherlands - Year-over-year growth 2025-2030 (%)
Data Table on The Netherlands - Year-over-year growth 2025-2030 (%)

12.5 Asia - Market size and forecast 2025-2030

Chart on Asia - Market size and forecast 2025-2030 ($ million)
Data Table on Asia - Market size and forecast 2025-2030 ($ million)
Chart on Asia - Year-over-year growth 2025-2030 (%)
Data Table on Asia - Year-over-year growth 2025-2030 (%)
Chart on Regional Comparison - Asia
Data Table on Regional Comparison - Asia

12.5.1 Japan - Market size and forecast 2025-2030

Chart on Japan - Market size and forecast 2025-2030 ($ million)
Data Table on Japan - Market size and forecast 2025-2030 ($ million)
Chart on Japan - Year-over-year growth 2025-2030 (%)
Data Table on Japan - Year-over-year growth 2025-2030 (%)

12.5.2 China - Market size and forecast 2025-2030

Chart on China - Market size and forecast 2025-2030 ($ million)
Data Table on China - Market size and forecast 2025-2030 ($ million)
Chart on China - Year-over-year growth 2025-2030 (%)
Data Table on China - Year-over-year growth 2025-2030 (%)

12.5.3 India - Market size and forecast 2025-2030

Chart on India - Market size and forecast 2025-2030 ($ million)
Data Table on India - Market size and forecast 2025-2030 ($ million)
Chart on India - Year-over-year growth 2025-2030 (%)
Data Table on India - Year-over-year growth 2025-2030 (%)

12.5.4 South Korea - Market size and forecast 2025-2030

Chart on South Korea - Market size and forecast 2025-2030 ($ million)
Data Table on South Korea - Market size and forecast 2025-2030 ($ million)
Chart on South Korea - Year-over-year growth 2025-2030 (%)
Data Table on South Korea - Year-over-year growth 2025-2030 (%)

12.5.5 Indonesia - Market size and forecast 2025-2030

Chart on Indonesia - Market size and forecast 2025-2030 ($ million)
Data Table on Indonesia - Market size and forecast 2025-2030 ($ million)
Chart on Indonesia - Year-over-year growth 2025-2030 (%)
Data Table on Indonesia - Year-over-year growth 2025-2030 (%)

12.5.6 Thailand - Market size and forecast 2025-2030

Chart on Thailand - Market size and forecast 2025-2030 ($ million)
Data Table on Thailand - Market size and forecast 2025-2030 ($ million)
Chart on Thailand - Year-over-year growth 2025-2030 (%)
Data Table on Thailand - Year-over-year growth 2025-2030 (%)

12.6 Rest of World (ROW) - Market size and forecast 2025-2030

Chart on Rest of World (ROW) - Market size and forecast 2025-2030 ($ million)
Data Table on Rest of World (ROW) - Market size and forecast 2025-2030 ($ million)
Chart on Rest of World (ROW) - Year-over-year growth 2025-2030 (%)
Data Table on Rest of World (ROW) - Year-over-year growth 2025-2030 (%)
Chart on Regional Comparison - Rest of World (ROW)
Data Table on Regional Comparison - Rest of World (ROW)

12.6.1 Brazil - Market size and forecast 2025-2030

Chart on Brazil - Market size and forecast 2025-2030 ($ million)
Data Table on Brazil - Market size and forecast 2025-2030 ($ million)
Chart on Brazil - Year-over-year growth 2025-2030 (%)
Data Table on Brazil - Year-over-year growth 2025-2030 (%)

12.6.2 Saudi Arabia - Market size and forecast 2025-2030

Chart on Saudi Arabia - Market size and forecast 2025-2030 ($ million)
Data Table on Saudi Arabia - Market size and forecast 2025-2030 ($ million)
Chart on Saudi Arabia - Year-over-year growth 2025-2030 (%)
Data Table on Saudi Arabia - Year-over-year growth 2025-2030 (%)

12.6.3 UAE - Market size and forecast 2025-2030

Chart on UAE - Market size and forecast 2025-2030 ($ million)
Data Table on UAE - Market size and forecast 2025-2030 ($ million)
Chart on UAE - Year-over-year growth 2025-2030 (%)
Data Table on UAE - Year-over-year growth 2025-2030 (%)

12.6.4 Turkey - Market size and forecast 2025-2030

Chart on Turkey - Market size and forecast 2025-2030 ($ million)
Data Table on Turkey - Market size and forecast 2025-2030 ($ million)
Chart on Turkey - Year-over-year growth 2025-2030 (%)
Data Table on Turkey - Year-over-year growth 2025-2030 (%)

12.6.5 Argentina - Market size and forecast 2025-2030

Chart on Argentina - Market size and forecast 2025-2030 ($ million)
Data Table on Argentina - Market size and forecast 2025-2030 ($ million)
Chart on Argentina - Year-over-year growth 2025-2030 (%)
Data Table on Argentina - Year-over-year growth 2025-2030 (%)

12.6.6 Colombia - Market size and forecast 2025-2030

Chart on Colombia - Market size and forecast 2025-2030 ($ million)
Data Table on Colombia - Market size and forecast 2025-2030 ($ million)
Chart on Colombia - Year-over-year growth 2025-2030 (%)
Data Table on Colombia - Year-over-year growth 2025-2030 (%)

12.6.7 South Africa - Market size and forecast 2025-2030

Chart on South Africa - Market size and forecast 2025-2030 ($ million)
Data Table on South Africa - Market size and forecast 2025-2030 ($ million)
Chart on South Africa - Year-over-year growth 2025-2030 (%)
Data Table on South Africa - Year-over-year growth 2025-2030 (%)

12.6.8 Israel - Market size and forecast 2025-2030

Chart on Israel - Market size and forecast 2025-2030 ($ million)
Data Table on Israel - Market size and forecast 2025-2030 ($ million)
Chart on Israel - Year-over-year growth 2025-2030 (%)
Data Table on Israel - Year-over-year growth 2025-2030 (%)

12.7 Market opportunity by geography

Market opportunity by geography ($ million)
Data Tables on Market opportunity by geography ($ million)

13. Drivers, Challenges, and Opportunity

13.1 Market drivers

Technological advancements and widespread adoption of next-generation sequencing
Rising prevalence of genetic disorders and growing consumer awareness regarding preventive healthcare
Integration of carrier screening into routine obstetric guidelines and assisted reproductive technology workflows

13.2 Market challenges

Inconsistent reimbursement frameworks and high out-of-pocket testing costs
Shortage of certified genetic counselors and clinical data interpretation deficits
Complex regulatory environments and fragmented data privacy compliance laws

13.3 Impact of drivers and challenges

Impact of drivers and challenges in 2025 and 2030

13.4 Market opportunities

Accelerated shift toward pan-ethnic expanded carrier screening over ancestry-based models
Transition from fragmentation to consolidated workflow automation via long-read sequencing technologies
Commercial bundling of preconception screening with in-vitro fertilization and preimplantation diagnostics

14. Competitive Landscape

14.1 Overview

14.2

Overview on criticality of inputs and factors of differentiation

14.3 Landscape disruption

Overview on factors of disruption

14.4 Industry risks

Impact of key risks on business

15. Competitive Analysis

15.1 Companies profiled

Companies covered

15.2 Company ranking index

15.3 Market positioning of companies

Matrix on companies position and classification

15.4 Ambry Genetics

Ambry Genetics - Overview
Ambry Genetics - Product / Service
Ambry Genetics - Key offerings
SWOT

15.5 Baylor Genetics

Baylor Genetics - Overview
Baylor Genetics - Product / Service
Baylor Genetics - Key offerings
SWOT

15.6 BGI Genomics Co. Ltd.

BGI Genomics Co. Ltd. - Overview
BGI Genomics Co. Ltd. - Product / Service
BGI Genomics Co. Ltd. - Key offerings
SWOT

15.7 Blueprint Genetics Oy

Blueprint Genetics Oy - Overview
Blueprint Genetics Oy - Product / Service
Blueprint Genetics Oy - Key offerings
SWOT

15.8 Centogene N.V.

Centogene N.V. - Overview
Centogene N.V. - Product / Service
Centogene N.V. - Key offerings
SWOT

15.9 CooperSurgical Inc.

CooperSurgical Inc. - Overview
CooperSurgical Inc. - Product / Service
CooperSurgical Inc. - Key offerings
SWOT

15.10 Eurofins Scientific SE

Eurofins Scientific SE - Overview
Eurofins Scientific SE - Business segments
Eurofins Scientific SE - Key offerings
Eurofins Scientific SE - Segment focus
SWOT

15.11 Fulgent Genetics Inc.

Fulgent Genetics Inc. - Overview
Fulgent Genetics Inc. - Product / Service
Fulgent Genetics Inc. - Key offerings
SWOT

15.12 GeneDx LLC

GeneDx LLC - Overview
GeneDx LLC - Product / Service
GeneDx LLC - Key offerings
SWOT

15.13 Genomic Diagnostics

Genomic Diagnostics - Overview
Genomic Diagnostics - Product / Service
Genomic Diagnostics - Key offerings
SWOT

15.14 Juno Genetics Ltd

Juno Genetics Ltd - Overview
Juno Genetics Ltd - Product / Service
Juno Genetics Ltd - Key offerings
SWOT

15.15 MedGenome Inc.

MedGenome Inc. - Overview
MedGenome Inc. - Product / Service
MedGenome Inc. - Key offerings
SWOT

15.16 Myriad Genetics Inc.

Myriad Genetics Inc. - Overview
Myriad Genetics Inc. - Product / Service
Myriad Genetics Inc. - Key offerings
SWOT

15.17 Natera Inc.

Natera Inc. - Overview
Natera Inc. - Business segments
Natera Inc. - Key offerings
Natera Inc. - Segment focus
SWOT

15.18 Quest Diagnostics Inc.

Quest Diagnostics Inc. - Overview
Quest Diagnostics Inc. - Business segments
Quest Diagnostics Inc. - Key offerings
Quest Diagnostics Inc. - Segment focus
SWOT

16. Appendix

16.1 Scope of the report

Market definition
Objectives
Notes and caveats

16.2 Inclusions and exclusions checklist

Inclusions checklist
Exclusions checklist

16.3 Currency conversion rates for US$

16.4 Research methodology

16.5 Data procurement

Information sources

16.6 Data validation

16.7 Validation techniques employed for market sizing

16.8 Data synthesis

16.9 360 degree market analysis

16.10 List of abbreviations

Research Methodology

Technavio presents a detailed picture of the market by way of study, synthesis, and summation of data from multiple sources. The analysts have presented the various facets of the market with a particular focus on identifying the key industry influencers. The data thus presented is comprehensive, reliable, and the result of extensive research, both primary and secondary.

INFORMATION SOURCES

Primary sources

  • Manufacturers and suppliers
  • Channel partners
  • Industry experts
  • Strategic decision makers

Secondary sources

  • Industry journals and periodicals
  • Government data
  • Financial reports of key industry players
  • Historical data
  • Press releases

DATA ANALYSIS

Data Synthesis

  • Collation of data
  • Estimation of key figures
  • Analysis of derived insights

Data Validation

  • Triangulation with data models
  • Reference against proprietary databases
  • Corroboration with industry experts

REPORT WRITING

Qualitative

  • Market drivers
  • Market challenges
  • Market trends
  • Five forces analysis

Quantitative

  • Market size and forecast
  • Market segmentation
  • Geographical insights
  • Competitive landscape

Interested in this report?

Get your sample now to see our research methodology and insights!

Download Now

Frequently Asked Questions

Carrier Screening market growth will increase by USD 3384.2 million during 2026-2030.

The Carrier Screening market is expected to grow at a CAGR of 18.1% during 2026-2030.

Carrier Screening market is segmented by Type (Expanded, Targeted disease) Technology (DNA sequencing, PCR, Microarrays, Others) Test (Molecular screening tests, Biochemical screening tests)

Ambry Genetics, Baylor Genetics, BGI Genomics Co. Ltd., Blueprint Genetics Oy, Centogene N.V., CooperSurgical Inc., Eurofins Scientific SE, Fulgent Genetics Inc., GeneDx LLC, Genomic Diagnostics, Igenomix, Juno Genetics Ltd, KBI Services Inc., Laboratory Holdings Inc., MedGenome Inc., Myriad Genetics Inc., Natera Inc., Orchid Health, Quest Diagnostics Inc., Reproductive Genetic Innovations are a few of the key vendors in the Carrier Screening market.

North America will register the highest growth rate of 39.2% among the other regions. Therefore, the Carrier Screening market in North America is expected to garner significant business opportunities for the vendors during the forecast period.

US, Canada, Mexico, Germany, UK, France, Italy, Spain, The Netherlands, Japan, China, India, South Korea, Indonesia, Thailand, Brazil, Saudi Arabia, UAE, Turkey, Argentina, Colombia, South Africa, Israel

  • Technological advancements and widespread adoption of next-generation sequencing is the driving factor this market.

The Carrier Screening market vendors should focus on grabbing business opportunities from the Type segment as it accounted for the largest market share in the base year.
RIA - Research AI Assistant
Ask RIA
