Next Generation Sequencing Market Analysis North America, Europe, Asia, Rest of World (ROW) - US, Germany, Canada, China, UK - Size and Forecast 2024-2028

Next Generation Sequencing Market Analysis North America, Europe, Asia, Rest of World (ROW) - US, Germany, Canada, China, UK - Size and Forecast 2024-2028

Published: Jul 2024 181 Pages SKU: IRTNTR71618

Market Overview at a Glance

$4.61 B
Market Opportunity
14.49%
CAGR
12.35
YoY growth 2023-2024(%)

Next Generation Sequencing Market Size 2024-2028

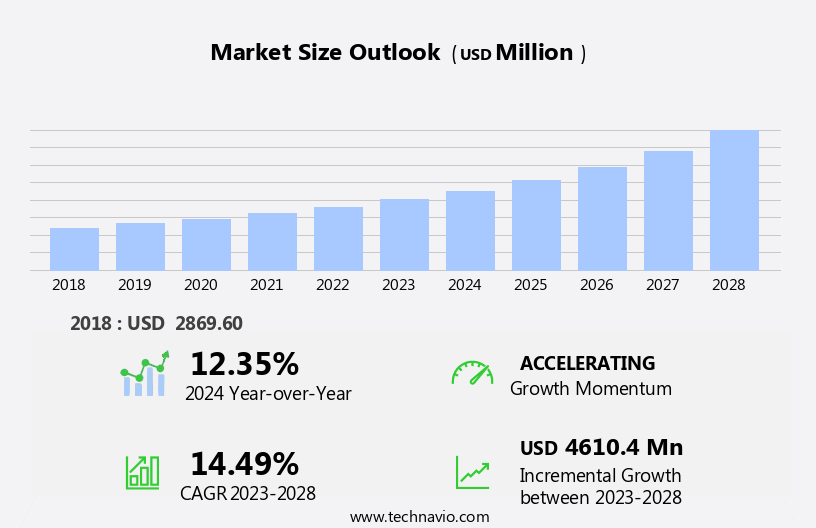
The next generation sequencing market size is forecast to increase by USD 4.61 billion, at a CAGR of 14.49% between 2023 and 2028.

  • The Next Generation Sequencing (NGS) market is experiencing significant growth, driven by the increasing utilization of NGS methods in various applications, including diagnostics, research, and personalized medicine. Advancements in NGS techniques have led to faster and more cost-effective sequencing, enabling broader access to genetic information and fueling innovation in fields such as agriculture, environmental research, and forensics. However, the market faces challenges, primarily in the area of clinical validation for direct-to-consumer genetic tests. As the availability of genetic information expands, ensuring the accuracy and reliability of test results becomes increasingly important.
  • Addressing these concerns through rigorous clinical validation processes and regulatory compliance will be crucial for market participants to build trust and credibility with consumers and healthcare providers. Companies that effectively navigate these challenges and continue to innovate in NGS technology and applications will be well-positioned to capitalize on the market's growth potential.

What will be the Size of the Next Generation Sequencing Market during the forecast period?

Next Generation Sequencing Market Size

Explore in-depth regional segment analysis with market size data - historical 2018-2022 and forecasts 2024-2028 - in the full report.  
Request Free Sample

The next generation sequencing (NGS) market continues to evolve, driven by advancements in sequencing platforms and data analysis techniques. Seamlessly integrated solutions are transforming the landscape, connecting entities such as sequence databases, RNA sequencing, targeted sequencing, and NGS applications. Copy number variation and reference genomes are critical components of genome assembly, ensuring quality control and accuracy. Methylation analysis, sequencing platforms, and data analysis are intricately linked, enabling the identification of epigenetic modifications and enhancing genomic understanding. Reproductive genomics, exome sequencing, data visualization, gene expression analysis, forensic genomics, infectious disease genomics, and variant calling are integral parts of the NGS ecosystem.

Sequence alignment, PACBI sequencing, DNA extraction, Ion Torrent sequencing, base calling, and single-cell sequencing are additional techniques expanding the scope of NGS applications. Agricultural genomics, clinical interpretation, library preparation, Illumina sequencing, whole genome sequencing, variant annotation, cancer genomics, mutation detection, read mapping, and microbial sequencing are all areas benefiting from NGS technology. Structural variation and nanopore sequencing are emerging technologies pushing the boundaries of genomic research. The NGS market's continuous dynamism reflects the ongoing unfolding of market activities and evolving patterns, with each entity playing a crucial role in the broader genomic research landscape.

How is this Next Generation Sequencing Industry segmented?

The next generation sequencing industry research report provides comprehensive data (region-wise segment analysis), with forecasts and estimates in "USD million" for the period 2024-2028, as well as historical data from 2018-2022 for the following segments.

  • End-user
    • Academic research
    • Clinical research
    • Pharmaceutical and biotechnology companies
    • Others
  • Product
    • Consumables
    • Equipment
  • Geography
    • North America
      • US
      • Canada
    • Europe
      • Germany
      • UK
    • APAC
      • China
    • Rest of World (ROW)

    By End-user Insights

    The academic research segment is estimated to witness significant growth during the forecast period.

    The next generation sequencing (NGS) market encompasses various applications and technologies, including RNA sequencing, targeted sequencing, and genome assembly. Academic research institutions, such as universities and research organizations, represent a significant market segment. Researchers in this sector employ NGS for diverse purposes, including drug discovery, personalized medicine, and clinical diagnostics. NGS enables the rapid sequencing of vast genetic data volumes, facilitating the analysis of genetic variations and elucidating disease mechanisms. Key factors fueling the adoption of NGS in academic research include decreasing sequencing costs, user-friendly software, and the growing demand for personalized and precision medicine. NGS applications extend to reproductive genomics, exome sequencing, and gene expression analysis.

    Data visualization tools and clinical interpretation services aid researchers in making sense of the massive data generated. NGS platforms, such as PacBio sequencing, Ion Torrent sequencing, and Illumina sequencing, cater to different sequencing needs. Library preparation, DNA extraction, and base calling are essential processes in NGS workflows. Methylation analysis, copy number variation, and structural variation detection are crucial NGS applications in fields like forensic genomics, cancer genomics, and infectious disease genomics. Variant calling, sequence alignment, and mutation detection are integral to identifying genetic variations. Microbial sequencing and read mapping are essential for microbiome research. Nanopore sequencing offers long-read sequencing capabilities, enhancing genome assembly and variant analysis.

    NGS technologies are revolutionizing various industries, including agriculture, where they aid in crop improvement and breeding programs. In summary, the market is dynamic and evolving, driven by technological advancements, decreasing costs, and the growing demand for personalized and precision medicine.

    Next Generation Sequencing Market Size

    Request Free Sample

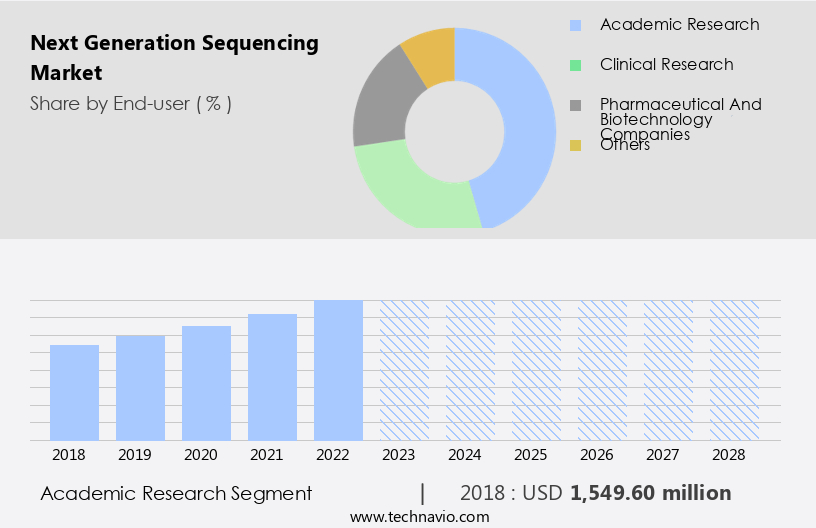
    The Academic research segment was valued at USD 1.55 billion in 2018 and showed a gradual increase during the forecast period.
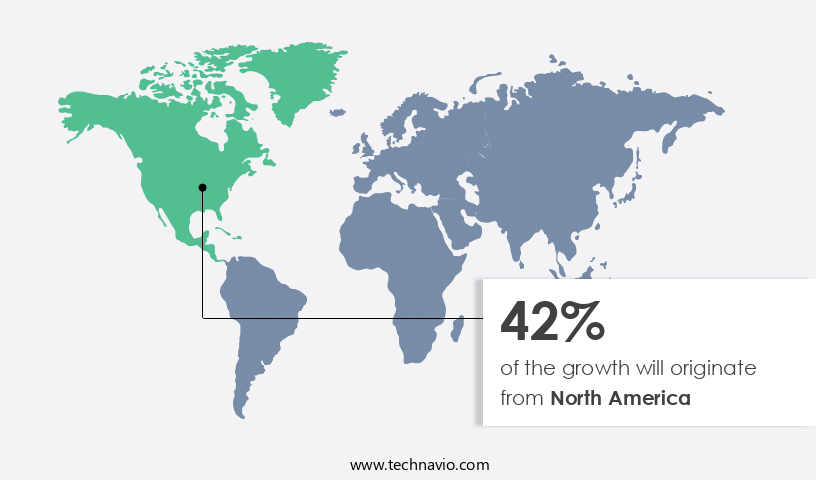
    Regional Analysis

    North America is estimated to contribute 42% to the growth of the global market during the forecast period.Technavio’s analysts have elaborately explained the regional trends and drivers that shape the market during the forecast period.

    Next Generation Sequencing Market Share by Geography

     Request Free Sample

    The Next Generation Sequencing (NGS) market in North America is experiencing significant growth due to the decreasing cost of genome sequencing, enabling earlier diagnosis of diseases such as cancer. Major players like Illumina, Thermo Fisher Scientific, and PerkinElmer, along with the emphasis on genome mapping programs, are driving market expansion in the region. However, growth is anticipated to be slower than the global market during the forecast period. In the United States, the adoption of advanced DNA sequencing technology is escalating, fueled by a focus on gene therapy and personalized medicine initiatives. NGS applications, including RNA sequencing, targeted sequencing, and whole genome sequencing, are revolutionizing fields such as reproductive genomics, exome sequencing, and infectious disease genomics.

    Technologies like PacBio sequencing, Ion Torrent sequencing, and nanopore sequencing are transforming genome assembly, methylation analysis, variant calling, and read mapping. Library preparation, quality control, and data analysis are crucial components of the NGS workflow. Additionally, NGS is making strides in forensic genomics, cancer genomics, mutation detection, and structural variation analysis. The agricultural sector is also benefiting from NGS in the areas of gene expression analysis and agricultural genomics. Data visualization tools are essential for interpreting the vast amounts of data generated by NGS, while clinical interpretation and variant annotation are crucial for translating raw data into actionable insights.

    Overall, the NGS market is a dynamic and evolving landscape, with new applications and technologies continually emerging to advance our understanding of the genome and its role in health and agriculture.

    Market Dynamics

    Our researchers analyzed the data with 2023 as the base year, along with the key drivers, trends, and challenges. A holistic analysis of drivers will help companies refine their marketing strategies to gain a competitive advantage.

    What are the key market drivers leading to the rise in the adoption of Next Generation Sequencing Industry?

    • The significant expansion in the application of Next-Generation Sequencing (NGS) techniques is the primary catalyst fueling market growth. 

    • Next Generation Sequencing (NGS) market has witnessed significant advancements, driven by the development of sequence databases and sophisticated NGS applications. RNA sequencing and targeted sequencing are among the key NGS techniques used for studying gene expression and identifying genetic variations. The availability of reference genomes and genome assembly tools has facilitated the analysis of copy number variation and methylation. Quality control measures ensure accurate results in NGS analysis. NGS offers several advantages over traditional methods, including higher throughput, reduced cost, and enhanced sensitivity. The capability to sequence millions of DNA fragments per run simultaneously enables the detection of rare variants and mutations with greater accuracy.
    • NGS applications extend beyond human genetics, finding applications in agriculture, environmental research, and microbiology. NGS market participants, such as Illumina, QIAGEN, Thermo Fisher Scientific, Bio-Rad Laboratories, Danaher, and PerkinElmer, leverage these advantages to offer comprehensive diagnostic services and research solutions. The technology's ability to provide a more comprehensive understanding of genetic information has revolutionized the field of genomics, leading to numerous breakthroughs in medical research and diagnostics.

    What are the market trends shaping the Next Generation Sequencing Industry?

    • Advances in Next-Generation Sequencing (NGS) techniques are currently shaping the market trend in the scientific community. The implementation of these innovative technologies is revolutionizing various industries, including healthcare and agriculture, by enabling more accurate and efficient genetic analysis.

    • Next Generation Sequencing (NGS) market has witnessed substantial growth due to the revolutionary impact of sequencing platforms in various fields of genomics. The Human Genome Project (HGP), initiated in 1990, paved the way for companies like Illumina, QIAGEN, Thermo Fisher Scientific, Bio-Rad Laboratories, Danaher, and PerkinElmer, and researchers to explore the function, structure, and organization of a complete human genome. NGS applications have expanded beyond research, reaching clinical environments for disease diagnosis and treatment outcomes. These techniques have significantly contributed to understanding genetic variations causing disorders, particularly in areas like reproductive genomics, exome sequencing, gene expression analysis, forensic genomics, and infectious disease genomics.
    • Technological advancements in NGS have resulted in a significant reduction in sequencing costs, making it accessible to smaller laboratories. NGS platforms offer data analysis tools, data visualization, and variant calling capabilities, enhancing the overall research experience. The ability to process large genomic data sets efficiently and accurately is a key driver for the growth of the NGS market. In summary, the NGS market has experienced significant growth due to its wide applicability in various fields of genomics and the technological innovations that have made it more accessible and cost-effective. These advancements have led to improved diagnostic capabilities and a deeper understanding of genetic disorders.

    What challenges does the Next Generation Sequencing Industry face during its growth?

    • The absence of clinical validation poses a significant challenge to the expansion of the direct-to-consumer genetic testing industry. This issue, which is of great concern to industry professionals, hinders the acceptance and trust of these tests among consumers and healthcare providers alike. 

    • Next-generation sequencing (NGS) technology has revolutionized the field of genomics, offering significant advancements in areas such as sequence alignment, library preparation, base calling, and single-cell sequencing. PACBIO and Ion Torrent sequencing are among the leading NGS technologies, providing high-quality data for various applications. However, the clinical utility of NGS in direct-to-consumer genetic testing has faced challenges due to concerns over the clinical validity of the results. The complexity of NGS data necessitates the involvement of experts, such as genetic counselors and medical practitioners, for accurate interpretation. Moreover, disease risk predictions from NGS tests do not account for environmental and lifestyle factors, which are crucial determinants of health outcomes.
    • These factors increase the need for consultation costs, making the tests less cost-effective for consumers. In agricultural genomics, NGS has facilitated the identification of genetic markers for crop improvement, contributing to increased productivity and sustainability. However, the high cost and technical complexity of NGS limit its widespread adoption in this sector. The advancements in NGS technology continue to drive innovation in various fields, including clinical diagnostics and research. As the technology matures, it is expected to become more accessible and affordable, enabling broader applications and transforming the way we understand and address health and agricultural challenges.

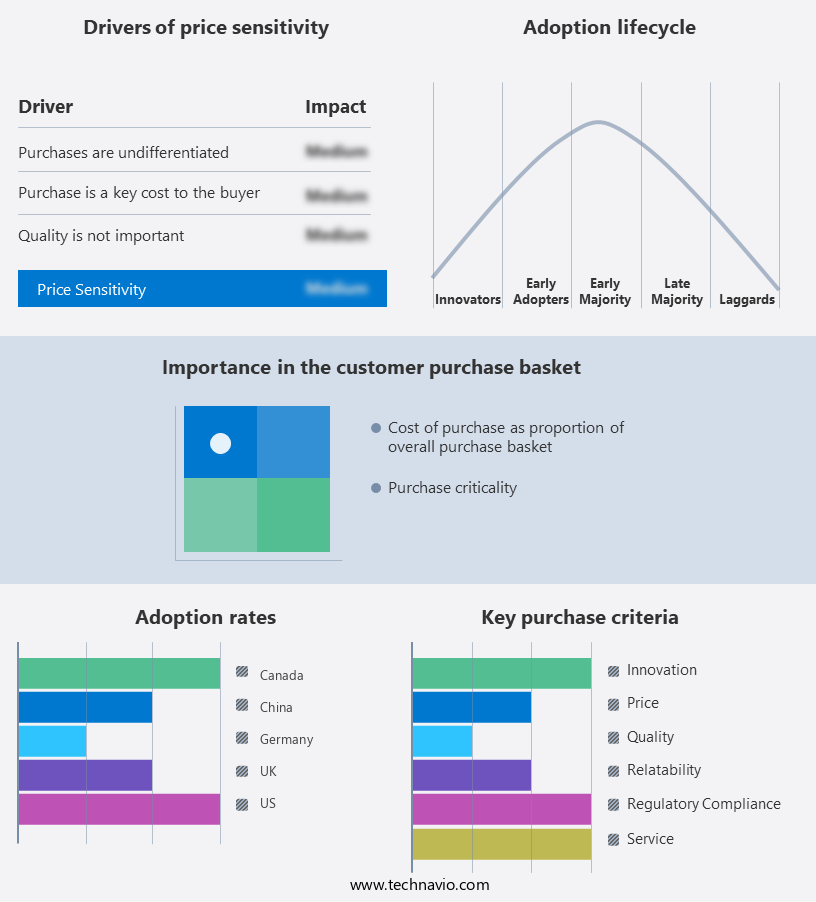
    Exclusive Customer Landscape

    The next generation sequencing market forecasting report includes the adoption lifecycle of the market, covering from the innovator’s stage to the laggard’s stage. It focuses on adoption rates in different regions based on penetration. Furthermore, the next generation sequencing market report also includes key purchase criteria and drivers of price sensitivity to help companies evaluate and develop their market growth analysis strategies.

    Next Generation Sequencing Market Share by Geography

     Customer Landscape

    Key Companies & Market Insights

    Companies are implementing various strategies, such as strategic alliances, next generation sequencing market forecast, partnerships, mergers and acquisitions, geographical expansion, and product/service launches, to enhance their presence in the industry.

    10X Genomics Inc. - This company leads in next-generation sequencing technology, featuring Chromium single cell, Visium spatial, and Xenium in situ methods. Their innovative approaches advance genetic research, enabling more precise and comprehensive analysis.

    The industry research and growth report includes detailed analyses of the competitive landscape of the market and information about key companies, including:

    • 10X Genomics Inc.
    • Azenta Inc.
    • BGI Genomics Co. Ltd.
    • Bio Rad Laboratories Inc.
    • Eurofins Scientific SE
    • F. Hoffmann La Roche Ltd.
    • Illumina Inc.
    • Konica Minolta Inc.
    • Laboratory Corp. of America Holdings
    • Merck KGaA
    • Nabsys Inc.
    • OPKO Health Inc.
    • Oxford Nanopore Technologies plc
    • Perkin Elmer Inc.
    • PierianDx Inc.
    • Psomagen Inc.
    • QIAGEN NV
    • Standard BioTools Inc.
    • Takara Bio Inc.
    • Thermo Fisher Scientific Inc.

    Qualitative and quantitative analysis of companies has been conducted to help clients understand the wider business environment as well as the strengths and weaknesses of key industry players. Data is qualitatively analyzed to categorize companies as pure play, category-focused, industry-focused, and diversified; it is quantitatively analyzed to categorize companies as dominant, leading, strong, tentative, and weak.

    Recent Development and News in Next Generation Sequencing Market

    • In January 2024, Illumina, a leading player in the Next Generation Sequencing (NGS) market, announced the launch of its new NovaSeq S4 System, which offers increased sequencing capacity and faster turnaround times compared to its previous models. This development was aimed at enhancing the company's position in the high-throughput NGS market (Illumina, 2024).
    • In March 2024, Thermo Fisher Scientific and 10x Genomics entered into a strategic collaboration to integrate 10x Genomics' Chromium Genome Engineering solutions with Thermo Fisher's Oncomine Dx Target Test, a cancer diagnostic test. This collaboration aimed to improve the accuracy and efficiency of cancer diagnostics (Thermo Fisher Scientific, 2024).
    • In May 2024, Pacific Biosciences, a key NGS technology provider, raised USD350 million in a funding round led by Fidelity Management and Research Company. This significant investment was intended to support the company's research and development efforts, including the advancement of its Single Molecule, Real-Time (SMRT) Sequencing technology (Pacific Biosciences, 2024).
    • In April 2025, the U.S. Food and Drug Administration (FDA) granted marketing authorization to Oxford Nanopore Technologies for its MinION Mk1C portable NGS system. This approval marked the first time a portable NGS system received FDA clearance, making it accessible for use in various settings, including point-of-care diagnostics and research applications (Oxford Nanopore Technologies, 2025).

    Research Analyst Overview

    • The Next Generation Sequencing (NGS) market is experiencing significant growth, driven by the integration of gene therapy, predictive testing, and precision medicine in various sectors. Newborn screening, carrier screening, and therapeutic monitoring are key applications benefiting from NGS's ability to provide comprehensive genetic information. Data security is a critical concern as massive parallel sequencing generates vast amounts of sensitive data, necessitating HIPAA and regulatory compliance. Cloud computing and data storage solutions facilitate efficient data management and analysis. Sequencing error correction and data interpretation software are essential for accurate results in prognostic and diagnostic testing.
    • Genome editing and biomarker discovery are also driving innovation, while sample preparation automation streamlines the process. The market's dynamics are influenced by the ongoing reduction in sequencing costs and the increasing importance of turnaround time in drug development. Ethical considerations remain a significant challenge, requiring ongoing dialogue and regulatory oversight.

    Dive into Technavio’s robust research methodology, blending expert interviews, extensive data synthesis, and validated models for unparalleled Next Generation Sequencing Market insights. See full methodology.

    Market Scope

    Report Coverage

    Details

    Page number

    181

    Base year

    2023

    Historic period

    2018-2022

    Forecast period

    2024-2028

    Growth momentum & CAGR

    Accelerate at a CAGR of 14.49%

    Market growth 2024-2028

    USD 4610.4 million

    Market structure

    Fragmented

    YoY growth 2023-2024(%)

    12.35

    Key countries

    US, Germany, Canada, China, and UK

    Competitive landscape

    Leading Companies, Market Positioning of Companies, Competitive Strategies, and Industry Risks

    Request Free Sample

    What are the Key Data Covered in this Next Generation Sequencing Market Research and Growth Report?

    • CAGR of the Next Generation Sequencing industry during the forecast period
    • Detailed information on factors that will drive the growth and forecasting between 2024 and 2028
    • Precise estimation of the size of the market and its contribution of the industry in focus to the parent market
    • Accurate predictions about upcoming growth and trends and changes in consumer behaviour
    • Growth of the market across North America, Europe, Asia, and Rest of World (ROW)
    • Thorough analysis of the market’s competitive landscape and detailed information about companies
    • Comprehensive analysis of factors that will challenge the next generation sequencing market growth of industry companies

    We can help! Our analysts can customize this next generation sequencing market research report to meet your requirements.

    Get in touch


    1 Executive Summary

    • 1.1 Market overview
      • Executive Summary - Chart on Market Overview
      • Executive Summary - Data Table on Market Overview
      • Executive Summary - Chart on Global Market Characteristics
      • Executive Summary - Chart on Market by Geography
      • Executive Summary - Chart on Market Segmentation by End-user
      • Executive Summary - Chart on Market Segmentation by Product
      • Executive Summary - Chart on Incremental Growth
      • Executive Summary - Data Table on Incremental Growth
      • Executive Summary - Chart on Company Market Positioning

    2 Market Landscape

    • 2.1 Market ecosystem
      • Parent Market
      • Data Table on - Parent Market
    • 2.2 Market characteristics
      • Market characteristics analysis
    • 2.3 Value chain analysis
      • Value Chain Analysis

    3 Market Sizing

    • 3.1 Market definition
      • Offerings of companies included in the market definition
    • 3.2 Market segment analysis
      • Market segments
    • 3.3 Market size 2023
      • 3.4 Market outlook: Forecast for 2023-2028
        • Chart on Global - Market size and forecast 2023-2028 ($ million)
        • Data Table on Global - Market size and forecast 2023-2028 ($ million)
        • Chart on Global Market: Year-over-year growth 2023-2028 (%)
        • Data Table on Global Market: Year-over-year growth 2023-2028 (%)

      4 Historic Market Size

      • 4.1 Global Next Generation Sequencing Market 2018 - 2022
        • Historic Market Size - Data Table on Global Next Generation Sequencing Market 2018 - 2022 ($ million)
      • 4.2 End-user segment analysis 2018 - 2022
        • Historic Market Size - End-user Segment 2018 - 2022 ($ million)
      • 4.3 Product segment analysis 2018 - 2022
        • Historic Market Size - Product Segment 2018 - 2022 ($ million)
      • 4.4 Geography segment analysis 2018 - 2022
        • Historic Market Size - Geography Segment 2018 - 2022 ($ million)
      • 4.5 Country segment analysis 2018 - 2022
        • Historic Market Size - Country Segment 2018 - 2022 ($ million)

      5 Five Forces Analysis

      • 5.1 Five forces summary
        • Five forces analysis - Comparison between 2023 and 2028
      • 5.2 Bargaining power of buyers
        • Bargaining power of buyers - Impact of key factors 2023 and 2028
      • 5.3 Bargaining power of suppliers
        • Bargaining power of suppliers - Impact of key factors in 2023 and 2028
      • 5.4 Threat of new entrants
        • Threat of new entrants - Impact of key factors in 2023 and 2028
      • 5.5 Threat of substitutes
        • Threat of substitutes - Impact of key factors in 2023 and 2028
      • 5.6 Threat of rivalry
        • Threat of rivalry - Impact of key factors in 2023 and 2028
      • 5.7 Market condition
        • Chart on Market condition - Five forces 2023 and 2028

      6 Market Segmentation by End-user

      • 6.1 Market segments
        • Chart on End-user - Market share 2023-2028 (%)
        • Data Table on End-user - Market share 2023-2028 (%)
      • 6.2 Comparison by End-user
        • Chart on Comparison by End-user
        • Data Table on Comparison by End-user
      • 6.3 Academic research - Market size and forecast 2023-2028
        • Chart on Academic research - Market size and forecast 2023-2028 ($ million)
        • Data Table on Academic research - Market size and forecast 2023-2028 ($ million)
        • Chart on Academic research - Year-over-year growth 2023-2028 (%)
        • Data Table on Academic research - Year-over-year growth 2023-2028 (%)
      • 6.4 Clinical research - Market size and forecast 2023-2028
        • Chart on Clinical research - Market size and forecast 2023-2028 ($ million)
        • Data Table on Clinical research - Market size and forecast 2023-2028 ($ million)
        • Chart on Clinical research - Year-over-year growth 2023-2028 (%)
        • Data Table on Clinical research - Year-over-year growth 2023-2028 (%)
      • 6.5 Pharmaceutical and biotechnology companies - Market size and forecast 2023-2028
        • Chart on Pharmaceutical and biotechnology companies - Market size and forecast 2023-2028 ($ million)
        • Data Table on Pharmaceutical and biotechnology companies - Market size and forecast 2023-2028 ($ million)
        • Chart on Pharmaceutical and biotechnology companies - Year-over-year growth 2023-2028 (%)
        • Data Table on Pharmaceutical and biotechnology companies - Year-over-year growth 2023-2028 (%)
      • 6.6 Others - Market size and forecast 2023-2028
        • Chart on Others - Market size and forecast 2023-2028 ($ million)
        • Data Table on Others - Market size and forecast 2023-2028 ($ million)
        • Chart on Others - Year-over-year growth 2023-2028 (%)
        • Data Table on Others - Year-over-year growth 2023-2028 (%)
      • 6.7 Market opportunity by End-user
        • Market opportunity by End-user ($ million)
        • Data Table on Market opportunity by End-user ($ million)

      7 Market Segmentation by Product

      • 7.1 Market segments
        • Chart on Product - Market share 2023-2028 (%)
        • Data Table on Product - Market share 2023-2028 (%)
      • 7.2 Comparison by Product
        • Chart on Comparison by Product
        • Data Table on Comparison by Product
      • 7.3 Consumables - Market size and forecast 2023-2028
        • Chart on Consumables - Market size and forecast 2023-2028 ($ million)
        • Data Table on Consumables - Market size and forecast 2023-2028 ($ million)
        • Chart on Consumables - Year-over-year growth 2023-2028 (%)
        • Data Table on Consumables - Year-over-year growth 2023-2028 (%)
      • 7.4 Equipment - Market size and forecast 2023-2028
        • Chart on Equipment - Market size and forecast 2023-2028 ($ million)
        • Data Table on Equipment - Market size and forecast 2023-2028 ($ million)
        • Chart on Equipment - Year-over-year growth 2023-2028 (%)
        • Data Table on Equipment - Year-over-year growth 2023-2028 (%)
      • 7.5 Market opportunity by Product
        • Market opportunity by Product ($ million)
        • Data Table on Market opportunity by Product ($ million)

      8 Customer Landscape

      • 8.1 Customer landscape overview
        • Analysis of price sensitivity, lifecycle, customer purchase basket, adoption rates, and purchase criteria

      9 Geographic Landscape

      • 9.1 Geographic segmentation
        • Chart on Market share by geography 2023-2028 (%)
        • Data Table on Market share by geography 2023-2028 (%)
      • 9.2 Geographic comparison
        • Chart on Geographic comparison
        • Data Table on Geographic comparison
      • 9.3 North America - Market size and forecast 2023-2028
        • Chart on North America - Market size and forecast 2023-2028 ($ million)
        • Data Table on North America - Market size and forecast 2023-2028 ($ million)
        • Chart on North America - Year-over-year growth 2023-2028 (%)
        • Data Table on North America - Year-over-year growth 2023-2028 (%)
      • 9.4 Europe - Market size and forecast 2023-2028
        • Chart on Europe - Market size and forecast 2023-2028 ($ million)
        • Data Table on Europe - Market size and forecast 2023-2028 ($ million)
        • Chart on Europe - Year-over-year growth 2023-2028 (%)
        • Data Table on Europe - Year-over-year growth 2023-2028 (%)
      • 9.5 Asia - Market size and forecast 2023-2028
        • Chart on Asia - Market size and forecast 2023-2028 ($ million)
        • Data Table on Asia - Market size and forecast 2023-2028 ($ million)
        • Chart on Asia - Year-over-year growth 2023-2028 (%)
        • Data Table on Asia - Year-over-year growth 2023-2028 (%)
      • 9.6 Rest of World (ROW) - Market size and forecast 2023-2028
        • Chart on Rest of World (ROW) - Market size and forecast 2023-2028 ($ million)
        • Data Table on Rest of World (ROW) - Market size and forecast 2023-2028 ($ million)
        • Chart on Rest of World (ROW) - Year-over-year growth 2023-2028 (%)
        • Data Table on Rest of World (ROW) - Year-over-year growth 2023-2028 (%)
      • 9.7 US - Market size and forecast 2023-2028
        • Chart on US - Market size and forecast 2023-2028 ($ million)
        • Data Table on US - Market size and forecast 2023-2028 ($ million)
        • Chart on US - Year-over-year growth 2023-2028 (%)
        • Data Table on US - Year-over-year growth 2023-2028 (%)
      • 9.8 Germany - Market size and forecast 2023-2028
        • Chart on Germany - Market size and forecast 2023-2028 ($ million)
        • Data Table on Germany - Market size and forecast 2023-2028 ($ million)
        • Chart on Germany - Year-over-year growth 2023-2028 (%)
        • Data Table on Germany - Year-over-year growth 2023-2028 (%)
      • 9.9 Canada - Market size and forecast 2023-2028
        • Chart on Canada - Market size and forecast 2023-2028 ($ million)
        • Data Table on Canada - Market size and forecast 2023-2028 ($ million)
        • Chart on Canada - Year-over-year growth 2023-2028 (%)
        • Data Table on Canada - Year-over-year growth 2023-2028 (%)
      • 9.10 China - Market size and forecast 2023-2028
        • Chart on China - Market size and forecast 2023-2028 ($ million)
        • Data Table on China - Market size and forecast 2023-2028 ($ million)
        • Chart on China - Year-over-year growth 2023-2028 (%)
        • Data Table on China - Year-over-year growth 2023-2028 (%)
      • 9.11 UK - Market size and forecast 2023-2028
        • Chart on UK - Market size and forecast 2023-2028 ($ million)
        • Data Table on UK - Market size and forecast 2023-2028 ($ million)
        • Chart on UK - Year-over-year growth 2023-2028 (%)
        • Data Table on UK - Year-over-year growth 2023-2028 (%)
      • 9.12 Market opportunity by geography
        • Market opportunity by geography ($ million)
        • Data Tables on Market opportunity by geography ($ million)

      10 Drivers, Challenges, and Opportunity/Restraints

      • 10.1 Market drivers
        • 10.2 Market challenges
          • 10.3 Impact of drivers and challenges
            • Impact of drivers and challenges in 2023 and 2028
          • 10.4 Market opportunities/restraints

            11 Competitive Landscape

            • 11.1 Overview
              • 11.2 Competitive Landscape
                • Overview on criticality of inputs and factors of differentiation
              • 11.3 Landscape disruption
                • Overview on factors of disruption
              • 11.4 Industry risks
                • Impact of key risks on business

              12 Competitive Analysis

              • 12.1 Companies profiled
                • Companies covered
              • 12.2 Market positioning of companies
                • Matrix on companies position and classification
              • 10X Genomics Inc.
                • 10X Genomics Inc. - Overview
                • 10X Genomics Inc. - Product / Service
                • 10X Genomics Inc. - Key offerings
              • 12.4 Azenta Inc.
                • Azenta Inc. - Overview
                • Azenta Inc. - Business segments
                • Azenta Inc. - Key news
                • Azenta Inc. - Key offerings
                • Azenta Inc. - Segment focus
              • 12.5 BGI Genomics Co. Ltd.
                • BGI Genomics Co. Ltd. - Overview
                • BGI Genomics Co. Ltd. - Product / Service
                • BGI Genomics Co. Ltd. - Key offerings
              • 12.6 Bio Rad Laboratories Inc.
                • Bio Rad Laboratories Inc. - Overview
                • Bio Rad Laboratories Inc. - Business segments
                • Bio Rad Laboratories Inc. - Key news
                • Bio Rad Laboratories Inc. - Key offerings
                • Bio Rad Laboratories Inc. - Segment focus
              • 12.7 Eurofins Scientific SE
                • Eurofins Scientific SE - Overview
                • Eurofins Scientific SE - Business segments
                • Eurofins Scientific SE - Key news
                • Eurofins Scientific SE - Key offerings
                • Eurofins Scientific SE - Segment focus
              • 12.8 F. Hoffmann La Roche Ltd.
                • F. Hoffmann La Roche Ltd. - Overview
                • F. Hoffmann La Roche Ltd. - Business segments
                • F. Hoffmann La Roche Ltd. - Key news
                • F. Hoffmann La Roche Ltd. - Key offerings
                • F. Hoffmann La Roche Ltd. - Segment focus
              • 12.9 Illumina Inc.
                • Illumina Inc. - Overview
                • Illumina Inc. - Business segments
                • Illumina Inc. - Key news
                • Illumina Inc. - Key offerings
                • Illumina Inc. - Segment focus
              • 12.10 Konica Minolta Inc.
                • Konica Minolta Inc. - Overview
                • Konica Minolta Inc. - Business segments
                • Konica Minolta Inc. - Key news
                • Konica Minolta Inc. - Key offerings
                • Konica Minolta Inc. - Segment focus
              • 12.11 Laboratory Corp. of America Holdings
                • Laboratory Corp. of America Holdings - Overview
                • Laboratory Corp. of America Holdings - Business segments
                • Laboratory Corp. of America Holdings - Key news
                • Laboratory Corp. of America Holdings - Key offerings
                • Laboratory Corp. of America Holdings - Segment focus
              • 12.12 Merck KGaA
                • Merck KGaA - Overview
                • Merck KGaA - Business segments
                • Merck KGaA - Key news
                • Merck KGaA - Key offerings
                • Merck KGaA - Segment focus
              • 12.13 Perkin Elmer Inc.
                • Perkin Elmer Inc. - Overview
                • Perkin Elmer Inc. - Business segments
                • Perkin Elmer Inc. - Key news
                • Perkin Elmer Inc. - Key offerings
                • Perkin Elmer Inc. - Segment focus
              • 12.14 QIAGEN NV
                • QIAGEN NV - Overview
                • QIAGEN NV - Product / Service
                • QIAGEN NV - Key news
                • QIAGEN NV - Key offerings
              • 12.15 Standard BioTools Inc.
                • Standard BioTools Inc. - Overview
                • Standard BioTools Inc. - Product / Service
                • Standard BioTools Inc. - Key offerings
              • 12.16 Takara Bio Inc.
                • Takara Bio Inc. - Overview
                • Takara Bio Inc. - Product / Service
                • Takara Bio Inc. - Key news
                • Takara Bio Inc. - Key offerings
              • 12.17 Thermo Fisher Scientific Inc.
                • Thermo Fisher Scientific Inc. - Overview
                • Thermo Fisher Scientific Inc. - Business segments
                • Thermo Fisher Scientific Inc. - Key news
                • Thermo Fisher Scientific Inc. - Key offerings
                • Thermo Fisher Scientific Inc. - Segment focus

              13 Appendix

              • 13.1 Scope of the report
                • 13.2 Inclusions and exclusions checklist
                  • Inclusions checklist
                  • Exclusions checklist
                • 13.3 Currency conversion rates for US$
                  • Currency conversion rates for US$
                • 13.4 Research methodology
                  • Research methodology
                • 13.5 Data procurement
                  • Information sources
                • 13.6 Data validation
                  • Data validation
                • 13.7 Validation techniques employed for market sizing
                  • Validation techniques employed for market sizing
                • 13.8 Data synthesis
                  • Data synthesis
                • 360 degree market analysis
                  • 360 degree market analysis
                • 13.10 List of abbreviations
                  • List of abbreviations

                Research Methodology

                Technavio presents a detailed picture of the market by way of study, synthesis, and summation of data from multiple sources. The analysts have presented the various facets of the market with a particular focus on identifying the key industry influencers. The data thus presented is comprehensive, reliable, and the result of extensive research, both primary and secondary.

                INFORMATION SOURCES

                Primary sources

                • Manufacturers and suppliers
                • Channel partners
                • Industry experts
                • Strategic decision makers

                Secondary sources

                • Industry journals and periodicals
                • Government data
                • Financial reports of key industry players
                • Historical data
                • Press releases

                DATA ANALYSIS

                Data Synthesis

                • Collation of data
                • Estimation of key figures
                • Analysis of derived insights

                Data Validation

                • Triangulation with data models
                • Reference against proprietary databases
                • Corroboration with industry experts

                REPORT WRITING

                Qualitative

                • Market drivers
                • Market challenges
                • Market trends
                • Five forces analysis

                Quantitative

                • Market size and forecast
                • Market segmentation
                • Geographical insights
                • Competitive landscape

                Interested in this report?

                Get your sample now to see our research methodology and insights!

                Download Now

                Frequently Asked Questions

                Next Generation Sequencing market growth will increase by $ 4610.4 mn during 2024-2028.

                The Next Generation Sequencing market is expected to grow at a CAGR of 14.49% during 2024-2028.

                Next Generation Sequencing market is segmented by End-user( Academic research, Clinical research, Pharmaceutical and biotechnology companies, Others) Product( Consumables, Equipment, Asia, ROW)

                10X Genomics Inc., Azenta Inc., BGI Genomics Co. Ltd., Bio Rad Laboratories Inc., Eurofins Scientific SE, F. Hoffmann La Roche Ltd., Illumina Inc., Konica Minolta Inc., Laboratory Corp. of America Holdings, Merck KGaA, Nabsys Inc., OPKO Health Inc., Oxford Nanopore Technologies plc, Perkin Elmer Inc., PierianDx Inc., Psomagen Inc., QIAGEN NV, Standard BioTools Inc., Takara Bio Inc., Thermo Fisher Scientific Inc. are a few of the key vendors in the Next Generation Sequencing market.

                North America will register the highest growth rate of 42% among the other regions. Therefore, the Next Generation Sequencing market in North America is expected to garner significant business opportunities for the vendors during the forecast period.

                US, Germany, Canada, China, UK

                • Increased utilization of NGS methodsRapid developments in next generation sequencing market techniques and the creation of a human genome database have allowed vendors (such as Illumina is the driving factor this market.
                • QIAGEN is the driving factor this market.
                • Thermo Fisher Scientific is the driving factor this market.
                • Bio-Rad Laboratories is the driving factor this market.
                • Danaher is the driving factor this market.
                • and PerkinElmer) to offer rapid diagnostic services and the capability to diagnose mutations and disorders in human gene sequences by using the complete human genome to study its structure is the driving factor this market.
                • function is the driving factor this market.
                • and organization. Moreover is the driving factor this market.
                • NGS offers a significant reduction of cost in the performance of sequential studies and bears higher variant detection power and sensitivity by enabling the sequencing of millions of DNA fragments per run simultaneously when compared to conventional Sanger sequencing technology. The NGS techniques provide high processing speed and throughput that can generate a vast number of sequences with many applications in research is the driving factor this market.
                • as well as in the diagnostic field. Single-cell genomics is observing fast adoption in the selection of optimal embryos using individual cells for studying transcriptome (set of RNA molecules) in the genome. Similarly is the driving factor this market.
                • increasing adoption of blastocyst biopsy technique (over polar body biopsy and blastomere biopsy) is the driving factor this market.
                • Bayes factor sampling is the driving factor this market.
                • quantitative multiplex PCR (qPCR) is the driving factor this market.
                • and DNA Microarray can also be witnessed among genetic testing service providers as these technologies offer cost-effective and accurate diagnostic capabilities. For instance is the driving factor this market.
                • advanced DNA Microarray is the driving factor this market.
                • such as single nucleotide polymorphism (SNP) array is the driving factor this market.
                • can detect about 300 is the driving factor this market.
                • 000 genetic markers that enable them to identify parental translocation imbalances in the embryo. This has allowed the vendors (such as Illumina is the driving factor this market.
                • QIAGEN is the driving factor this market.
                • Thermo Fisher Scientific is the driving factor this market.
                • Bio-Rad Laboratories is the driving factor this market.
                • Danaher is the driving factor this market.
                • and PerkinElmer) to offer reliable genetic testing services and products using NGS in the market is the driving factor this market.
                • which will propel the market growth during the forecast period. NGS techniques have gained huge popularity for their use in whole viral genome sequencing is the driving factor this market.
                • which includes sequencing of new influenza viruses is the driving factor this market.
                • detection of viral genome variability is the driving factor this market.
                • and monitoring of low-abundance antiviral drug-resistance mutations. Also is the driving factor this market.
                • researchers are thoroughly studying and developing further prospectus is the driving factor this market.
                • which is expected to improve the performance of these techniques as a reliable solution and augment the growth of the global next generation sequencing market during forecast period. is the driving factor this market.

                The Next Generation Sequencing market vendors should focus on grabbing business opportunities from the Academic research segment as it accounted for the largest market share in the base year.