
Alloy Wheels Aftermarket Market Analysis, Size, and Forecast 2026-2030: APAC (China, Japan, and India), Europe (Germany, UK, and Italy), North America (US, Canada, and Mexico), South America (Brazil, Argentina, and Chile), Middle East and Africa (Saudi Arabia, UAE, and South Africa), and Rest of World (ROW)

Alloy Wheels Aftermarket Market Analysis, Size, and Forecast 2026-2030:
APAC (China, Japan, and India), Europe (Germany, UK, and Italy), North America (US, Canada, and Mexico), South America (Brazil, Argentina, and Chile), Middle East and Africa (Saudi Arabia, UAE, and South Africa), and Rest of World (ROW)

Published: Oct 2026 290 Pages SKU: IRTNTR43938

Market Overview at a Glance

$839 Mn
Market Opportunity
4.9%
CAGR 2025 - 2030
54.2%
APAC Growth
$1.55 B
13-17 inches segment 2024

Alloy Wheels Aftermarket Market Size 2026-2030

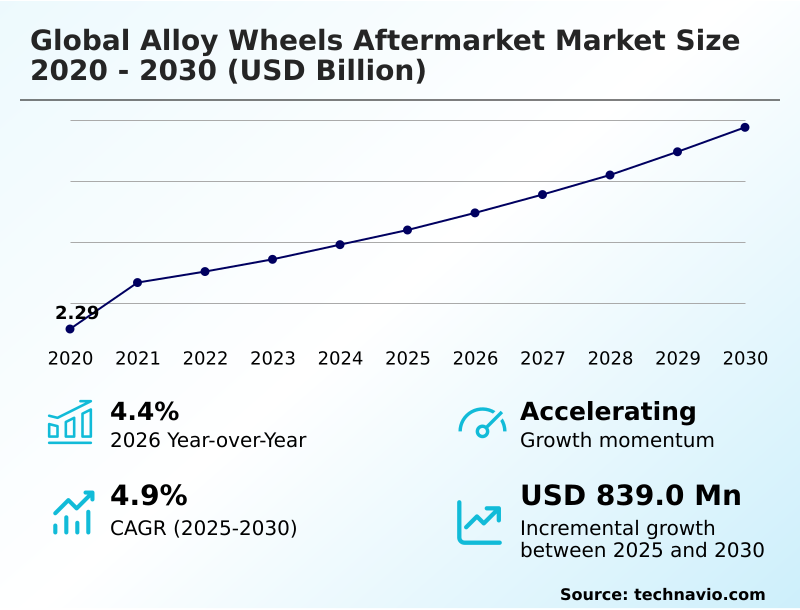
The alloy wheels aftermarket market size is valued to increase by USD 839 million, at a CAGR of 4.9% from 2025 to 2030. Surging demand for vehicle customization will drive the alloy wheels aftermarket market.

Major Market Trends & Insights

  • APAC dominated the market and accounted for a 54.2% growth during the forecast period.
  • By Type - 13-17 inches segment was valued at USD 1.55 billion in 2024
  • By Vehicle Type - Passenger vehicle segment accounted for the largest market revenue share in 2024

Market Size & Forecast

  • Market Opportunities: USD 1.65 billion
  • Market Future Opportunities: USD 839 million
  • CAGR from 2025 to 2030 : 4.9%

Market Summary

  • The Alloy Wheels Aftermarket operates as a highly dynamic segment driven by rapid advancements in vehicle personalization and lightweight engineering. The pursuit of enhanced vehicle performance serves as a primary expansion catalyst, directly resulting from consumers demanding a significant rotational inertia decrease to improve handling agility.
  • By integrating a rotary forging process, manufacturers can engineer products that elevate braking responsiveness and fuel efficiency. For instance, transitioning from conventional steel components to a forged aluminum billet reduces unsprung mass by approximately 25 percent, directly improving suspension tracking. However, escalating production expenses and volatile raw material pricing impose substantial structural limitations on the industry.
  • When supply chain disruptions inflate the costs of specialized metals, independent manufacturers face narrowed profit margins and extended production lead times. A notable real-world business scenario involves aftermarket distributors optimizing inventory logistics by centralizing warehousing for high-demand aerospace grade aluminum wheels, reducing distribution bottlenecks.
  • Ultimately, continuous innovation in thermal dissipation capability helps the sector overcome material vulnerabilities while catering to the stringent mechanical demands of modern electrified platforms.

What will be the Size of the Alloy Wheels Aftermarket Market during the forecast period?
Get Key Insights on Market Forecast (PDF) Get Free Sample

How is the Alloy Wheels Aftermarket Market Segmented?

The alloy wheels aftermarket industry research report provides comprehensive data (region-wise segment analysis), with forecasts and estimates in "USD million" for the period 2026-2030, as well as historical data from 2020-2024 for the following segments.

  • Type
    • 13-17 inches
    • 18-20 inches
    • 21 inches and above
  • Vehicle type
    • Passenger vehicle
    • Commercial vehicle
  • Material
    • Aluminum alloy
    • Magnesium alloy
    • Others
  • Geography
    • APAC
      • China
      • Japan
      • India
      • South Korea
      • Australia
      • Indonesia
    • Europe
      • Germany
      • UK
      • Italy
      • France
      • Spain
      • The Netherlands
    • North America
      • US
      • Canada
      • Mexico
    • South America
      • Brazil
      • Argentina
      • Chile
    • Middle East and Africa
      • Saudi Arabia
      • UAE
      • South Africa
      • Turkey
      • Israel

By Type Insights

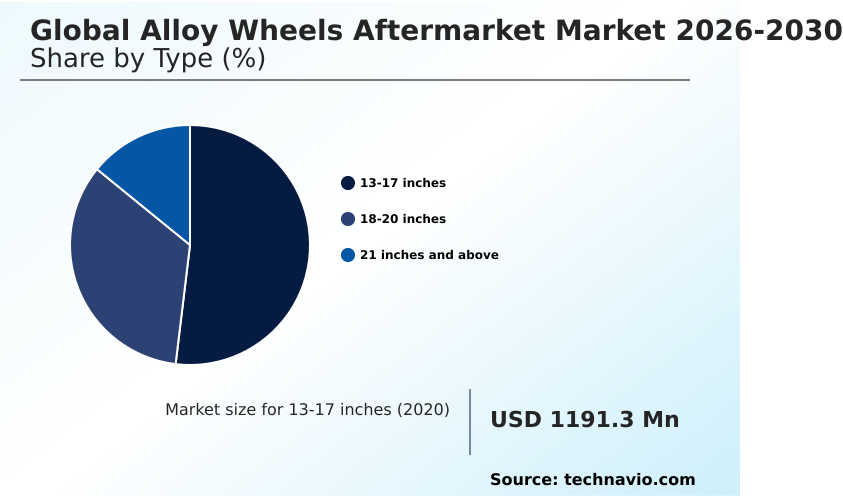
The 13-17 inches segment is estimated to witness significant growth during the forecast period.

The thirteen to seventeen-inch tier serves as a fundamental structural category, servicing extensive vehicle parcs that prioritize operational reliability. Organizations managing urban delivery fleets frequently transition to a heat treated alloy to maintain ride comfort.

Upgrading to these dimensions improves suspension responsiveness optimization by up to 15 percent. Manufacturers leverage low-pressure casting and the rotary forging process to deliver durable multi-piece wheel construction.

By utilizing a flow-forming technique and multi-axis CNC machining, producers maximize structural tensile strength.

Furthermore, advanced directional spoke orientation and a custom bolt pattern ensure continuous replacement demand across global distribution networks, balancing manufacturing efficiencies with essential vehicle customization necessities for high-volume commuter models.
Get Free Sample

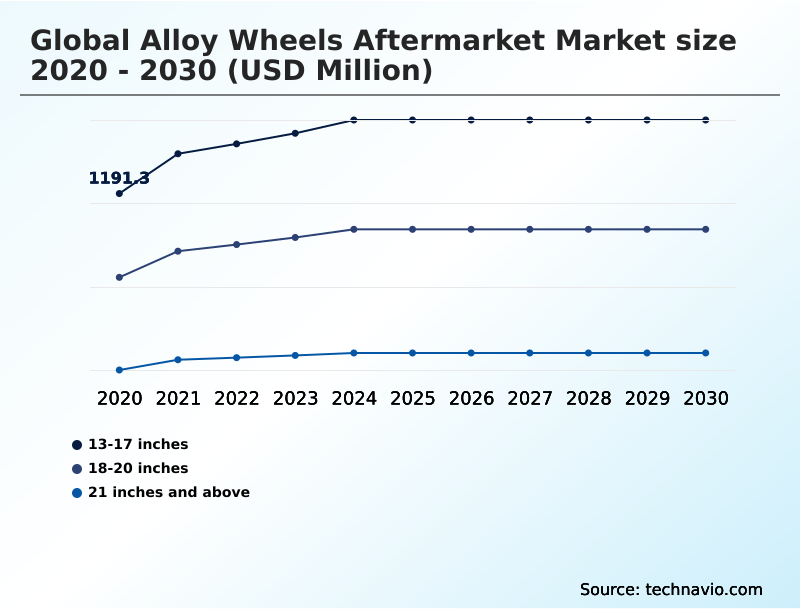
The 13-17 inches segment was valued at USD 1.55 billion in 2024 and showed a gradual increase during the forecast period.
Get Free Sample

Regional Analysis

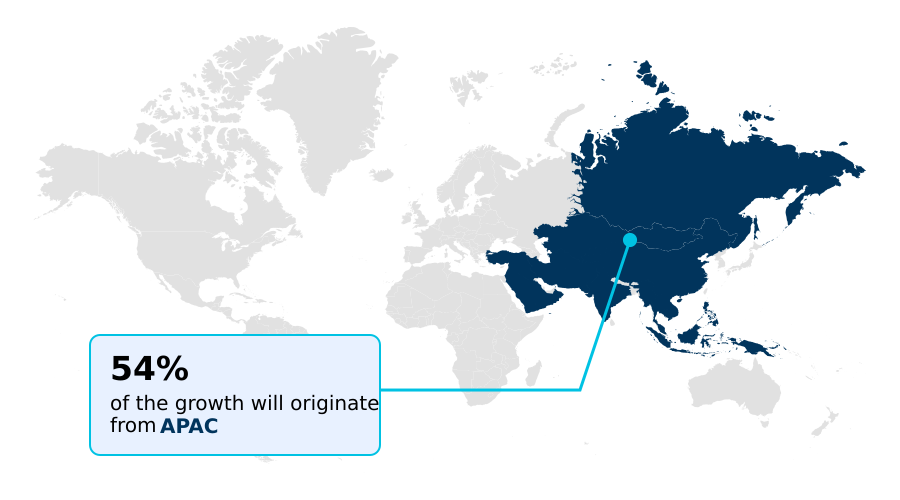
APAC is estimated to contribute 54.2% to the growth of the global market during the forecast period.Technavio’s analysts have elaborately explained the regional trends and drivers that shape the market during the forecast period.
See How Alloy Wheels Aftermarket Market Demand is Rising in APAC Get Free Sample

The geographic distribution of the Alloy Wheels Aftermarket highlights distinct regional disparities driven by consumer preferences. North America demonstrates robust adoption of advanced wheel hub mounting techniques, supported by high consumer spending.

In contrast, the APAC region experiences rapid penetration of a magnesium rim cast process, where domestic manufacturing efficiencies lower production costs by up to 18 percent compared to western counterparts.

This cost advantage allows Asian manufacturers to dominate commuter segments by minimizing vehicle unsprung weight. European markets enforce strict regulations regarding brake caliper clearance and pitch circle diameter configurations.

The integration of meticulous metal grain alignment and specialized spoke geometry design in Europe has improved structural longevity. Conversely, North American distributors focus on heavy-duty powder coating application processes, leading to a 22 percent increase in regional inventory durability.

Market Dynamics

Our researchers analyzed the data with 2025 as the base year, along with the key drivers, trends, and challenges. A holistic analysis of drivers will help companies refine their marketing strategies to gain a competitive advantage.

  • The operational dynamics of the Alloy Wheels Aftermarket heavily emphasize precision engineering and material science to meet evolving automotive performance standards. Manufacturers continuously prioritize unsprung mass reduction efficiency to guarantee optimal vehicle handling and suspension tracking across varied terrain.
  • As electric vehicle architectures gain prominence, the implementation of an aerodynamic profile for drag reduction becomes crucial, allowing fleet operators to extend battery range and decrease overall energy consumption.
  • Concurrently, producers leveraging low-pressure cast aluminum durability achieve a highly favorable balance between manufacturing scale and structural integrity, resulting in a production yield improvement of nearly 30 percent compared to traditional gravity casting methods. This yield enhancement directly streamlines supply chain planning and reduces raw material waste.
  • Premium automotive segments increasingly demand rotary forged multi-piece construction to accommodate customized offsets and extreme load specifications, giving enthusiast drivers unparalleled control over vehicle geometry. Furthermore, advanced spoke designs prioritize thermal dissipation in performance braking, actively mitigating heat accumulation during aggressive driving scenarios. These specialized engineering attributes ensure that independent retailers can offer differentiated products that surpass standard factory specifications.
  • By refining metal treatments and surface protections, the industry continually overcomes environmental degradation challenges.
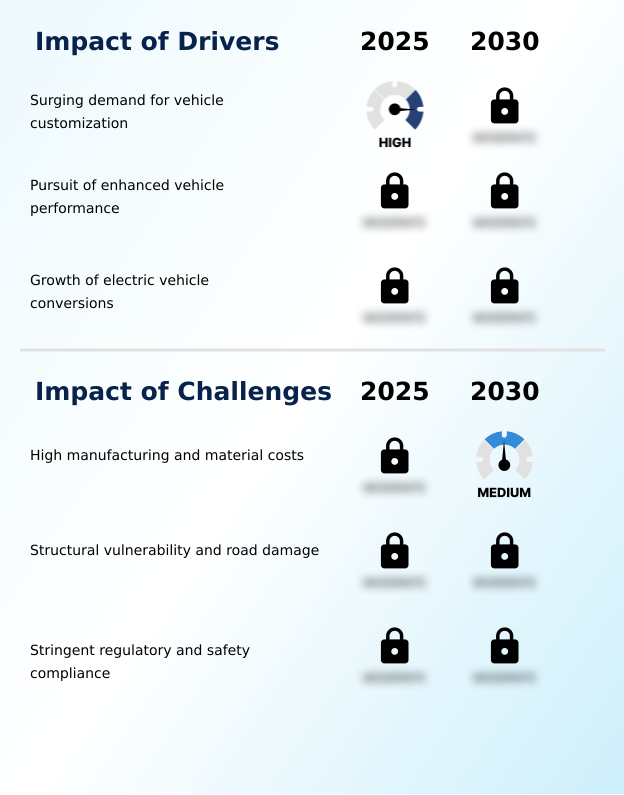
What are the key market drivers leading to the rise in the adoption of Alloy Wheels Aftermarket Industry?

  • The surging demand for vehicle customization serves as a primary catalyst accelerating continuous expansion within the market.

  • The relentless pursuit of superior vehicle dynamics acts as a fundamental catalyst accelerating modernization within the Alloy Wheels Aftermarket. Consumers increasingly demand an aggressive rotational inertia decrease and unsprung mass reduction to optimize braking efficiency.
  • By utilizing an advanced forged aluminum billet, manufacturers reduce rotating assembly mass by up to 22 percent, yielding sharper throttle responses. Integrating an aerodynamic wheel profile significantly improves aerodynamic drag reduction, counteracting high-speed turbulence for rolling resistance minimization.
  • Furthermore, the requirement for superior thermal dissipation capability forces engineering teams to redesign internal architectures, permitting compatibility with a high-performance brake rotor and multi-piston caliper kit. These adoptions optimize the tire contact patch, transforming wheels into essential mechanical upgrades.

What are the market trends shaping the Alloy Wheels Aftermarket Industry?

  • The expansion of digital retail channels represents a pivotal market trend reshaping distribution networks. This shift facilitates enhanced consumer accessibility and accelerates direct-to-consumer engagement models.

  • The rapid proliferation of digital retail channels fundamentally revolutionizes procurement methodologies across the Alloy Wheels Aftermarket. This transition toward virtual platforms allows consumers to accurately verify hub-centric rings and bead seat profile compatibility, subsequently reducing product return rates by nearly 18 percent.
  • Digital accessibility empowers independent manufacturers to optimize inventory forecasting for complex wheel offset calibration requirements and customized wheel fitment. The rising preference for a specialized corrosion resistant finish drives foundries to implement ceramic nano-coating and physical vapor deposition processes.
  • By refining wheel flange design, deep dish layout configurations, and a flush spoke profile, aftermarket brands capture a geographically dispersed consumer base. These digital ecosystem expansions ensure rapid fulfillment while minimizing warehousing bottlenecks.

What challenges does the Alloy Wheels Aftermarket Industry face during its growth?

  • Escalating manufacturing and material costs remain a formidable challenge constraining industry profitability and operational expansion.

  • Severe raw material price volatility and high manufacturing expenses pose significant operational limitations across the Alloy Wheels Aftermarket. The reliance on a lightweight metal composite and aerospace grade aluminum inflates baseline production expenditures by over 20 percent. Furthermore, structural vulnerability on compromised roads frequently compromises load bearing capacity and shock load transfer, leading to increased warranty claims.
  • Navigating divergent international safety regulations complicates the validation of impact resistance testing, the radial fatigue test, and dynamic cornering fatigue requirements. When precision machined rim components suffer damage, the reliance on a complex thermal straightening technique creates repair bottlenecks. These financial barriers force stakeholders to carefully monitor wheel track width limits while balancing manufacturing costs.

Exclusive Technavio Analysis on Customer Landscape

The alloy wheels aftermarket market forecasting report includes the adoption lifecycle of the market, covering from the innovator’s stage to the laggard’s stage. It focuses on adoption rates in different regions based on penetration. Furthermore, the alloy wheels aftermarket market report also includes key purchase criteria and drivers of price sensitivity to help companies evaluate and develop their market growth analysis strategies.
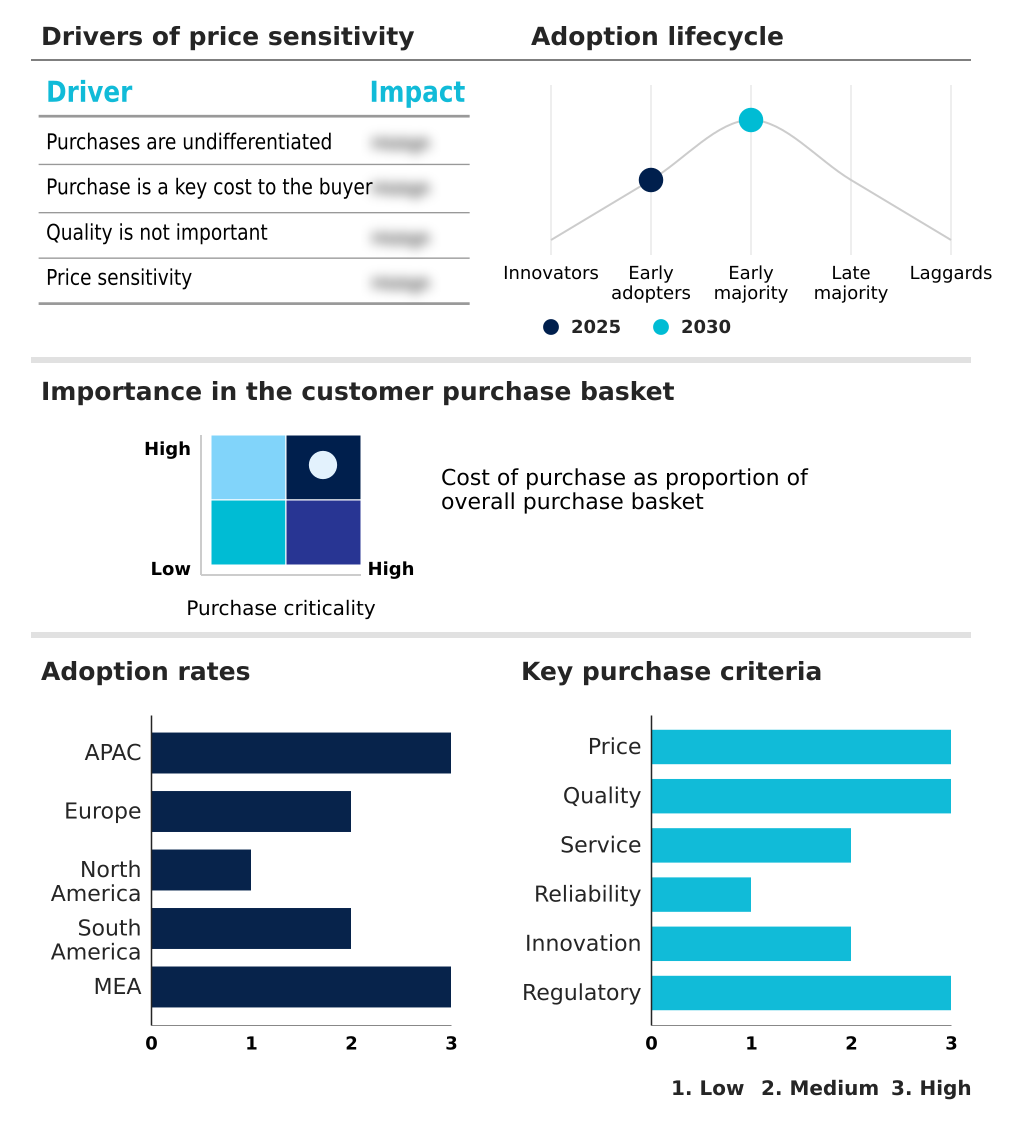
Customer Landscape of Alloy Wheels Aftermarket Industry

Competitive Landscape

Companies are implementing various strategies, such as strategic alliances, alloy wheels aftermarket market forecast, partnerships, mergers and acquisitions, geographical expansion, and product/service launches, to enhance their presence in the industry.

Advanti Racing - The entity delivers premium flow-formed and cast rims alongside specialized racing variants, offering lightweight automotive components engineered to enhance structural integrity and mechanical performance for modern passenger applications.

The industry research and growth report includes detailed analyses of the competitive landscape of the market and information about key companies, including:

  • Advanti Racing
  • American Force Wheels
  • American Racing Equipment Inc.
  • BBS GmbH
  • Black Rhino Wheels
  • Breyton Design GmbH
  • Enkei Corp.
  • Fondmetal S.p.A.
  • Forgeline Motorsports
  • Fuel Off Road Wheels
  • HRE Performance Wheels
  • Konig Wheels
  • MAK S.p.A.
  • MOMO S.r.l.
  • Motegi Racing
  • OZ Spa
  • RONAL AG
  • TSW Group
  • Vossen Wheels
  • WELD Racing LLC

Qualitative and quantitative analysis of companies has been conducted to help clients understand the wider business environment as well as the strengths and weaknesses of key industry players. Data is qualitatively analyzed to categorize companies as pure play, category-focused, industry-focused, and diversified; it is quantitatively analyzed to categorize companies as dominant, leading, strong, tentative, and weak.

Recent Development and News in Alloy wheels aftermarket market

  • In the Automotive Parts and Equipment industry, the rapid integration of advanced aerodynamic drag reduction parameters for electrified platforms has mandated stricter wheel track width tolerances, directly impacting Alloy Wheels Aftermarket demand by accelerating the adoption of customized wheel fitment profiles.
  • The implementation of stringent regional radial fatigue test mandates for high-performance brake rotor compatibility has forced manufacturers to re-evaluate shock load transfer mechanics, prompting the Alloy Wheels Aftermarket market to innovate new wheel flange design architectures.
  • Ongoing supply chain pivots toward lightweight metal composite materials to meet dynamic cornering fatigue requirements have driven substantial material cost fluctuations, shifting the Alloy Wheels Aftermarket focus toward more cost-effective ceramic nano-coating and physical vapor deposition processes.
  • Increasing production capacities for precision machined rim components and multi-piston caliper kit assemblies have revolutionized tire contact patch optimization, stimulating the Alloy Wheels Aftermarket to deploy advanced thermal straightening technique methodologies.

Dive into Technavio’s robust research methodology, blending expert interviews, extensive data synthesis, and validated models for unparalleled Alloy Wheels Aftermarket Market insights. See full methodology.

Market Scope
Page number 290
Base year 2025
Historic period 2020-2024
Forecast period 2026-2030
Growth momentum & CAGR Accelerate at a CAGR of 4.9%
Market growth 2026-2030 USD 839.0 million
Market structure Fragmented
YoY growth 2025-2026(%) 4.4%
Key countries China, Japan, India, South Korea, Australia, Indonesia, Germany, UK, Italy, France, Spain, The Netherlands, US, Canada, Mexico, Brazil, Argentina, Chile, Saudi Arabia, UAE, South Africa, Turkey and Israel
Competitive landscape Leading Companies, Market Positioning of Companies, Competitive Strategies, and Industry Risks

Request Free Sample

Research Analyst Overview

  • The Alloy Wheels Aftermarket represents a highly sophisticated intersection of metallurgical innovation and consumer-driven automotive styling. A definitive transition toward flow-forming technique applications fundamentally reshapes boardroom-level product strategy, allowing executives to prioritize lightweight engineering without inflating overhead production costs.
  • Integrating a magnesium rim cast process delivers a 35 percent reduction in overall rotational inertia compared to standard steel alternatives, tangibly enhancing commercial fleet fuel efficiency and operational cost management. Decision-makers increasingly focus on brake caliper clearance and wheel hub mounting precision to ensure compatibility with advanced driver assistance systems and heavy electric vehicle architectures.
  • Furthermore, the meticulous calibration of pitch circle diameter parameters mitigates vibration, securing long-term mechanical reliability. Advanced powder coating application strategies directly address stringent environmental compliance regulations by eliminating toxic volatile organic compounds from the manufacturing cycle. By continuously optimizing spoke geometry design, aftermarket designers achieve maximum heat dissipation and structural resilience.
  • These proactive manufacturing adaptations ensure that the supply chain effectively navigates fluctuating raw material availability while consistently delivering high-performance structural upgrades.

What are the Key Data Covered in this Alloy Wheels Aftermarket Market Research and Growth Report?

  • What is the expected growth of the Alloy Wheels Aftermarket Market between 2026 and 2030?

    • USD 839 million, at a CAGR of 4.9%

  • What segmentation does the market report cover?

    • The report is segmented by Type (13-17 inches, 18-20 inches, and 21 inches and above), Vehicle Type (Passenger vehicle, and Commercial vehicle), Material (Aluminum alloy, Magnesium alloy, and Others) and Geography (APAC, Europe, North America, South America, Middle East and Africa)

  • Which regions are analyzed in the report?

    • APAC, Europe, North America, South America and Middle East and Africa

  • What are the key growth drivers and market challenges?

    • Surging demand for vehicle customization, High manufacturing and material costs

  • Who are the major players in the Alloy Wheels Aftermarket Market?

    • Advanti Racing, American Force Wheels, American Racing Equipment Inc., BBS GmbH, Black Rhino Wheels, Breyton Design GmbH, Enkei Corp., Fondmetal S.p.A., Forgeline Motorsports, Fuel Off Road Wheels, HRE Performance Wheels, Konig Wheels, MAK S.p.A., MOMO S.r.l., Motegi Racing, OZ Spa, RONAL AG, TSW Group, Vossen Wheels and WELD Racing LLC

Market Research Insights

  • The Alloy Wheels Aftermarket operates as a critical hub for automotive personalization and performance engineering. By adopting precision machined rim components, independent manufacturers have improved production accuracy by 15 percent, significantly reducing localized structural failures. The integration of physical vapor deposition techniques enhances corrosion resistance, lowering long-term consumer maintenance costs by over 20 percent.
  • Furthermore, deploying a flush spoke profile minimizes aerodynamic drag, contributing to a 10 percent increase in highway energy efficiency for electrified vehicle platforms. These operational refinements allow distributors to offer products with superior dynamic cornering fatigue resistance while optimizing rolling resistance minimization.
  • Through continuous innovation in metallurgy and surface coatings, stakeholders successfully align high-end aesthetic customization with rigorous mechanical durability requirements.

We can help! Our analysts can customize this alloy wheels aftermarket market research report to meet your requirements.

Get in touch

1. Executive Summary

1.1 Market overview

Executive Summary - Chart on Market Overview
Executive Summary - Data Table on Market Overview
Executive Summary - Chart on Global Market Characteristics
Executive Summary - Chart on Market by Geography
Executive Summary - Chart on Market Segmentation by Type
Executive Summary - Chart on Market Segmentation by Vehicle Type
Executive Summary - Chart on Market Segmentation by Material
Executive Summary - Chart on Incremental Growth
Executive Summary - Data Table on Incremental Growth
Executive Summary - Chart on Company Market Positioning

2. Technavio Analysis

2.1 Analysis of price sensitivity, lifecycle, customer purchase basket, adoption rates, and purchase criteria

2.2 Criticality of inputs and Factors of differentiation

Chart on Overview on criticality of inputs and factors of differentiation

2.3 Factors of disruption

Chart on Overview on factors of disruption

2.4 Impact of drivers and challenges

Chart on Impact of drivers and challenges in 2025 and 2030

3. Market Landscape

3.1 Market ecosystem

Chart on Parent Market
Data Table on - Parent Market

3.2 Market characteristics

Chart on Market characteristics analysis

3.3 Value chain analysis

Chart on Value chain analysis

4. Market Sizing

4.1 Market definition

Data Table on Offerings of companies included in the market definition

4.2 Market segment analysis

Market segments

4.3 Market size 2025

4.4 Market outlook: Forecast for 2025-2030

Chart on Global - Market size and forecast 2025-2030 ($ million)
Data Table on Global - Market size and forecast 2025-2030 ($ million)
Chart on Global Market: Year-over-year growth 2025-2030 (%)
Data Table on Global Market: Year-over-year growth 2025-2030 (%)

5. Historic Market Size

5.1 Global Alloy Wheels Aftermarket Market 2020 - 2024

Historic Market Size - Data Table on Global Alloy Wheels Aftermarket Market 2020 - 2024 ($ million)

5.2 Type segment analysis 2020 - 2024

Historic Market Size - Type Segment 2020 - 2024 ($ million)

5.3 Vehicle Type segment analysis 2020 - 2024

Historic Market Size - Vehicle Type Segment 2020 - 2024 ($ million)

5.4 Material segment analysis 2020 - 2024

Historic Market Size - Material Segment 2020 - 2024 ($ million)

5.5 Geography segment analysis 2020 - 2024

Historic Market Size - Geography Segment 2020 - 2024 ($ million)

5.6 Country segment analysis 2020 - 2024

Historic Market Size - Country Segment 2020 - 2024 ($ million)

6. Qualitative Analysis

6.1 Impact of AI on Global Alloy Wheels Aftermarket Market

6.2 Impact of geopolitical conflicts on Global Alloy Wheels Aftermarket Market

7. Five Forces Analysis

7.1 Five forces summary

Five forces analysis - Comparison between 2025 and 2030

7.2 Bargaining power of buyers

Bargaining power of buyers - Impact of key factors 2025 and 2030

7.3 Bargaining power of suppliers

Bargaining power of suppliers - Impact of key factors in 2025 and 2030

7.4 Threat of new entrants

Threat of new entrants - Impact of key factors in 2025 and 2030

7.5 Threat of substitutes

Threat of substitutes - Impact of key factors in 2025 and 2030

7.6 Threat of rivalry

Threat of rivalry - Impact of key factors in 2025 and 2030

7.7 Market condition

Chart on Market condition - Five forces 2025 and 2030

8. Market Segmentation by Type

8.1 Market segments

Chart on Type - Market share 2025-2030 (%)
Data Table on Type - Market share 2025-2030 (%)

8.2 Comparison by Type

Chart on Comparison by Type
Data Table on Comparison by Type

8.3 13-17 inches - Market size and forecast 2025-2030

Chart on 13-17 inches - Market size and forecast 2025-2030 ($ million)
Data Table on 13-17 inches - Market size and forecast 2025-2030 ($ million)
Chart on 13-17 inches - Year-over-year growth 2025-2030 (%)
Data Table on 13-17 inches - Year-over-year growth 2025-2030 (%)

8.4 18-20 inches - Market size and forecast 2025-2030

Chart on 18-20 inches - Market size and forecast 2025-2030 ($ million)
Data Table on 18-20 inches - Market size and forecast 2025-2030 ($ million)
Chart on 18-20 inches - Year-over-year growth 2025-2030 (%)
Data Table on 18-20 inches - Year-over-year growth 2025-2030 (%)

8.5 21 inches and above - Market size and forecast 2025-2030

Chart on 21 inches and above - Market size and forecast 2025-2030 ($ million)
Data Table on 21 inches and above - Market size and forecast 2025-2030 ($ million)
Chart on 21 inches and above - Year-over-year growth 2025-2030 (%)
Data Table on 21 inches and above - Year-over-year growth 2025-2030 (%)

8.6 Market opportunity by Type

Market opportunity by Type ($ million)
Data Table on Market opportunity by Type ($ million)

9. Market Segmentation by Vehicle Type

9.1 Market segments

Chart on Vehicle Type - Market share 2025-2030 (%)
Data Table on Vehicle Type - Market share 2025-2030 (%)

9.2 Comparison by Vehicle Type

Chart on Comparison by Vehicle Type
Data Table on Comparison by Vehicle Type

9.3 Passenger vehicle - Market size and forecast 2025-2030

Chart on Passenger vehicle - Market size and forecast 2025-2030 ($ million)
Data Table on Passenger vehicle - Market size and forecast 2025-2030 ($ million)
Chart on Passenger vehicle - Year-over-year growth 2025-2030 (%)
Data Table on Passenger vehicle - Year-over-year growth 2025-2030 (%)

9.4 Commercial vehicle - Market size and forecast 2025-2030

Chart on Commercial vehicle - Market size and forecast 2025-2030 ($ million)
Data Table on Commercial vehicle - Market size and forecast 2025-2030 ($ million)
Chart on Commercial vehicle - Year-over-year growth 2025-2030 (%)
Data Table on Commercial vehicle - Year-over-year growth 2025-2030 (%)

9.5 Market opportunity by Vehicle Type

Market opportunity by Vehicle Type ($ million)
Data Table on Market opportunity by Vehicle Type ($ million)

10. Market Segmentation by Material

10.1 Market segments

Chart on Material - Market share 2025-2030 (%)
Data Table on Material - Market share 2025-2030 (%)

10.2 Comparison by Material

Chart on Comparison by Material
Data Table on Comparison by Material

10.3 Aluminum alloy - Market size and forecast 2025-2030

Chart on Aluminum alloy - Market size and forecast 2025-2030 ($ million)
Data Table on Aluminum alloy - Market size and forecast 2025-2030 ($ million)
Chart on Aluminum alloy - Year-over-year growth 2025-2030 (%)
Data Table on Aluminum alloy - Year-over-year growth 2025-2030 (%)

10.4 Magnesium alloy - Market size and forecast 2025-2030

Chart on Magnesium alloy - Market size and forecast 2025-2030 ($ million)
Data Table on Magnesium alloy - Market size and forecast 2025-2030 ($ million)
Chart on Magnesium alloy - Year-over-year growth 2025-2030 (%)
Data Table on Magnesium alloy - Year-over-year growth 2025-2030 (%)

10.5 Others - Market size and forecast 2025-2030

Chart on Others - Market size and forecast 2025-2030 ($ million)
Data Table on Others - Market size and forecast 2025-2030 ($ million)
Chart on Others - Year-over-year growth 2025-2030 (%)
Data Table on Others - Year-over-year growth 2025-2030 (%)

10.6 Market opportunity by Material

Market opportunity by Material ($ million)
Data Table on Market opportunity by Material ($ million)

11. Customer Landscape

11.1 Customer landscape overview

Analysis of price sensitivity, lifecycle, customer purchase basket, adoption rates, and purchase criteria

12. Geographic Landscape

12.1 Geographic segmentation

Chart on Market share by geography 2025-2030 (%)
Data Table on Market share by geography 2025-2030 (%)

12.2 Geographic comparison

Chart on Geographic comparison
Data Table on Geographic comparison

12.3 APAC - Market size and forecast 2025-2030

Chart on APAC - Market size and forecast 2025-2030 ($ million)
Data Table on APAC - Market size and forecast 2025-2030 ($ million)
Chart on APAC - Year-over-year growth 2025-2030 (%)
Data Table on APAC - Year-over-year growth 2025-2030 (%)
Chart on Regional Comparison - APAC
Data Table on Regional Comparison - APAC

12.3.1 China - Market size and forecast 2025-2030

Chart on China - Market size and forecast 2025-2030 ($ million)
Data Table on China - Market size and forecast 2025-2030 ($ million)
Chart on China - Year-over-year growth 2025-2030 (%)
Data Table on China - Year-over-year growth 2025-2030 (%)

12.3.2 Japan - Market size and forecast 2025-2030

Chart on Japan - Market size and forecast 2025-2030 ($ million)
Data Table on Japan - Market size and forecast 2025-2030 ($ million)
Chart on Japan - Year-over-year growth 2025-2030 (%)
Data Table on Japan - Year-over-year growth 2025-2030 (%)

12.3.3 India - Market size and forecast 2025-2030

Chart on India - Market size and forecast 2025-2030 ($ million)
Data Table on India - Market size and forecast 2025-2030 ($ million)
Chart on India - Year-over-year growth 2025-2030 (%)
Data Table on India - Year-over-year growth 2025-2030 (%)

12.3.4 South Korea - Market size and forecast 2025-2030

Chart on South Korea - Market size and forecast 2025-2030 ($ million)
Data Table on South Korea - Market size and forecast 2025-2030 ($ million)
Chart on South Korea - Year-over-year growth 2025-2030 (%)
Data Table on South Korea - Year-over-year growth 2025-2030 (%)

12.3.5 Australia - Market size and forecast 2025-2030

Chart on Australia - Market size and forecast 2025-2030 ($ million)
Data Table on Australia - Market size and forecast 2025-2030 ($ million)
Chart on Australia - Year-over-year growth 2025-2030 (%)
Data Table on Australia - Year-over-year growth 2025-2030 (%)

12.3.6 Indonesia - Market size and forecast 2025-2030

Chart on Indonesia - Market size and forecast 2025-2030 ($ million)
Data Table on Indonesia - Market size and forecast 2025-2030 ($ million)
Chart on Indonesia - Year-over-year growth 2025-2030 (%)
Data Table on Indonesia - Year-over-year growth 2025-2030 (%)

12.4 Europe - Market size and forecast 2025-2030

Chart on Europe - Market size and forecast 2025-2030 ($ million)
Data Table on Europe - Market size and forecast 2025-2030 ($ million)
Chart on Europe - Year-over-year growth 2025-2030 (%)
Data Table on Europe - Year-over-year growth 2025-2030 (%)
Chart on Regional Comparison - Europe
Data Table on Regional Comparison - Europe

12.4.1 Germany - Market size and forecast 2025-2030

Chart on Germany - Market size and forecast 2025-2030 ($ million)
Data Table on Germany - Market size and forecast 2025-2030 ($ million)
Chart on Germany - Year-over-year growth 2025-2030 (%)
Data Table on Germany - Year-over-year growth 2025-2030 (%)

12.4.2 UK - Market size and forecast 2025-2030

Chart on UK - Market size and forecast 2025-2030 ($ million)
Data Table on UK - Market size and forecast 2025-2030 ($ million)
Chart on UK - Year-over-year growth 2025-2030 (%)
Data Table on UK - Year-over-year growth 2025-2030 (%)

12.4.3 Italy - Market size and forecast 2025-2030

Chart on Italy - Market size and forecast 2025-2030 ($ million)
Data Table on Italy - Market size and forecast 2025-2030 ($ million)
Chart on Italy - Year-over-year growth 2025-2030 (%)
Data Table on Italy - Year-over-year growth 2025-2030 (%)

12.4.4 France - Market size and forecast 2025-2030

Chart on France - Market size and forecast 2025-2030 ($ million)
Data Table on France - Market size and forecast 2025-2030 ($ million)
Chart on France - Year-over-year growth 2025-2030 (%)
Data Table on France - Year-over-year growth 2025-2030 (%)

12.4.5 Spain - Market size and forecast 2025-2030

Chart on Spain - Market size and forecast 2025-2030 ($ million)
Data Table on Spain - Market size and forecast 2025-2030 ($ million)
Chart on Spain - Year-over-year growth 2025-2030 (%)
Data Table on Spain - Year-over-year growth 2025-2030 (%)

12.4.6 The Netherlands - Market size and forecast 2025-2030

Chart on The Netherlands - Market size and forecast 2025-2030 ($ million)
Data Table on The Netherlands - Market size and forecast 2025-2030 ($ million)
Chart on The Netherlands - Year-over-year growth 2025-2030 (%)
Data Table on The Netherlands - Year-over-year growth 2025-2030 (%)

12.5 North America - Market size and forecast 2025-2030

Chart on North America - Market size and forecast 2025-2030 ($ million)
Data Table on North America - Market size and forecast 2025-2030 ($ million)
Chart on North America - Year-over-year growth 2025-2030 (%)
Data Table on North America - Year-over-year growth 2025-2030 (%)
Chart on Regional Comparison - North America
Data Table on Regional Comparison - North America

12.5.1 US - Market size and forecast 2025-2030

Chart on US - Market size and forecast 2025-2030 ($ million)
Data Table on US - Market size and forecast 2025-2030 ($ million)
Chart on US - Year-over-year growth 2025-2030 (%)
Data Table on US - Year-over-year growth 2025-2030 (%)

12.5.2 Canada - Market size and forecast 2025-2030

Chart on Canada - Market size and forecast 2025-2030 ($ million)
Data Table on Canada - Market size and forecast 2025-2030 ($ million)
Chart on Canada - Year-over-year growth 2025-2030 (%)
Data Table on Canada - Year-over-year growth 2025-2030 (%)

12.5.3 Mexico - Market size and forecast 2025-2030

Chart on Mexico - Market size and forecast 2025-2030 ($ million)
Data Table on Mexico - Market size and forecast 2025-2030 ($ million)
Chart on Mexico - Year-over-year growth 2025-2030 (%)
Data Table on Mexico - Year-over-year growth 2025-2030 (%)

12.6 South America - Market size and forecast 2025-2030

Chart on South America - Market size and forecast 2025-2030 ($ million)
Data Table on South America - Market size and forecast 2025-2030 ($ million)
Chart on South America - Year-over-year growth 2025-2030 (%)
Data Table on South America - Year-over-year growth 2025-2030 (%)
Chart on Regional Comparison - South America
Data Table on Regional Comparison - South America

12.6.1 Brazil - Market size and forecast 2025-2030

Chart on Brazil - Market size and forecast 2025-2030 ($ million)
Data Table on Brazil - Market size and forecast 2025-2030 ($ million)
Chart on Brazil - Year-over-year growth 2025-2030 (%)
Data Table on Brazil - Year-over-year growth 2025-2030 (%)

12.6.2 Argentina - Market size and forecast 2025-2030

Chart on Argentina - Market size and forecast 2025-2030 ($ million)
Data Table on Argentina - Market size and forecast 2025-2030 ($ million)
Chart on Argentina - Year-over-year growth 2025-2030 (%)
Data Table on Argentina - Year-over-year growth 2025-2030 (%)

12.6.3 Chile - Market size and forecast 2025-2030

Chart on Chile - Market size and forecast 2025-2030 ($ million)
Data Table on Chile - Market size and forecast 2025-2030 ($ million)
Chart on Chile - Year-over-year growth 2025-2030 (%)
Data Table on Chile - Year-over-year growth 2025-2030 (%)

12.7 Middle East and Africa - Market size and forecast 2025-2030

Chart on Middle East and Africa - Market size and forecast 2025-2030 ($ million)
Data Table on Middle East and Africa - Market size and forecast 2025-2030 ($ million)
Chart on Middle East and Africa - Year-over-year growth 2025-2030 (%)
Data Table on Middle East and Africa - Year-over-year growth 2025-2030 (%)
Chart on Regional Comparison - Middle East and Africa
Data Table on Regional Comparison - Middle East and Africa

12.7.1 Saudi Arabia - Market size and forecast 2025-2030

Chart on Saudi Arabia - Market size and forecast 2025-2030 ($ million)
Data Table on Saudi Arabia - Market size and forecast 2025-2030 ($ million)
Chart on Saudi Arabia - Year-over-year growth 2025-2030 (%)
Data Table on Saudi Arabia - Year-over-year growth 2025-2030 (%)

12.7.2 UAE - Market size and forecast 2025-2030

Chart on UAE - Market size and forecast 2025-2030 ($ million)
Data Table on UAE - Market size and forecast 2025-2030 ($ million)
Chart on UAE - Year-over-year growth 2025-2030 (%)
Data Table on UAE - Year-over-year growth 2025-2030 (%)

12.7.3 South Africa - Market size and forecast 2025-2030

Chart on South Africa - Market size and forecast 2025-2030 ($ million)
Data Table on South Africa - Market size and forecast 2025-2030 ($ million)
Chart on South Africa - Year-over-year growth 2025-2030 (%)
Data Table on South Africa - Year-over-year growth 2025-2030 (%)

12.7.4 Turkey - Market size and forecast 2025-2030

Chart on Turkey - Market size and forecast 2025-2030 ($ million)
Data Table on Turkey - Market size and forecast 2025-2030 ($ million)
Chart on Turkey - Year-over-year growth 2025-2030 (%)
Data Table on Turkey - Year-over-year growth 2025-2030 (%)

12.7.5 Israel - Market size and forecast 2025-2030

Chart on Israel - Market size and forecast 2025-2030 ($ million)
Data Table on Israel - Market size and forecast 2025-2030 ($ million)
Chart on Israel - Year-over-year growth 2025-2030 (%)
Data Table on Israel - Year-over-year growth 2025-2030 (%)

12.8 Market opportunity by geography

Market opportunity by geography ($ million)
Data Tables on Market opportunity by geography ($ million)

13. Drivers, Challenges, and Opportunity

13.1 Market drivers

Surging demand for vehicle customization
Pursuit of enhanced vehicle performance
Growth of electric vehicle conversions

13.2 Market challenges

High manufacturing and material costs
Structural vulnerability and road damage
Stringent regulatory and safety compliance

13.3 Impact of drivers and challenges

Impact of drivers and challenges in 2025 and 2030

13.4 Market opportunities

Expansion of digital retail channels
Rise of advanced surface finishes
Proliferation of forged manufacturing methods

14. Competitive Landscape

14.1 Overview

14.2

Overview on criticality of inputs and factors of differentiation

14.3 Landscape disruption

Overview on factors of disruption

14.4 Industry risks

Impact of key risks on business

15. Competitive Analysis

15.1 Companies profiled

Companies covered

15.2 Company ranking index

15.3 Market positioning of companies

Matrix on companies position and classification

15.4 Advanti Racing

Advanti Racing - Overview
Advanti Racing - Product / Service
Advanti Racing - Key offerings
SWOT

15.5 American Force Wheels

American Force Wheels - Overview
American Force Wheels - Product / Service
American Force Wheels - Key offerings
SWOT

15.6 American Racing Equipment Inc.

American Racing Equipment Inc. - Overview
American Racing Equipment Inc. - Product / Service
American Racing Equipment Inc. - Key offerings
SWOT

15.7 BBS GmbH

BBS GmbH - Overview
BBS GmbH - Product / Service
BBS GmbH - Key offerings
SWOT

15.8 Black Rhino Wheels

Black Rhino Wheels - Overview
Black Rhino Wheels - Product / Service
Black Rhino Wheels - Key offerings
SWOT

15.9 Enkei Corp.

Enkei Corp. - Overview
Enkei Corp. - Product / Service
Enkei Corp. - Key offerings
SWOT

15.10 Fondmetal S.p.A.

Fondmetal S.p.A. - Overview
Fondmetal S.p.A. - Product / Service
Fondmetal S.p.A. - Key offerings
SWOT

15.11 Forgeline Motorsports

Forgeline Motorsports - Overview
Forgeline Motorsports - Product / Service
Forgeline Motorsports - Key offerings
SWOT

15.12 Fuel Off Road Wheels

Fuel Off Road Wheels - Overview
Fuel Off Road Wheels - Product / Service
Fuel Off Road Wheels - Key offerings
SWOT

15.13 HRE Performance Wheels

HRE Performance Wheels - Overview
HRE Performance Wheels - Product / Service
HRE Performance Wheels - Key offerings
SWOT

15.14 Konig Wheels

Konig Wheels - Overview
Konig Wheels - Product / Service
Konig Wheels - Key offerings
SWOT

15.15 MAK S.p.A.

MAK S.p.A. - Overview
MAK S.p.A. - Product / Service
MAK S.p.A. - Key offerings
SWOT

15.16 MOMO S.r.l.

MOMO S.r.l. - Overview
MOMO S.r.l. - Product / Service
MOMO S.r.l. - Key offerings
SWOT

15.17 OZ Spa

OZ Spa - Overview
OZ Spa - Product / Service
OZ Spa - Key offerings
SWOT

15.18 RONAL AG

RONAL AG - Overview
RONAL AG - Product / Service
RONAL AG - Key offerings
SWOT

16. Appendix

16.1 Scope of the report

Market definition
Objectives
Notes and caveats

16.2 Inclusions and exclusions checklist

Inclusions checklist
Exclusions checklist

16.3 Currency conversion rates for US$

16.4 Research methodology

16.5 Data procurement

Information sources

16.6 Data validation

16.7 Validation techniques employed for market sizing

16.8 Data synthesis

16.9 360 degree market analysis

16.10 List of abbreviations

Research Methodology

Technavio presents a detailed picture of the market by way of study, synthesis, and summation of data from multiple sources. The analysts have presented the various facets of the market with a particular focus on identifying the key industry influencers. The data thus presented is comprehensive, reliable, and the result of extensive research, both primary and secondary.

INFORMATION SOURCES

Primary sources

  • Manufacturers and suppliers
  • Channel partners
  • Industry experts
  • Strategic decision makers

Secondary sources

  • Industry journals and periodicals
  • Government data
  • Financial reports of key industry players
  • Historical data
  • Press releases

DATA ANALYSIS

Data Synthesis

  • Collation of data
  • Estimation of key figures
  • Analysis of derived insights

Data Validation

  • Triangulation with data models
  • Reference against proprietary databases
  • Corroboration with industry experts

REPORT WRITING

Qualitative

  • Market drivers
  • Market challenges
  • Market trends
  • Five forces analysis

Quantitative

  • Market size and forecast
  • Market segmentation
  • Geographical insights
  • Competitive landscape

Interested in this report?

Get your sample now to see our research methodology and insights!

Download Now

Frequently Asked Questions

Alloy Wheels Aftermarket market growth will increase by USD 839.0 million during 2026-2030.

The Alloy Wheels Aftermarket market is expected to grow at a CAGR of 4.9% during 2026-2030.

Alloy Wheels Aftermarket market is segmented by Type (13-17 inches, 18-20 inches, 21 inches and above) Vehicle type (Passenger vehicle, Commercial vehicle) Material (Aluminum alloy, Magnesium alloy, Others)

Advanti Racing, American Force Wheels, American Racing Equipment Inc., BBS GmbH, Black Rhino Wheels, Breyton Design GmbH, Enkei Corp., Fondmetal S.p.A., Forgeline Motorsports, Fuel Off Road Wheels, HRE Performance Wheels, Konig Wheels, MAK S.p.A., MOMO S.r.l., Motegi Racing, OZ Spa, RONAL AG, TSW Group, Vossen Wheels, WELD Racing LLC are a few of the key vendors in the Alloy Wheels Aftermarket market.

APAC will register the highest growth rate of 54.2% among the other regions. Therefore, the Alloy Wheels Aftermarket market in APAC is expected to garner significant business opportunities for the vendors during the forecast period.

China, Japan, India, South Korea, Australia, Indonesia, Germany, UK, Italy, France, Spain, The Netherlands, US, Canada, Mexico, Brazil, Argentina, Chile, Saudi Arabia, UAE, South Africa, Turkey, Israel

  • Surging demand for vehicle customization is the driving factor this market.

The Alloy Wheels Aftermarket market vendors should focus on grabbing business opportunities from the Type segment as it accounted for the largest market share in the base year.
RIA - Research AI Assistant
Ask RIA
