
Magnesium Market Size 2025-2029
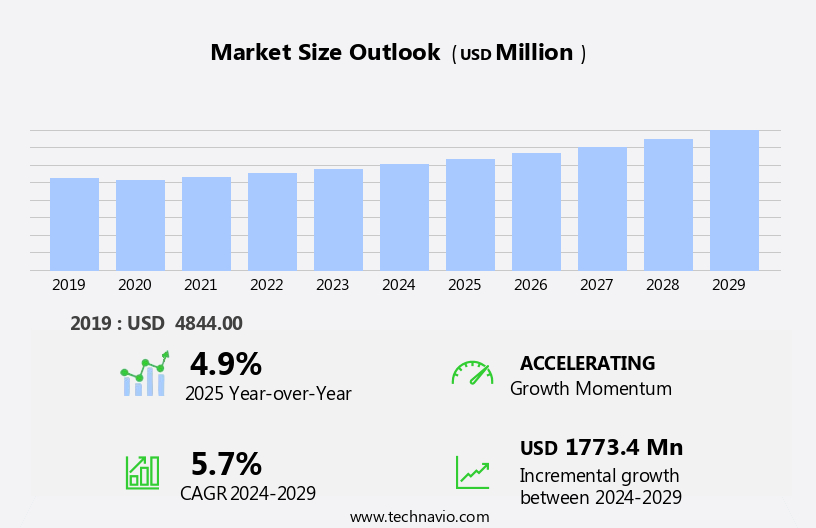
The magnesium market size is forecast to increase by USD 1.77 billion at a CAGR of 5.7% between 2024 and 2029.
- The market is experiencing significant growth due to the high demand for magnesium in various end-use industries, particularly in the automotive and aerospace sectors. The construction industry is also witnessing an increase in the use of magnesium alloys due to their lightweight and high-strength properties. New production facilities in the US and Canada are coming online, increasing the domestic supply of magnesium and reducing dependence on imports. Additionally, the growing use of carbon fiber composites in aerospace manufacturing is further driving this trend, as these materials offer exceptional strength-to-weight ratios. However, the availability of substitutes for magnesium metal, such as aluminum and zinc, poses a challenge to market growth. Producers must focus on improving the efficiency and cost-effectiveness of magnesium production to remain competitive in the market. The application of phosphate coatings on magnesium alloys is becoming more common to improve corrosion resistance, further enhancing the material's appeal. Additionally, research and development efforts are underway to find new applications for magnesium, expanding its market potential. Overall, the market is expected to grow steadily due to its unique properties and increasing demand from various industries.
What will the size of the market be during the forecast period?
- The market has experienced significant growth in recent years, driven by the increasing demand for lightweight components in various industries. Two primary materials contributing to this trend are aluminum alloys and magnesium alloys, which are widely used in die-casting processes. Die casting, a manufacturing process that uses high pressure to force molten metal into a mold is essential in producing complex and precise components. Aluminum alloys and magnesium alloys are popular choices due to their electromagnetic screening property and excellent heat conductivity. These properties make them ideal for use in the automotive and electronics industries, where lightweight and efficient components are crucial.
- The aerospace sector is another significant consumer of magnesium alloys. The high ductility and strength-to-weight ratio of magnesium alloys make them ideal for manufacturing plates and sheets used in aerospace parts. The increasing demand for aircraft deliveries has led to a rising in the usage of magnesium alloys in the aerospace industry. The prices of metals, including magnesium, have been volatile due to various factors, such as supply and demand dynamics and geopolitical tensions. However, the growing demand for magnesium alloys in the automotive and electric vehicle manufacturing sectors is expected to drive the market's growth. The automobile sector's shift towards lightweight materials, including magnesium alloys, is a response to the increasing demand for fuel efficiency and reduced carbon emissions.
How is this market segmented and which is the largest segment?
The market research report provides comprehensive data (region-wise segment analysis), with forecasts and estimates in "USD million" for the period 2025-2029, as well as historical data from 2019-2023 for the following segments.
- Application
- Die castings
- Aluminum alloys
- Iron and steel desulfurization
- Others
- End-user
- Aerospace
- Automotive
- Electronics
- Medical
- Others
- Geography
- APAC
- China
- India
- Japan
- Europe
- Germany
- UK
- North America
- Canada
- US
- South America
- Brazil
- Middle East and Africa
- APAC
By Application Insights
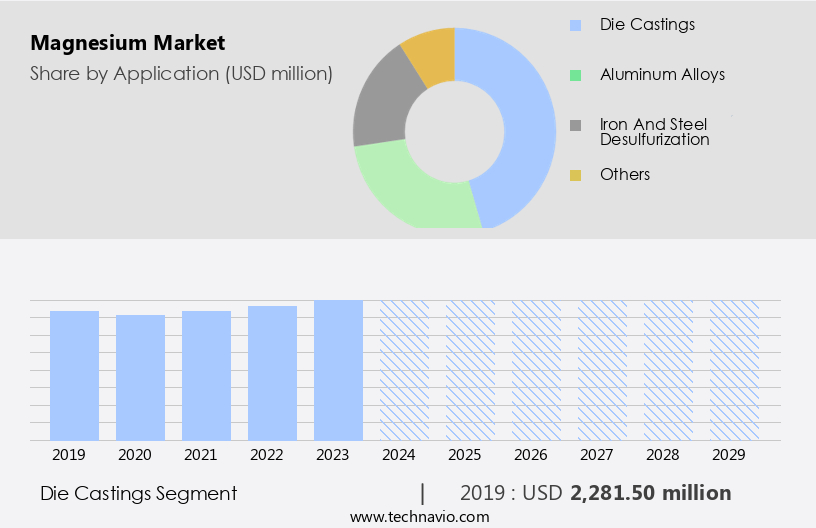
- The die castings segment is estimated to witness significant growth during the forecast period.
Magnesium is a versatile lightweight metal widely used in various industries due to its desirable properties. Its low density, high strength-to-weight ratio, and excellent machinability make it an ideal choice for manufacturing lightweight and durable components. In the die casting process, magnesium's low melting point and good thermal conductivity enable the creation of intricate shapes with minimal post-processing. This property is particularly valuable in sectors such as aerospace and automotive, where weight reduction is crucial for enhancing fuel efficiency and performance. Furthermore, magnesium's resistance to corrosion and ease of machining adds to its appeal to manufacturers seeking affordable ways to produce high-performing parts.
The die casting method, which involves injecting molten magnesium under high pressure into a mold, is a popular process for producing complex and accurate components.
Get a glance at the market report of share of various segments Request Free Sample
The die castings segment was valued at USD 2.28 billion in 2019 and showed a gradual increase during the forecast period.
Regional Analysis
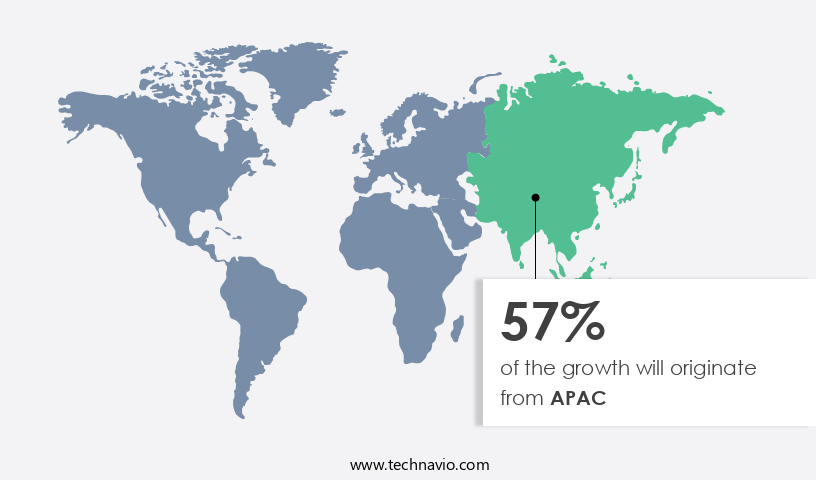
- APAC is estimated to contribute 57% to the growth of the global market during the forecast period.
Technavio's analysts have elaborately explained the regional trends and drivers that shape the market during the forecast period.
For more insights on the market share of various regions, Request Free Sample
The Asia Pacific region is projected to dominate The market, accounting for a significant share and exhibiting the highest growth rate during the forecast period. China, as the world's leading producer and consumer of magnesium, plays a pivotal role in the market's dynamics. However, rising energy costs and stricter environmental regulations have led to the closure of several magnesium production plants in the country. Despite these challenges, China's infrastructure development initiatives, such as the One Belt, One Road, continue to drive demand for magnesium-based materials, particularly aluminum-magnesium alloys and magnesium-based steel desulfurization. The APAC region's growth in the aerospace, automotive, and electronics industries further bolsters the demand for magnesium, contributing to the market's expansion.
Market Dynamics
Our researchers analyzed the data with 2024 as the base year, along with the key drivers, trends, and challenges. A holistic analysis of drivers will help companies refine their marketing strategies to gain a competitive advantage.
What are the key market drivers leading to the rise in the adoption of the Magnesium Market?
High demand for steel from various end-use industries is the key driver of the market.
- Magnesium plays a crucial role in various industries, including Aerospace and Defense, where it is utilized in the production of high-strength-to-weight ratio components for aircraft and spacecraft. In aerospace parts manufacturing, magnesium is used in the production of aluminum alloys, carbon fiber composites, and fiber metal laminates. Its lightweight properties, good chemical stability, and high heat conductivity make it an ideal choice for aircraft, including commercial aircraft, general aviation aircraft, and military aviation. Magnesium is also extensively used in the automotive industry for automotive component manufacturing, particularly in the production of lightweight components such as seat frames, steering columns, and stearing wheels.
- Additionally, it is used in the manufacturing of electric cars and battery-powered EVs due to its high energy efficiency and environmental benefits. In the electronics industry, magnesium is used for its electromagnetic screening property, making it an essential component in the production of electronic portables, laptops, and other electronic devices. Moreover, magnesium is used in industrial processes, such as engine cooling systems, due to its excellent thermal heat capacity and corrosion resistance. The construction process of spacecraft also benefits from magnesium's lightweight properties and high strength, making it a preferred material for spacecraft construction. Furthermore, magnesium is used in the production of household appliances, tools and machinery, and in various other applications where lightweight and high-strength materials are required.
What are the market trends shaping the Magnesium Market?
New production facilities in US and Canada is the upcoming trend in the market.
- Magnesium, a lightweight metal with excellent properties such as a high strength-to-weight ratio, corrosion resistance, and good chemical stability, is extensively used in various industries, including Aerospace and Defense, Automotive and Electronics, and the Construction of Spacecraft. In Aerospace parts manufacturing and production, magnesium is utilized in aircraft, including commercial aircraft and military aviation, due to its lightweight properties and high heat conductivity. Airplanes, helicopters, and engine cooling systems benefit from magnesium's stability and ductility. In the Automotive sector, magnesium is used in the production of automotive components, such as seat frames, steering columns, and steering wheels, due to its high strength-to-weight ratio and machinability.
- Additionally, the growing popularity of electric cars and battery-powered EVs has led to an increase in the use of magnesium in energy storage and energy efficiency applications. Magnesium is also used in various industries, including Household appliances, Industrial processes, and Electronics, due to its electromagnetic properties and electrical automotive applications. The environmental concerns and pollution control norms have led to an increase in the use of magnesium in various applications, such as in the production of aluminum, carbon fiber composites, and fiber metal laminates. Canada and the US are significant producers of magnesium, with Canada expecting an increase in production to reduce dependence on imports from China.
What challenges does the Magnesium Market face during the growth?
The availability of substitutes for magnesium metal is a key challenge affecting the market growth.
- The market confronts substantial competition from alternative materials like aluminum, carbon fiber composites, and high-strength steel in various industries, including aerospace and defense, automotive, and electronics. Aluminum, with its lightweight, corrosion-resistant, and cost-effective properties, is extensively utilized in the aerospace parts manufacturing and aircraft production sectors. Carbon fiber composites, despite being costlier, offer superior strength-to-weight ratios, making them attractive for high-performance applications. High-strength steel, in turn, provides durability and cost benefits, particularly in structural components. The escalating advancements in material science further enhance the performance and reduce the costs of these substitutes, intensifying the competition for magnesium in the market.
- Industries such as commercial aircraft, general aviation aircraft, helicopters, and spacecraft production rely on these materials to meet the growing demands for energy efficiency, environmental concerns, and pollution control norms. Magnesium, however, remains an essential element due to its unique properties, including high ductility, good chemical stability, heat conductivity, electromagnetic property, and electromagnetic screening property. It is used in various applications, including engine cooling systems, battery-powered electric vehicles, household appliances, and portable tools, among others. The market continues to evolve, driven by the increasing demand for lightweight components and materials, the growing popularity of electric cars, and the construction process of spacecraft.
Exclusive Customer Landscape
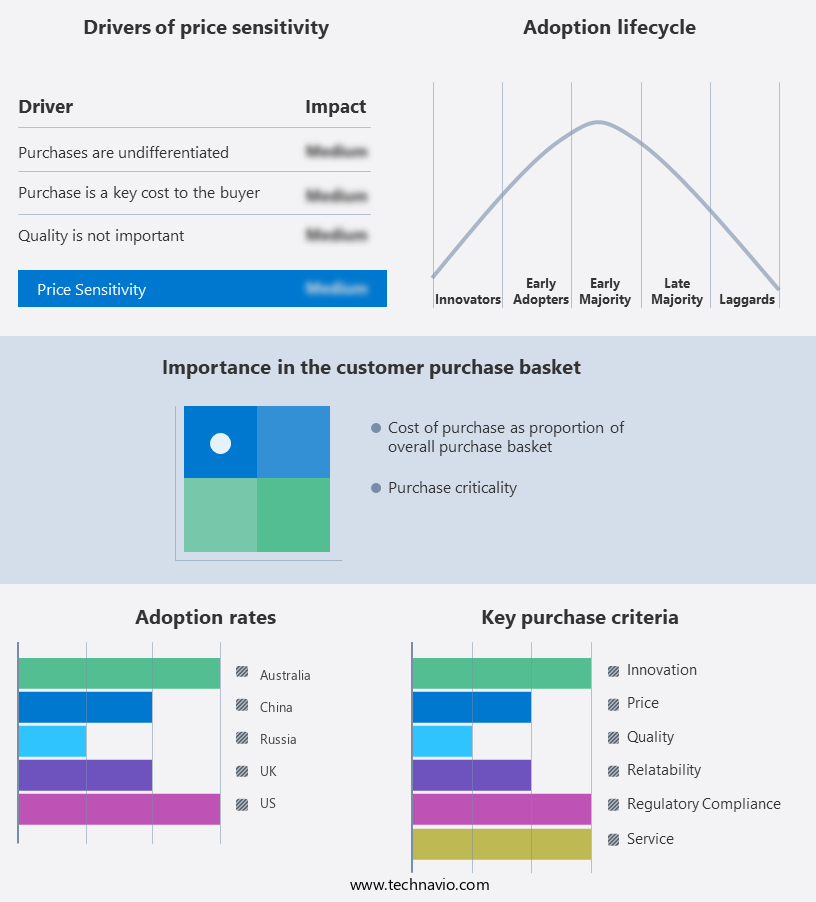
The market forecasting report includes the adoption lifecycle of the market, covering from the innovator's stage to the laggard's stage. It focuses on adoption rates in different regions based on penetration. Furthermore, the market report also includes key purchase criteria and drivers of price sensitivity to help companies evaluate and develop their market growth analysis strategies.
Customer Landscape
Key Companies & Market Insights
Companies are implementing various strategies, such as strategic alliances, market forecast, partnerships, mergers and acquisitions, geographical expansion, and product/service launches, to enhance their presence in the market.
Eczacibasi Holding AS - The company offers magnesium which is used in alloy batteries and in chemical synthesis.
The market research and growth report includes detailed analyses of the competitive landscape of the market and information about key companies, including:
- ICL Group Ltd.
- Latrobe Magnesium Ltd.
- Mag Specialties Inc.
- MAGONTEC Ltd.
- Meridian Lightweight Technologies Inc.
- NIPPON KINZOKU co. ltd.
- POSCO holdings Inc.
- RIMA INDUSTRIAL
- Shaanxi Tianyu Magnesium Group Co. Ltd.
- Shanghai Regal Metal Materials Co. Ltd.
- Shanxi Bada Magnesium Co. Ltd.
- Shanxi Yinguang Huasheng Magnesium Co. Ltd.
- Smiths Metal Centres Ltd.
- Southern Magnesium and Chemicals Ltd.
- Stolfig Leichtbau Kompetenzzentrum GmbH
- Thermo Fisher Scientific Inc.
- Tongxiang Magnesium (Shanghai) Co. Ltd.
- US Magnesium LLC
- VSMPO-AVISMA Corp.
- West High Yield Resources
- Western Magnesium Corp.
Qualitative and quantitative analysis of companies has been conducted to help clients understand the wider business environment as well as the strengths and weaknesses of key market players. Data is qualitatively analyzed to categorize companies as pure play, category-focused, industry-focused, and diversified; it is quantitatively analyzed to categorize companies as dominant, leading, strong, tentative, and weak.
Research Analyst Overview
Magnesium, a lightweight, versatile, and abundant metal, has been gaining significant attention in various industries due to its unique properties. This metal is known for its high strength-to-weight ratio, excellent corrosion resistance, and good chemical stability, making it an ideal choice for manufacturing components in the aerospace, automotive, and electronics industries. The aerospace and defense sector is one of the primary consumers of magnesium. Its lightweight properties make it an essential component in manufacturing aerospace parts, including aircraft frames, engine components, and structural parts.
Moreover, the aerospace parts production process involves die casting, which is a popular method for manufacturing complex shapes with high precision. Magnesium's high thermal conductivity and heat capacity make it an excellent choice for engine cooling systems, ensuring optimal engine performance and fuel efficiency. The automotive industry also heavily relies on magnesium for manufacturing automotive components, particularly in the production of passenger cars and commercial vehicles. The automotive component manufacturing process involves the use of magnesium in various applications, such as engine blocks, cylinder heads, and transmission components. The automotive machinery sector also utilizes magnesium in the production of machinery parts due to its high machinability and low density.
Furthermore, the electric vehicle (EV) segment is another growing market for magnesium. With the increasing focus on energy efficiency and environmental concerns, magnesium's lightweight properties and high strength make it an ideal choice for manufacturing batteries, electric motor components, and other EV parts. Additionally, magnesium's excellent electrical conductivity and electromagnetic screening properties make it a popular choice in the electronics industry for manufacturing electronic portables, laptops, and other electronic devices. Magnesium's applications extend beyond the industrial sector. In the construction process, fiber metal laminates and magnesium plates and sheets are used to create lightweight and durable structures. The construction of spacecraft also relies on magnesium for its high strength-to-weight ratio and excellent stability.
|
Market Scope |
|
|
Report Coverage |
Details |
|
Page number |
210 |
|
Base year |
2024 |
|
Historic period |
2019-2023 |
|
Forecast period |
2025-2029 |
|
Growth momentum & CAGR |
Accelerate at a CAGR of 5.7% |
|
Market Growth 2025-2029 |
USD 1.77 billion |
|
Market structure |
Fragmented |
|
YoY growth 2024-2025(%) |
4.9 |
|
Key countries |
China, US, Russia, Australia, UK, India, Germany, Canada, Japan, and Brazil |
|
Competitive landscape |
Leading Companies, Market Positioning of Companies, Competitive Strategies, and Industry Risks |
What are the Key Data Covered in this Market Research and Growth Report?
- CAGR of the market during the forecast period
- Detailed information on factors that will drive the market growth and forecasting between 2025 and 2029
- Precise estimation of the size of the market and its contribution of the market in focus to the parent market
- Accurate predictions about upcoming market growth and trends and changes in consumer behaviour
- Growth of the market across APAC, Europe, North America, South America, and Middle East and Africa
- Thorough analysis of the market's competitive landscape and detailed information about companies
- Comprehensive analysis of factors that will challenge the growth of market companies
We can help! Our analysts can customize this market research report to meet your requirements. Get in touch
 RIA -
RIA - 
