Aluminum Market Analysis, Size, and Forecast 2026-2030: APAC (China, India, and Japan), Europe (Germany, Italy, and France), North America (US, Canada, and Mexico), Middle East and Africa (Saudi Arabia, South Africa, and UAE), South America (Brazil, Argentina, and Colombia), and Rest of World (ROW)

Aluminum Market Analysis, Size, and Forecast 2026-2030:
APAC (China, India, and Japan), Europe (Germany, Italy, and France), North America (US, Canada, and Mexico), Middle East and Africa (Saudi Arabia, South Africa, and UAE), South America (Brazil, Argentina, and Colombia), and Rest of World (ROW)

Published: Apr 2026 306 Pages SKU: IRTNTR45051

Market Overview at a Glance

$45.99 B
Market Opportunity
4.1%
CAGR 2025 - 2030
64.7%
APAC Growth
$57.77 B
Transportation segment 2024

Aluminum Market Size 2026-2030

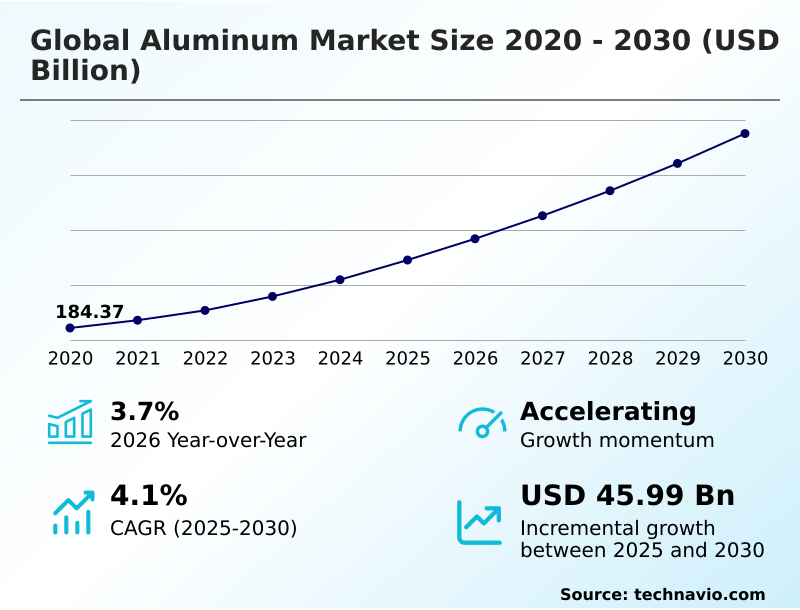
The aluminum market size is valued to increase by USD 45.99 billion, at a CAGR of 4.1% from 2025 to 2030. Proliferation of electric vehicle adoption and automotive lightweighting will drive the aluminum market.

Major Market Trends & Insights

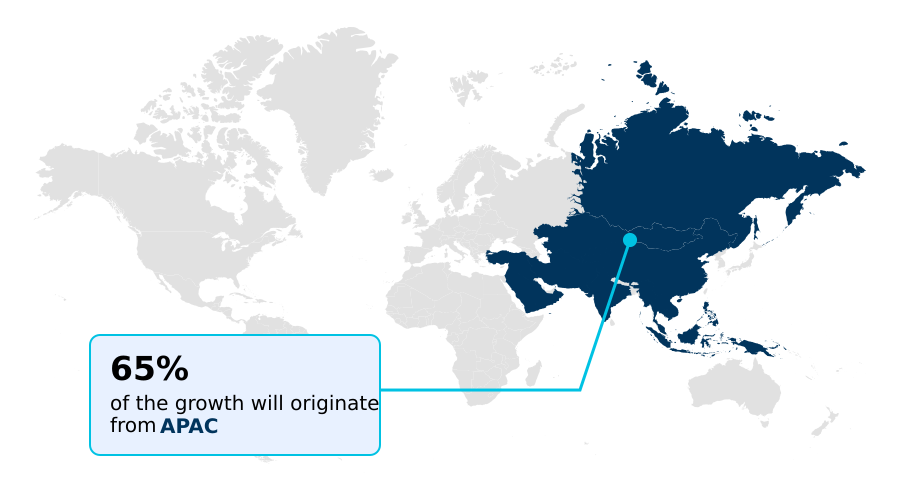
  • APAC dominated the market and accounted for a 64.7% growth during the forecast period.
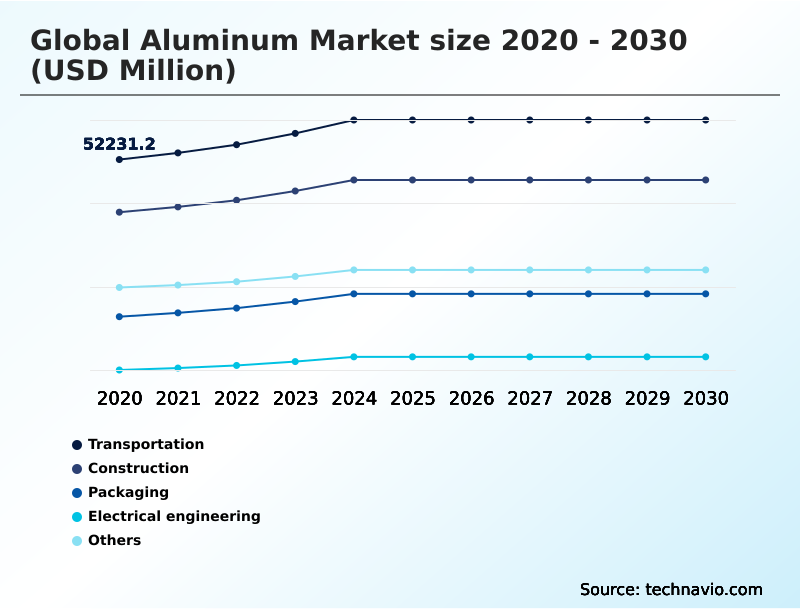
  • By End-user - Transportation segment was valued at USD 57.77 billion in 2024
  • By Type - Primary aluminum segment accounted for the largest market revenue share in 2024

Market Size & Forecast

  • Market Opportunities: USD 70.71 billion
  • Market Future Opportunities: USD 45.99 billion
  • CAGR from 2025 to 2030 : 4.1%

Market Summary

  • The aluminum market is undergoing a significant transformation, driven by the dual imperatives of technological innovation and sustainability. The demand for lightweight, high-strength materials in the automotive sector, particularly for electric vehicles, is a primary catalyst for growth. Concurrently, the aerospace and packaging industries continue to rely on aluminum for its unique properties.
  • A key dynamic is the industry-wide push toward decarbonization, with producers investing in renewable energy sources and advanced recycling technologies to reduce their carbon footprint. For instance, a downstream manufacturer might now select a supplier not just on price but based on a verifiable low-carbon production certificate, a decision that impacts the entire supply chain.
  • This shift toward a circular economy, where scrap is a valuable resource, is reshaping sourcing strategies and operational models. The market is also navigating challenges related to energy costs and geopolitical trade policies, which add layers of complexity to supply chain management and long-term investment planning.
  • The ability to innovate in both production processes and alloy development will be crucial for maintaining a competitive edge.

What will be the Size of the Aluminum Market during the forecast period?

Get Key Insights on Market Forecast (PDF) Get Free Sample

How is the Aluminum Market Segmented?

The aluminum industry research report provides comprehensive data (region-wise segment analysis), with forecasts and estimates in "USD million" for the period 2026-2030, as well as historical data from 2020-2024 for the following segments.

  • End-user
    • Transportation
    • Construction
    • Packaging
    • Electrical engineering
    • Others
  • Type
    • Primary aluminum
    • Secondary aluminum
  • Technology
    • Extrusion
    • Casting
    • Rolling
    • Others
  • Geography
    • APAC
      • China
      • India
      • Japan
    • Europe
      • Germany
      • Italy
      • France
    • North America
      • US
      • Canada
      • Mexico
    • Middle East and Africa
      • Saudi Arabia
      • South Africa
      • UAE
    • South America
      • Brazil
      • Argentina
      • Colombia
    • Rest of World (ROW)

By End-user Insights

The transportation segment is estimated to witness significant growth during the forecast period.

The transportation segment remains a primary end-user, with automotive lightweighting initiatives driving substantial consumption. The shift to electric vehicles necessitates high-strength aluminum for structural frame components and vehicle battery enclosures to offset battery weight and improve range.

Advanced manufacturing techniques in the automotive sector, including high-pressure die casting, have increased aluminum use per vehicle, with global car sales growing 2.5 percent.

This trend, coupled with the need for corrosion resistant alloys and high strength-to-weight ratio materials, solidifies the segment's role.

Sustainable aluminum solutions and the decarbonization of industry further reinforce the material's strategic importance in modern vehicle engineering, demanding continuous aluminum alloy development to meet performance standards.

Get Free Sample

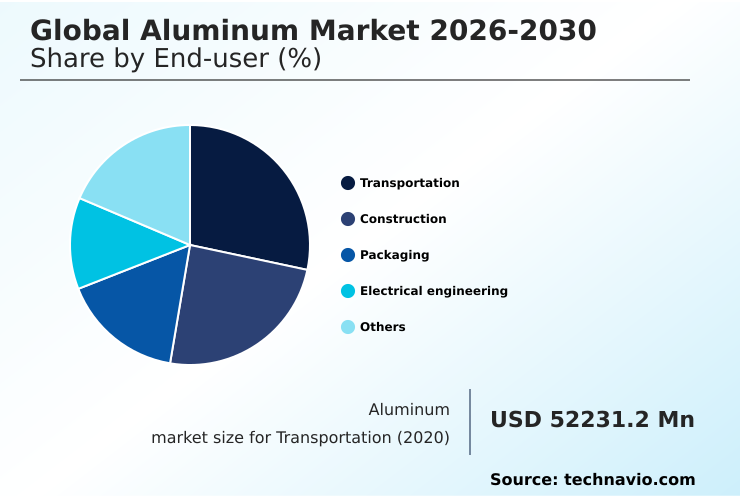
The Transportation segment was valued at USD 57.77 billion in 2024 and showed a gradual increase during the forecast period.

Get Free Sample

Regional Analysis

APAC is estimated to contribute 64.7% to the growth of the global market during the forecast period.Technavio’s analysts have elaborately explained the regional trends and drivers that shape the market during the forecast period.

See How Aluminum Market Demand is Rising in APAC Get Free Sample

The geographic landscape of the aluminum market is dominated by the APAC region, which accounts for over 64% of the market's incremental growth. This expansion is fueled by rapid industrialization, robust infrastructure development, and a burgeoning automotive manufacturing sector.

Countries like China and India are at the forefront, driven by domestic demand for construction, transportation, and packaging materials. A notable trend is the region's increasing focus on producing high-value and sustainable aluminum solutions.

For instance, the number of automotive suppliers in Vietnam obtaining IATF 16949 certification recently surpassed 900, signaling a strategic move toward meeting stringent global quality standards. This commitment enhances the region's role in the global supply chain for high-performance applications.

The integration of renewable energy sources into smelting operations is also gaining traction, aligning with the global demand for materials with a reduced carbon footprint, which is a key factor in geopolitical supply chain risk.

Market Dynamics

Our researchers analyzed the data with 2025 as the base year, along with the key drivers, trends, and challenges. A holistic analysis of drivers will help companies refine their marketing strategies to gain a competitive advantage.

  • The global aluminum market 2026-2030 is increasingly shaped by strategic decisions around capital investment in smelter modernization and the mitigation of geopolitical risk in bauxite supply. The financial commitment required for transitioning from legacy systems to inert anode or hydrogen-based smelting is substantial, creating a competitive divide between well-capitalized producers and smaller players.
  • This transition is essential for achieving low-carbon aluminum production methods, which are becoming a prerequisite for market access in environmentally sensitive sectors. Concurrently, the industry is exploring the comparative performance of aluminum vs steel in automotive applications, with a focus on lifecycle emissions and recyclability.
  • The implementation of a carbon border tax on aluminum further complicates trade flows, incentivizing regionalized supply chains and investments in advanced scrap sorting for alloys. The role of AI in aluminum smelting operations is also expanding, offering pathways to optimize energy efficiency in primary smelting and improve process control.
  • This technological adoption, coupled with a deeper understanding of the circular economy in aluminum packaging, is critical for future competitiveness. For example, while the initial outlay for advanced sorting infrastructure is high, it unlocks the potential to produce high-grade secondary aluminum, a process that consumes a fraction of the energy required for primary production, thereby improving long-term operational margins.

What are the key market drivers leading to the rise in the adoption of Aluminum Industry?

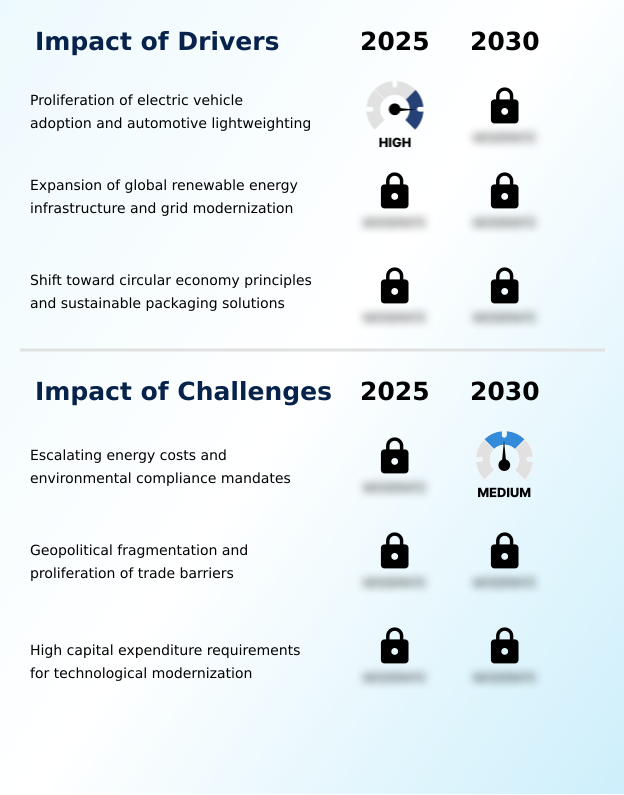
  • The proliferation of electric vehicle adoption and the associated push for automotive lightweighting are key drivers stimulating demand for advanced aluminum alloys.

  • The global aluminum market 2026-2030 is propelled by strong demand from the automotive and energy sectors. The transition to electric vehicles is a significant driver, as automotive lightweighting with high-strength aluminum is critical for improving efficiency and battery range.
  • This has spurred advancements in rolled aluminum products and architectural aluminum systems for vehicle battery enclosures. Simultaneously, the expansion of renewable energy infrastructure relies on aluminum for its durability and cost-effectiveness.
  • For instance, the use of advanced aluminum composite core conductors in new grid projects has increased energy efficiency by 20% over conventional materials.
  • This push for electrification and the need for heat exchanger materials in green technologies create a stable demand base. The principles of the circular economy and sustainable packaging solutions also bolster the market, promoting secondary aluminum recycling.

What are the market trends shaping the Aluminum Industry?

  • The ascendancy of low-carbon aluminum is reshaping the market, driven by consumer demand and the implementation of carbon border adjustment policies. This shift is compelling producers to adopt sustainable manufacturing practices.

  • Key trends are reshaping the global aluminum market 2026-2030, led by the imperative for decarbonization of industry. This is fueling the demand for low-carbon aluminum, with producers leveraging renewable energy integration to reduce the carbon footprint of energy-intensive smelting operations. The implementation of carbon border adjustment policies is creating a premium for sustainable aluminum solutions.
  • Technologically, the adoption of AI and advanced robotics is optimizing production, with some automated facilities achieving up to a 15% improvement in process consistency. This technological modernization enhances smelting energy efficiency. Furthermore, the industry is expanding closed-loop recycling systems and investing in advanced scrap sorting infrastructure to improve circular material flow.
  • These efforts in primary aluminum production reflect a market-wide shift toward sustainability.

What challenges does the Aluminum Industry face during its growth?

  • Escalating energy costs and the imperative to comply with stringent environmental mandates present a significant challenge to profitability and operational stability in aluminum production.

  • The global aluminum market 2026-2030 faces significant hurdles, primarily from high capital expenditure requirements and escalating energy costs. Modernizing aging smelting facilities and adopting breakthrough inert anode technology demand massive investment, with project costs often exceeding initial estimates by 15-20%. These financial pressures are compounded by volatile electricity prices, which directly impact the profitability of primary aluminum production.
  • Geopolitical fragmentation and the proliferation of protectionist trade policies disrupt established supply chains for bauxite and alumina, creating uncertainty and forcing companies to diversify sourcing strategies. Additionally, stringent environmental compliance mandates and the high cost of carbon tracking mechanisms add another layer of complexity.
  • This challenging environment requires companies to focus on operational efficiency, risk management, and strategic investments in less energy-intensive secondary production to remain competitive.

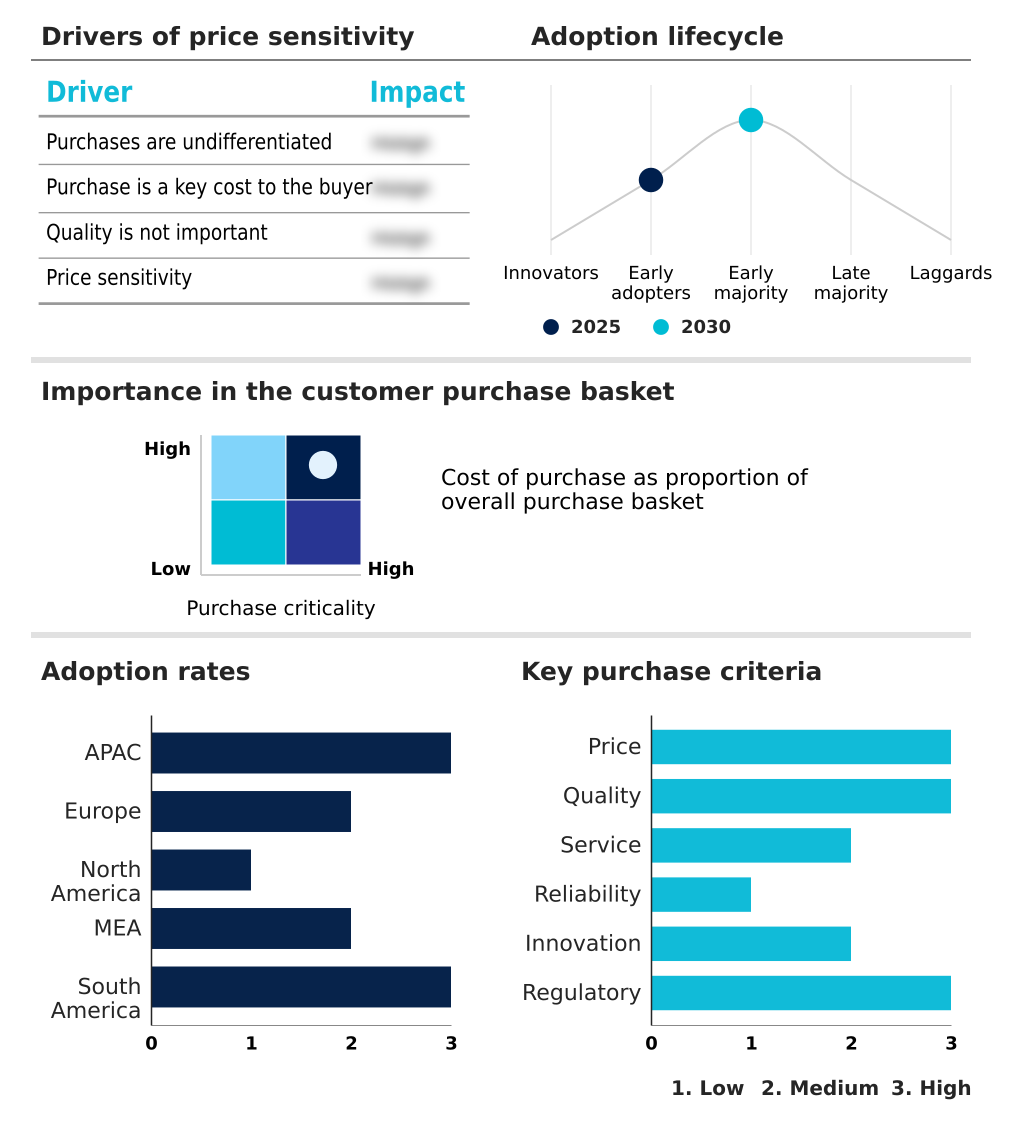
Exclusive Technavio Analysis on Customer Landscape

The aluminum market forecasting report includes the adoption lifecycle of the market, covering from the innovator’s stage to the laggard’s stage. It focuses on adoption rates in different regions based on penetration. Furthermore, the aluminum market report also includes key purchase criteria and drivers of price sensitivity to help companies evaluate and develop their market growth analysis strategies.

Customer Landscape of Aluminum Industry

Competitive Landscape

Companies are implementing various strategies, such as strategic alliances, aluminum market forecast, partnerships, mergers and acquisitions, geographical expansion, and product/service launches, to enhance their presence in the industry.

Alcoa Corp. - Analysis indicates a portfolio of primary aluminum, alumina, and bauxite products, targeting critical aerospace, automotive, and industrial applications through vertically integrated operations.

The industry research and growth report includes detailed analyses of the competitive landscape of the market and information about key companies, including:

  • Alcoa Corp.
  • Aluminium Bahrain BSC
  • Aluminum Corp. of China Ltd.
  • Arconic Corp.
  • Bonnell Aluminum Inc.
  • Century Aluminum Co.
  • China Hongqiao Group Ltd.
  • Constellium SE
  • Granges AB
  • Hindalco Industries
  • Hubei Xingfa Chemicals Group
  • Jindal Aluminium Ltd.
  • Kaiser Aluminum Corp.
  • National Aluminium Co. Ltd.
  • Norsk Hydro ASA
  • Rio Tinto Ltd.
  • Saudi Arabian Mining Co.
  • UACJ Corp.
  • United Co. RUSAL
  • Vedanta Ltd.

Qualitative and quantitative analysis of companies has been conducted to help clients understand the wider business environment as well as the strengths and weaknesses of key industry players. Data is qualitatively analyzed to categorize companies as pure play, category-focused, industry-focused, and diversified; it is quantitatively analyzed to categorize companies as dominant, leading, strong, tentative, and weak.

Recent Development and News in Aluminum market

  • In August 2025, Ball Corp. announced a 4.1 percent year-over-year increase in aluminum packaging shipments for the second quarter, highlighting growing demand for sustainable aluminum products.
  • In January 2025, Rio Tinto and Norsk Hydro announced a strategic partnership, committing to invest approximately $45 million over five years to develop and test carbon capture technologies for existing smelters.
  • In March 2025, Norsk Hydro ASA initiated construction of a new aluminum recycling plant in Torija, Spain, designed to produce 120,000 metric tons of low-carbon extrusion ingot annually from post-consumer scrap.
  • In May 2025, Emirates Global Aluminum announced its intention to construct a new primary aluminum smelter in the United States, the first of its kind in the country in several decades.

Dive into Technavio’s robust research methodology, blending expert interviews, extensive data synthesis, and validated models for unparalleled Aluminum Market insights. See full methodology.

Market Scope
Page number 306
Base year 2025
Historic period 2020-2024
Forecast period 2026-2030
Growth momentum & CAGR Accelerate at a CAGR of 4.1%
Market growth 2026-2030 USD 45994.1 million
Market structure Fragmented
YoY growth 2025-2026(%) 3.7%
Key countries China, India, Japan, South Korea, Australia, Indonesia, Germany, Italy, France, UK, Spain, Poland, US, Canada, Mexico, Saudi Arabia, South Africa, UAE, Egypt, Turkey, Brazil, Argentina and Colombia
Competitive landscape Leading Companies, Market Positioning of Companies, Competitive Strategies, and Industry Risks

Request Free Sample

Research Analyst Overview

  • The aluminum market is advancing through a period of structural change, driven by the imperative for primary aluminum production to become more sustainable. Investment in bauxite refining and alumina smelting is now closely tied to environmental performance, compelling firms to innovate.
  • Key operational processes like molten metal processing and extrusion die technology are being optimized for energy efficiency and material throughput. The development of advanced casting techniques is crucial for serving the automotive sector's demand for complex, lightweight components.
  • A major focus is on secondary aluminum recycling, as it consumes approximately 95% less energy than primary production, directly impacting bottom-line profitability and aligning with circular economy principles. This makes investments in scrap sorting technology and beverage can recycling infrastructure a boardroom-level priority.
  • Furthermore, the push for low-carbon aluminum and green aluminum production is transforming supply chains, with anodized surface treatment and other finishing processes also being evaluated for their environmental impact. The development of specialized aerospace grade alloys and materials for heat exchangers continues to drive research and development efforts across the industry.

What are the Key Data Covered in this Aluminum Market Research and Growth Report?

  • What is the expected growth of the Aluminum Market between 2026 and 2030?

    • USD 45.99 billion, at a CAGR of 4.1%

  • What segmentation does the market report cover?

    • The report is segmented by End-user (Transportation, Construction, Packaging, Electrical engineering, and Others), Type (Primary aluminum, and Secondary aluminum), Technology (Extrusion, Casting, Rolling, and Others) and Geography (APAC, Europe, North America, Middle East and Africa, South America)

  • Which regions are analyzed in the report?

    • APAC, Europe, North America, Middle East and Africa and South America

  • What are the key growth drivers and market challenges?

    • Proliferation of electric vehicle adoption and automotive lightweighting, Escalating energy costs and environmental compliance mandates

  • Who are the major players in the Aluminum Market?

    • Alcoa Corp., Aluminium Bahrain BSC, Aluminum Corp. of China Ltd., Arconic Corp., Bonnell Aluminum Inc., Century Aluminum Co., China Hongqiao Group Ltd., Constellium SE, Granges AB, Hindalco Industries, Hubei Xingfa Chemicals Group, Jindal Aluminium Ltd., Kaiser Aluminum Corp., National Aluminium Co. Ltd., Norsk Hydro ASA, Rio Tinto Ltd., Saudi Arabian Mining Co., UACJ Corp., United Co. RUSAL and Vedanta Ltd.

Market Research Insights

  • The aluminum market is defined by a dynamic interplay of economic and environmental factors. The push for decarbonization has made secondary aluminum, which uses 95% less energy than primary production, a strategic priority. This focus on a circular material flow drives investment in closed-loop recycling systems and advanced sorting technologies, improving resource efficiency.
  • Concurrently, the expansion of clean energy infrastructure creates significant demand; for example, advanced aluminum composite core conductors have demonstrated the ability to increase grid energy efficiency by twenty percent over traditional materials. Downstream aluminum processing capabilities are being enhanced to produce high-performance materials for automotive structural components, where lightweighting is critical.
  • However, the industry grapples with geopolitical supply chain risk and volatile energy prices, necessitating robust supply chain diversification and risk management strategies to ensure stability.

We can help! Our analysts can customize this aluminum market research report to meet your requirements.

Get in touch

1. Executive Summary

1.1 Market overview

Executive Summary - Chart on Market Overview
Executive Summary - Data Table on Market Overview
Executive Summary - Chart on Global Market Characteristics
Executive Summary - Chart on Market by Geography
Executive Summary - Chart on Market Segmentation by End-user
Executive Summary - Chart on Market Segmentation by Type
Executive Summary - Chart on Market Segmentation by Technology
Executive Summary - Chart on Incremental Growth
Executive Summary - Data Table on Incremental Growth
Executive Summary - Chart on Company Market Positioning

2. Technavio Analysis

2.1 Analysis of price sensitivity, lifecycle, customer purchase basket, adoption rates, and purchase criteria

2.2 Criticality of inputs and Factors of differentiation

Chart on Overview on criticality of inputs and factors of differentiation

2.3 Factors of disruption

Chart on Overview on factors of disruption

2.4 Impact of drivers and challenges

Chart on Impact of drivers and challenges in 2025 and 2030

3. Market Landscape

3.1 Market ecosystem

Chart on Parent Market
Data Table on - Parent Market

3.2 Market characteristics

Chart on Market characteristics analysis

3.3 Value chain analysis

Chart on Value chain analysis

4. Market Sizing

4.1 Market definition

Data Table on Offerings of companies included in the market definition

4.2 Market segment analysis

Market segments

4.3 Market size 2025

4.4 Market outlook: Forecast for 2025-2030

Chart on Global - Market size and forecast 2025-2030 ($ million)
Data Table on Global - Market size and forecast 2025-2030 ($ million)
Chart on Global Market: Year-over-year growth 2025-2030 (%)
Data Table on Global Market: Year-over-year growth 2025-2030 (%)

5. Historic Market Size

5.1 Global Aluminum Market 2020 - 2024

Historic Market Size - Data Table on Global Aluminum Market 2020 - 2024 ($ million)

5.2 End-user segment analysis 2020 - 2024

Historic Market Size - End-user Segment 2020 - 2024 ($ million)

5.3 Type segment analysis 2020 - 2024

Historic Market Size - Type Segment 2020 - 2024 ($ million)

5.4 Technology segment analysis 2020 - 2024

Historic Market Size - Technology Segment 2020 - 2024 ($ million)

5.5 Geography segment analysis 2020 - 2024

Historic Market Size - Geography Segment 2020 - 2024 ($ million)

5.6 Country segment analysis 2020 - 2024

Historic Market Size - Country Segment 2020 - 2024 ($ million)

6. Qualitative Analysis

6.1 Impact of AI on Global Aluminum Market

6.2 Impact of Geopolitical Conflict on Global Aluminum Market

7. Five Forces Analysis

7.1 Five forces summary

Five forces analysis - Comparison between 2025 and 2030

7.2 Bargaining power of buyers

Bargaining power of buyers - Impact of key factors 2025 and 2030

7.3 Bargaining power of suppliers

Bargaining power of suppliers - Impact of key factors in 2025 and 2030

7.4 Threat of new entrants

Threat of new entrants - Impact of key factors in 2025 and 2030

7.5 Threat of substitutes

Threat of substitutes - Impact of key factors in 2025 and 2030

7.6 Threat of rivalry

Threat of rivalry - Impact of key factors in 2025 and 2030

7.7 Market condition

Chart on Market condition - Five forces 2025 and 2030

8. Market Segmentation by End-user

8.1 Market segments

Chart on End-user - Market share 2025-2030 (%)
Data Table on End-user - Market share 2025-2030 (%)

8.2 Comparison by End-user

Chart on Comparison by End-user
Data Table on Comparison by End-user

8.3 Transportation - Market size and forecast 2025-2030

Chart on Transportation - Market size and forecast 2025-2030 ($ million)
Data Table on Transportation - Market size and forecast 2025-2030 ($ million)
Chart on Transportation - Year-over-year growth 2025-2030 (%)
Data Table on Transportation - Year-over-year growth 2025-2030 (%)

8.4 Construction - Market size and forecast 2025-2030

Chart on Construction - Market size and forecast 2025-2030 ($ million)
Data Table on Construction - Market size and forecast 2025-2030 ($ million)
Chart on Construction - Year-over-year growth 2025-2030 (%)
Data Table on Construction - Year-over-year growth 2025-2030 (%)

8.5 Packaging - Market size and forecast 2025-2030

Chart on Packaging - Market size and forecast 2025-2030 ($ million)
Data Table on Packaging - Market size and forecast 2025-2030 ($ million)
Chart on Packaging - Year-over-year growth 2025-2030 (%)
Data Table on Packaging - Year-over-year growth 2025-2030 (%)

8.6 Electrical engineering - Market size and forecast 2025-2030

Chart on Electrical engineering - Market size and forecast 2025-2030 ($ million)
Data Table on Electrical engineering - Market size and forecast 2025-2030 ($ million)
Chart on Electrical engineering - Year-over-year growth 2025-2030 (%)
Data Table on Electrical engineering - Year-over-year growth 2025-2030 (%)

8.7 Others - Market size and forecast 2025-2030

Chart on Others - Market size and forecast 2025-2030 ($ million)
Data Table on Others - Market size and forecast 2025-2030 ($ million)
Chart on Others - Year-over-year growth 2025-2030 (%)
Data Table on Others - Year-over-year growth 2025-2030 (%)

8.8 Market opportunity by End-user

Market opportunity by End-user ($ million)
Data Table on Market opportunity by End-user ($ million)

9. Market Segmentation by Type

9.1 Market segments

Chart on Type - Market share 2025-2030 (%)
Data Table on Type - Market share 2025-2030 (%)

9.2 Comparison by Type

Chart on Comparison by Type
Data Table on Comparison by Type

9.3 Primary aluminum - Market size and forecast 2025-2030

Chart on Primary aluminum - Market size and forecast 2025-2030 ($ million)
Data Table on Primary aluminum - Market size and forecast 2025-2030 ($ million)
Chart on Primary aluminum - Year-over-year growth 2025-2030 (%)
Data Table on Primary aluminum - Year-over-year growth 2025-2030 (%)

9.4 Secondary aluminum - Market size and forecast 2025-2030

Chart on Secondary aluminum - Market size and forecast 2025-2030 ($ million)
Data Table on Secondary aluminum - Market size and forecast 2025-2030 ($ million)
Chart on Secondary aluminum - Year-over-year growth 2025-2030 (%)
Data Table on Secondary aluminum - Year-over-year growth 2025-2030 (%)

9.5 Market opportunity by Type

Market opportunity by Type ($ million)
Data Table on Market opportunity by Type ($ million)

10. Market Segmentation by Technology

10.1 Market segments

Chart on Technology - Market share 2025-2030 (%)
Data Table on Technology - Market share 2025-2030 (%)

10.2 Comparison by Technology

Chart on Comparison by Technology
Data Table on Comparison by Technology

10.3 Extrusion - Market size and forecast 2025-2030

Chart on Extrusion - Market size and forecast 2025-2030 ($ million)
Data Table on Extrusion - Market size and forecast 2025-2030 ($ million)
Chart on Extrusion - Year-over-year growth 2025-2030 (%)
Data Table on Extrusion - Year-over-year growth 2025-2030 (%)

10.4 Casting - Market size and forecast 2025-2030

Chart on Casting - Market size and forecast 2025-2030 ($ million)
Data Table on Casting - Market size and forecast 2025-2030 ($ million)
Chart on Casting - Year-over-year growth 2025-2030 (%)
Data Table on Casting - Year-over-year growth 2025-2030 (%)

10.5 Rolling - Market size and forecast 2025-2030

Chart on Rolling - Market size and forecast 2025-2030 ($ million)
Data Table on Rolling - Market size and forecast 2025-2030 ($ million)
Chart on Rolling - Year-over-year growth 2025-2030 (%)
Data Table on Rolling - Year-over-year growth 2025-2030 (%)

10.6 Others - Market size and forecast 2025-2030

Chart on Others - Market size and forecast 2025-2030 ($ million)
Data Table on Others - Market size and forecast 2025-2030 ($ million)
Chart on Others - Year-over-year growth 2025-2030 (%)
Data Table on Others - Year-over-year growth 2025-2030 (%)

10.7 Market opportunity by Technology

Market opportunity by Technology ($ million)
Data Table on Market opportunity by Technology ($ million)

11. Customer Landscape

11.1 Customer landscape overview

Analysis of price sensitivity, lifecycle, customer purchase basket, adoption rates, and purchase criteria

12. Geographic Landscape

12.1 Geographic segmentation

Chart on Market share by geography 2025-2030 (%)
Data Table on Market share by geography 2025-2030 (%)

12.2 Geographic comparison

Chart on Geographic comparison
Data Table on Geographic comparison

12.3 APAC - Market size and forecast 2025-2030

Chart on APAC - Market size and forecast 2025-2030 ($ million)
Data Table on APAC - Market size and forecast 2025-2030 ($ million)
Chart on APAC - Year-over-year growth 2025-2030 (%)
Data Table on APAC - Year-over-year growth 2025-2030 (%)
Chart on Regional Comparison - APAC
Data Table on Regional Comparison - APAC

12.3.1 China - Market size and forecast 2025-2030

Chart on China - Market size and forecast 2025-2030 ($ million)
Data Table on China - Market size and forecast 2025-2030 ($ million)
Chart on China - Year-over-year growth 2025-2030 (%)
Data Table on China - Year-over-year growth 2025-2030 (%)

12.3.2 India - Market size and forecast 2025-2030

Chart on India - Market size and forecast 2025-2030 ($ million)
Data Table on India - Market size and forecast 2025-2030 ($ million)
Chart on India - Year-over-year growth 2025-2030 (%)
Data Table on India - Year-over-year growth 2025-2030 (%)

12.3.3 Japan - Market size and forecast 2025-2030

Chart on Japan - Market size and forecast 2025-2030 ($ million)
Data Table on Japan - Market size and forecast 2025-2030 ($ million)
Chart on Japan - Year-over-year growth 2025-2030 (%)
Data Table on Japan - Year-over-year growth 2025-2030 (%)

12.3.4 South Korea - Market size and forecast 2025-2030

Chart on South Korea - Market size and forecast 2025-2030 ($ million)
Data Table on South Korea - Market size and forecast 2025-2030 ($ million)
Chart on South Korea - Year-over-year growth 2025-2030 (%)
Data Table on South Korea - Year-over-year growth 2025-2030 (%)

12.3.5 Australia - Market size and forecast 2025-2030

Chart on Australia - Market size and forecast 2025-2030 ($ million)
Data Table on Australia - Market size and forecast 2025-2030 ($ million)
Chart on Australia - Year-over-year growth 2025-2030 (%)
Data Table on Australia - Year-over-year growth 2025-2030 (%)

12.3.6 Indonesia - Market size and forecast 2025-2030

Chart on Indonesia - Market size and forecast 2025-2030 ($ million)
Data Table on Indonesia - Market size and forecast 2025-2030 ($ million)
Chart on Indonesia - Year-over-year growth 2025-2030 (%)
Data Table on Indonesia - Year-over-year growth 2025-2030 (%)

12.4 Europe - Market size and forecast 2025-2030

Chart on Europe - Market size and forecast 2025-2030 ($ million)
Data Table on Europe - Market size and forecast 2025-2030 ($ million)
Chart on Europe - Year-over-year growth 2025-2030 (%)
Data Table on Europe - Year-over-year growth 2025-2030 (%)
Chart on Regional Comparison - Europe
Data Table on Regional Comparison - Europe

12.4.1 Germany - Market size and forecast 2025-2030

Chart on Germany - Market size and forecast 2025-2030 ($ million)
Data Table on Germany - Market size and forecast 2025-2030 ($ million)
Chart on Germany - Year-over-year growth 2025-2030 (%)
Data Table on Germany - Year-over-year growth 2025-2030 (%)

12.4.2 Italy - Market size and forecast 2025-2030

Chart on Italy - Market size and forecast 2025-2030 ($ million)
Data Table on Italy - Market size and forecast 2025-2030 ($ million)
Chart on Italy - Year-over-year growth 2025-2030 (%)
Data Table on Italy - Year-over-year growth 2025-2030 (%)

12.4.3 France - Market size and forecast 2025-2030

Chart on France - Market size and forecast 2025-2030 ($ million)
Data Table on France - Market size and forecast 2025-2030 ($ million)
Chart on France - Year-over-year growth 2025-2030 (%)
Data Table on France - Year-over-year growth 2025-2030 (%)

12.4.4 UK - Market size and forecast 2025-2030

Chart on UK - Market size and forecast 2025-2030 ($ million)
Data Table on UK - Market size and forecast 2025-2030 ($ million)
Chart on UK - Year-over-year growth 2025-2030 (%)
Data Table on UK - Year-over-year growth 2025-2030 (%)

12.4.5 Spain - Market size and forecast 2025-2030

Chart on Spain - Market size and forecast 2025-2030 ($ million)
Data Table on Spain - Market size and forecast 2025-2030 ($ million)
Chart on Spain - Year-over-year growth 2025-2030 (%)
Data Table on Spain - Year-over-year growth 2025-2030 (%)

12.4.6 Poland - Market size and forecast 2025-2030

Chart on Poland - Market size and forecast 2025-2030 ($ million)
Data Table on Poland - Market size and forecast 2025-2030 ($ million)
Chart on Poland - Year-over-year growth 2025-2030 (%)
Data Table on Poland - Year-over-year growth 2025-2030 (%)

12.5 North America - Market size and forecast 2025-2030

Chart on North America - Market size and forecast 2025-2030 ($ million)
Data Table on North America - Market size and forecast 2025-2030 ($ million)
Chart on North America - Year-over-year growth 2025-2030 (%)
Data Table on North America - Year-over-year growth 2025-2030 (%)
Chart on Regional Comparison - North America
Data Table on Regional Comparison - North America

12.5.1 US - Market size and forecast 2025-2030

Chart on US - Market size and forecast 2025-2030 ($ million)
Data Table on US - Market size and forecast 2025-2030 ($ million)
Chart on US - Year-over-year growth 2025-2030 (%)
Data Table on US - Year-over-year growth 2025-2030 (%)

12.5.2 Canada - Market size and forecast 2025-2030

Chart on Canada - Market size and forecast 2025-2030 ($ million)
Data Table on Canada - Market size and forecast 2025-2030 ($ million)
Chart on Canada - Year-over-year growth 2025-2030 (%)
Data Table on Canada - Year-over-year growth 2025-2030 (%)

12.5.3 Mexico - Market size and forecast 2025-2030

Chart on Mexico - Market size and forecast 2025-2030 ($ million)
Data Table on Mexico - Market size and forecast 2025-2030 ($ million)
Chart on Mexico - Year-over-year growth 2025-2030 (%)
Data Table on Mexico - Year-over-year growth 2025-2030 (%)

12.6 Middle East and Africa - Market size and forecast 2025-2030

Chart on Middle East and Africa - Market size and forecast 2025-2030 ($ million)
Data Table on Middle East and Africa - Market size and forecast 2025-2030 ($ million)
Chart on Middle East and Africa - Year-over-year growth 2025-2030 (%)
Data Table on Middle East and Africa - Year-over-year growth 2025-2030 (%)
Chart on Regional Comparison - Middle East and Africa
Data Table on Regional Comparison - Middle East and Africa

12.6.1 Saudi Arabia - Market size and forecast 2025-2030

Chart on Saudi Arabia - Market size and forecast 2025-2030 ($ million)
Data Table on Saudi Arabia - Market size and forecast 2025-2030 ($ million)
Chart on Saudi Arabia - Year-over-year growth 2025-2030 (%)
Data Table on Saudi Arabia - Year-over-year growth 2025-2030 (%)

12.6.2 South Africa - Market size and forecast 2025-2030

Chart on South Africa - Market size and forecast 2025-2030 ($ million)
Data Table on South Africa - Market size and forecast 2025-2030 ($ million)
Chart on South Africa - Year-over-year growth 2025-2030 (%)
Data Table on South Africa - Year-over-year growth 2025-2030 (%)

12.6.3 UAE - Market size and forecast 2025-2030

Chart on UAE - Market size and forecast 2025-2030 ($ million)
Data Table on UAE - Market size and forecast 2025-2030 ($ million)
Chart on UAE - Year-over-year growth 2025-2030 (%)
Data Table on UAE - Year-over-year growth 2025-2030 (%)

12.6.4 Egypt - Market size and forecast 2025-2030

Chart on Egypt - Market size and forecast 2025-2030 ($ million)
Data Table on Egypt - Market size and forecast 2025-2030 ($ million)
Chart on Egypt - Year-over-year growth 2025-2030 (%)
Data Table on Egypt - Year-over-year growth 2025-2030 (%)

12.6.5 Turkey - Market size and forecast 2025-2030

Chart on Turkey - Market size and forecast 2025-2030 ($ million)
Data Table on Turkey - Market size and forecast 2025-2030 ($ million)
Chart on Turkey - Year-over-year growth 2025-2030 (%)
Data Table on Turkey - Year-over-year growth 2025-2030 (%)

12.7 South America - Market size and forecast 2025-2030

Chart on South America - Market size and forecast 2025-2030 ($ million)
Data Table on South America - Market size and forecast 2025-2030 ($ million)
Chart on South America - Year-over-year growth 2025-2030 (%)
Data Table on South America - Year-over-year growth 2025-2030 (%)
Chart on Regional Comparison - South America
Data Table on Regional Comparison - South America

12.7.1 Brazil - Market size and forecast 2025-2030

Chart on Brazil - Market size and forecast 2025-2030 ($ million)
Data Table on Brazil - Market size and forecast 2025-2030 ($ million)
Chart on Brazil - Year-over-year growth 2025-2030 (%)
Data Table on Brazil - Year-over-year growth 2025-2030 (%)

12.7.2 Argentina - Market size and forecast 2025-2030

Chart on Argentina - Market size and forecast 2025-2030 ($ million)
Data Table on Argentina - Market size and forecast 2025-2030 ($ million)
Chart on Argentina - Year-over-year growth 2025-2030 (%)
Data Table on Argentina - Year-over-year growth 2025-2030 (%)

12.7.3 Colombia - Market size and forecast 2025-2030

Chart on Colombia - Market size and forecast 2025-2030 ($ million)
Data Table on Colombia - Market size and forecast 2025-2030 ($ million)
Chart on Colombia - Year-over-year growth 2025-2030 (%)
Data Table on Colombia - Year-over-year growth 2025-2030 (%)

12.8 Market opportunity by geography

Market opportunity by geography ($ million)
Data Tables on Market opportunity by geography ($ million)

13. Drivers, Challenges, and Opportunity

13.1 Market drivers

Proliferation of electric vehicle adoption and automotive lightweighting
Expansion of global renewable energy infrastructure and grid modernization
Shift toward circular economy principles and sustainable packaging solutions

13.2 Market challenges

Escalating energy costs and environmental compliance mandates
Geopolitical fragmentation and proliferation of trade barriers
High capital expenditure requirements for technological modernization

13.3 Impact of drivers and challenges

Impact of drivers and challenges in 2025 and 2030

13.4 Market opportunities

Ascendancy of low-carbon aluminum and carbon border adjustment policies
Technological integration of AI and advanced robotics in smelting operations
Expansion of closed-loop recycling and advanced scrap sorting infrastructure

14. Competitive Landscape

14.1 Overview

14.2

Overview on criticality of inputs and factors of differentiation

14.3 Landscape disruption

Overview on factors of disruption

14.4 Industry risks

Impact of key risks on business

15. Competitive Analysis

15.1 Companies profiled

Companies covered

15.2 Company ranking index

15.3 Market positioning of companies

Matrix on companies position and classification

15.4 Alcoa Corp.

Alcoa Corp. - Overview
Alcoa Corp. - Business segments
Alcoa Corp. - Key news
Alcoa Corp. - Key offerings
Alcoa Corp. - Segment focus
SWOT

15.5 Aluminium Bahrain BSC

Aluminium Bahrain BSC - Overview
Aluminium Bahrain BSC - Product / Service
Aluminium Bahrain BSC - Key offerings
SWOT

15.6 Aluminum Corp. of China Ltd.

Aluminum Corp. of China Ltd. - Overview
Aluminum Corp. of China Ltd. - Business segments
Aluminum Corp. of China Ltd. - Key offerings
Aluminum Corp. of China Ltd. - Segment focus
SWOT

15.7 Arconic Corp.

Arconic Corp. - Overview
Arconic Corp. - Product / Service
Arconic Corp. - Key offerings
SWOT

15.8 Bonnell Aluminum Inc.

Bonnell Aluminum Inc. - Overview
Bonnell Aluminum Inc. - Product / Service
Bonnell Aluminum Inc. - Key offerings
SWOT

15.9 China Hongqiao Group Ltd.

China Hongqiao Group Ltd. - Overview
China Hongqiao Group Ltd. - Product / Service
China Hongqiao Group Ltd. - Key offerings
SWOT

15.10 Hindalco Industries

Hindalco Industries - Overview
Hindalco Industries - Business segments
Hindalco Industries - Key offerings
Hindalco Industries - Segment focus
SWOT

15.11 Hubei Xingfa Chemicals Group

Hubei Xingfa Chemicals Group - Overview
Hubei Xingfa Chemicals Group - Product / Service
Hubei Xingfa Chemicals Group - Key offerings
SWOT

15.12 Jindal Aluminium Ltd.

Jindal Aluminium Ltd. - Overview
Jindal Aluminium Ltd. - Product / Service
Jindal Aluminium Ltd. - Key offerings
SWOT

15.13 National Aluminium Co. Ltd.

National Aluminium Co. Ltd. - Overview
National Aluminium Co. Ltd. - Business segments
National Aluminium Co. Ltd. - Key offerings
National Aluminium Co. Ltd. - Segment focus
SWOT

15.14 Norsk Hydro ASA

Norsk Hydro ASA - Overview
Norsk Hydro ASA - Business segments
Norsk Hydro ASA - Key news
Norsk Hydro ASA - Key offerings
Norsk Hydro ASA - Segment focus
SWOT

15.15 Rio Tinto Ltd.

Rio Tinto Ltd. - Overview
Rio Tinto Ltd. - Business segments
Rio Tinto Ltd. - Key news
Rio Tinto Ltd. - Key offerings
Rio Tinto Ltd. - Segment focus
SWOT

15.16 Saudi Arabian Mining Co.

Saudi Arabian Mining Co. - Overview
Saudi Arabian Mining Co. - Business segments
Saudi Arabian Mining Co. - Key offerings
Saudi Arabian Mining Co. - Segment focus
SWOT

15.17 UACJ Corp.

UACJ Corp. - Overview
UACJ Corp. - Business segments
UACJ Corp. - Key offerings
UACJ Corp. - Segment focus
SWOT

15.18 Vedanta Ltd.

Vedanta Ltd. - Overview
Vedanta Ltd. - Business segments
Vedanta Ltd. - Key offerings
Vedanta Ltd. - Segment focus
SWOT

16. Appendix

16.1 Scope of the report

Market definition
Objectives
Notes and caveats

16.2 Inclusions and exclusions checklist

Inclusions checklist
Exclusions checklist

16.3 Currency conversion rates for US$

16.4 Research methodology

16.5 Data procurement

Information sources

16.6 Data validation

16.7 Validation techniques employed for market sizing

16.8 Data synthesis

16.9 360 degree market analysis

16.10 List of abbreviations

Research Methodology

Technavio presents a detailed picture of the market by way of study, synthesis, and summation of data from multiple sources. The analysts have presented the various facets of the market with a particular focus on identifying the key industry influencers. The data thus presented is comprehensive, reliable, and the result of extensive research, both primary and secondary.

INFORMATION SOURCES

Primary sources

  • Manufacturers and suppliers
  • Channel partners
  • Industry experts
  • Strategic decision makers

Secondary sources

  • Industry journals and periodicals
  • Government data
  • Financial reports of key industry players
  • Historical data
  • Press releases

DATA ANALYSIS

Data Synthesis

  • Collation of data
  • Estimation of key figures
  • Analysis of derived insights

Data Validation

  • Triangulation with data models
  • Reference against proprietary databases
  • Corroboration with industry experts

REPORT WRITING

Qualitative

  • Market drivers
  • Market challenges
  • Market trends
  • Five forces analysis

Quantitative

  • Market size and forecast
  • Market segmentation
  • Geographical insights
  • Competitive landscape

Interested in this report?

Get your sample now to see our research methodology and insights!

Download Now

Frequently Asked Questions

Aluminum market growth will increase by USD 45994.1 million during 2026-2030.

The Aluminum market is expected to grow at a CAGR of 4.1% during 2026-2030.

Aluminum market is segmented by End-user (Transportation, Construction, Packaging, Electrical engineering, Others) Type (Primary aluminum, Secondary aluminum) Technology (Extrusion, Casting, Rolling, Others)

Alcoa Corp., Aluminium Bahrain BSC, Aluminum Corp. of China Ltd., Arconic Corp., Bonnell Aluminum Inc., Century Aluminum Co., China Hongqiao Group Ltd., Constellium SE, Granges AB, Hindalco Industries, Hubei Xingfa Chemicals Group, Jindal Aluminium Ltd., Kaiser Aluminum Corp., National Aluminium Co. Ltd., Norsk Hydro ASA, Rio Tinto Ltd., Saudi Arabian Mining Co., UACJ Corp., United Co. RUSAL, Vedanta Ltd. are a few of the key vendors in the Aluminum market.

APAC will register the highest growth rate of 64.7% among the other regions. Therefore, the Aluminum market in APAC is expected to garner significant business opportunities for the vendors during the forecast period.

China, India, Japan, South Korea, Australia, Indonesia, Germany, Italy, France, UK, Spain, Poland, US, Canada, Mexico, Saudi Arabia, South Africa, UAE, Egypt, Turkey, Brazil, Argentina, Colombia

  • Proliferation of electric vehicle adoption and automotive lightweighting is the driving factor this market.

The Aluminum market vendors should focus on grabbing business opportunities from the End-user segment as it accounted for the largest market share in the base year.
RIA - Research AI Assistant
Ask RIA