Smart Pole Market Analysis, Size, and Forecast 2026-2030: North America (US, Canada, and Mexico), Europe (Germany, UK, and France), APAC (China, India, and Japan), Middle East and Africa (Saudi Arabia, UAE, and South Africa), South America (Brazil and Argentina), and Rest of World (ROW)

Smart Pole Market Analysis, Size, and Forecast 2026-2030:
North America (US, Canada, and Mexico), Europe (Germany, UK, and France), APAC (China, India, and Japan), Middle East and Africa (Saudi Arabia, UAE, and South Africa), South America (Brazil and Argentina), and Rest of World (ROW)

Published: May 2026 320 Pages SKU: IRTNTR41270

Market Overview at a Glance

$31.76 B
Market Opportunity
23.4%
CAGR 2025 - 2030
35.1%
North America Growth
$8.17 B
Retrofit installations segment 2024

Smart Pole Market Size 2026-2030

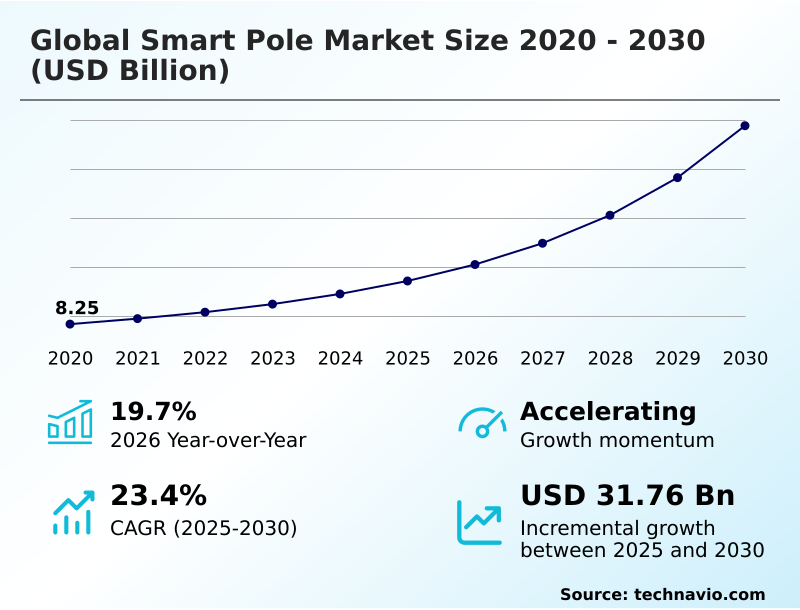
The smart pole market size is valued to increase by USD 31.76 billion, at a CAGR of 23.4% from 2025 to 2030. Acceleration of comprehensive smart city initiatives and urban digitalization will drive the smart pole market.

Major Market Trends & Insights

  • North America dominated the market and accounted for a 35.1% growth during the forecast period.
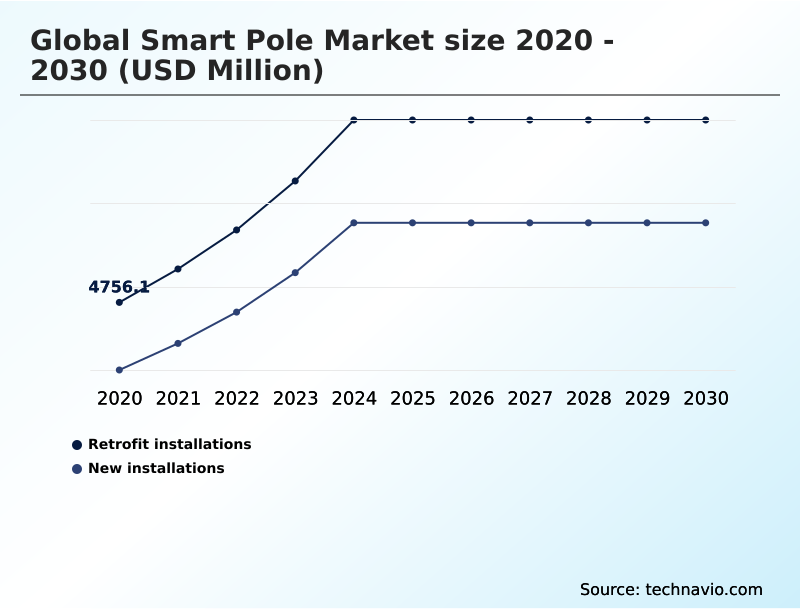
  • By Type - Retrofit installations segment was valued at USD 8.17 billion in 2024
  • By Product - Component segment accounted for the largest market revenue share in 2024

Market Size & Forecast

  • Market Opportunities: USD 40.58 billion
  • Market Future Opportunities: USD 31.76 billion
  • CAGR from 2025 to 2030 : 23.4%

Market Summary

  • The Smart Pole Market is fundamentally reshaping urban landscapes by transforming traditional streetlights into intelligent, multifunctional assets. This transition is driven by the convergence of several key factors, including the urgent need for energy conservation, the expansion of 5G telecommunications, and the escalating demand for enhanced public safety.
  • These advanced structures serve as critical nodes in a broader Internet of Things (IoT) network, integrating technologies such as high-efficiency light emitting diode fixtures, environmental sensors, public wireless internet provisioning, and high-definition surveillance cameras.
  • A key trend is the shift toward modular hardware architectures, allowing municipalities to customize poles with components like EV charging modules or digital signage integration as needs evolve.
  • For instance, a city can deploy a network of poles initially for adaptive lighting controls, achieving immediate energy savings, and later add acoustic monitoring systems for public safety without replacing the core infrastructure. However, the market faces challenges related to high initial investment costs and data privacy concerns, which require robust cybersecurity protocols and innovative public-private partnerships to overcome.
  • The integration of edge computing nodes further enhances capabilities, enabling real-time data analysis for applications like intelligent traffic management.

What will be the Size of the Smart Pole Market during the forecast period?

Get Key Insights on Market Forecast (PDF) Get Free Sample

How is the Smart Pole Market Segmented?

The smart pole industry research report provides comprehensive data (region-wise segment analysis), with forecasts and estimates in "USD million" for the period 2026-2030, as well as historical data from 2020-2024 for the following segments.

  • Type
    • Retrofit installations
    • New installations
  • Product
    • Component
    • Software
    • Services
  • Application
    • Highways and roadways
    • Public places
    • Railways and harbors
  • Technology
    • LED technology
    • IoT technology
    • Solar power technology
    • Communication technology
  • Geography
    • North America
      • US
      • Canada
      • Mexico
    • Europe
      • Germany
      • UK
      • France
    • APAC
      • China
      • India
      • Japan
    • Middle East and Africa
      • Saudi Arabia
      • UAE
      • South Africa
    • South America
      • Brazil
      • Argentina
    • Rest of World (ROW)

By Type Insights

The retrofit installations segment is estimated to witness significant growth during the forecast period.

The retrofit installations segment is a pragmatic strategy for urban digital transformation, enabling municipalities to deploy advanced smart city technologies without the high capital expenditure of full replacements.

This approach involves upgrading legacy streetlights with modular hardware architectures, including light emitting diode fixtures and environmental sensor arrays. This method facilitates a phased modernization, aligning with civic needs and public funding.

By reusing existing structures, cities reduce their carbon footprint, a key goal of sustainable urban development. This process minimizes disruption, as it avoids complex civil engineering tasks.

However, it requires structural integrity assessments to ensure legacy poles can support new hardware, and grid modernization is often needed to provide continuous power, a departure from traditional lighting which often achieves energy savings of more than 50%.

Get Free Sample

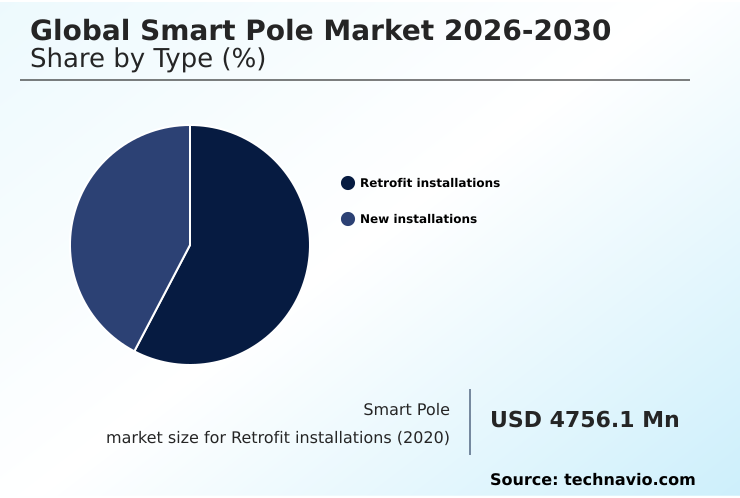
The Retrofit installations segment was valued at USD 8.17 billion in 2024 and showed a gradual increase during the forecast period.

Get Free Sample

Regional Analysis

North America is estimated to contribute 35.1% to the growth of the global market during the forecast period.Technavio’s analysts have elaborately explained the regional trends and drivers that shape the market during the forecast period.

See How Smart Pole Market Demand is Rising in North America Get Free Sample

The geographic landscape is diverse, with North America and Europe leading in mature deployments driven by smart city frameworks and sustainability goals.

North America represents over 35% of the incremental growth opportunity, leveraging its advanced telecommunications sector for 5G small cell integration. Meanwhile, APAC is the fastest-growing region, fueled by massive greenfield projects and state-led digitalization in countries like China and India.

The Middle East showcases futuristic applications, with nations like Saudi Arabia investing heavily in connected city infrastructure for new megacities.

In contrast, South America, which exhibits the market’s highest regional CAGR of 24.2%, and Africa focus on deploying off-grid renewable energy solutions and low-power wide-area networks to address fundamental needs for public safety monitoring and digital inclusion.

This regional differentiation shapes demand for specific features, from advanced edge analytics in developed markets to resilient infrastructure in emerging ones.

Market Dynamics

Our researchers analyzed the data with 2025 as the base year, along with the key drivers, trends, and challenges. A holistic analysis of drivers will help companies refine their marketing strategies to gain a competitive advantage.

  • The strategic value of the Smart Pole Market is increasingly defined by specific, high-impact use cases. The role of a smart pole for 5G network densification is paramount, as these structures provide the ideal pre-certified locations for small cell hardware, drastically reducing deployment timelines and costs for telecom operators.
  • This function is a core component of building out the infrastructure needed for autonomous vehicles and large-scale IoT applications. Concurrently, the benefits of modular smart pole design are reshaping procurement strategies.
  • Municipalities can now future-proof their investments by selecting a base structure and adding capabilities like advanced sensors or public address systems over time, avoiding the high cost of complete replacements.
  • This adaptable approach is central to understanding the ROI of smart pole retrofit projects, which can be completed in nearly half the time of new builds, delivering faster value through energy savings and enhanced services. As cities expand their smart city initiatives, the ability of these poles to serve as a unified platform for diverse technologies is crucial.
  • For instance, integrating EV charging into smart poles addresses the critical shortage of public charging infrastructure in dense urban areas, supporting the global transition to electric mobility without adding to street clutter. This multifaceted functionality underscores why a smart pole role in smart city initiatives is no longer a niche concept but a foundational element of modern urban planning.

What are the key market drivers leading to the rise in the adoption of Smart Pole Industry?

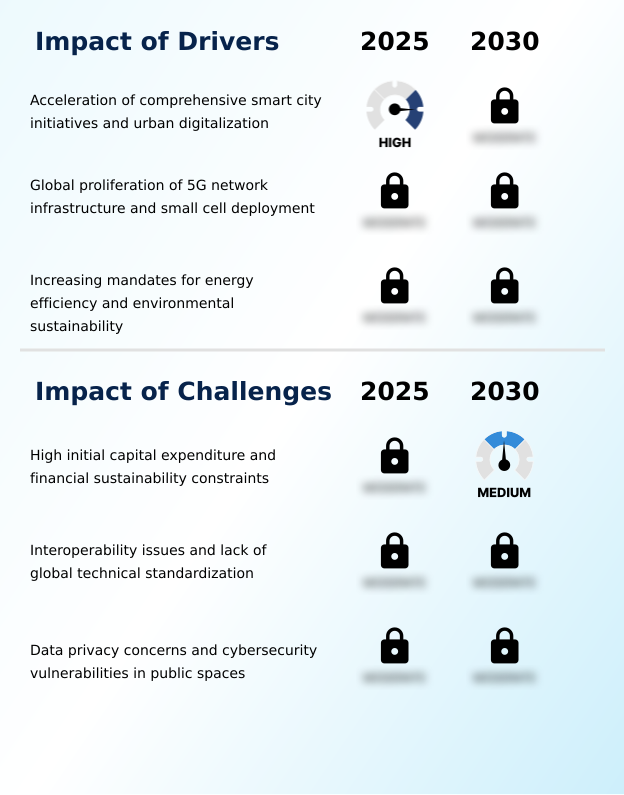
  • The acceleration of comprehensive smart city initiatives and widespread urban digitalization is the primary driver fueling market expansion.

  • Market growth is propelled by three primary drivers that address pressing urban challenges.
  • The acceleration of comprehensive smart city initiatives is a major catalyst, as municipalities transition to data-driven ecosystems where smart urban lighting poles act as foundational nodes for improving civic services.
  • Secondly, the global proliferation of 5G network infrastructure is a critical technical driver.
  • The technology's requirement for a high density of small cell installations is perfectly met by leveraging existing pole locations, with some cities reporting a 40% faster network rollout compared to building new towers.
  • This synergy between telecommunications and lighting is crucial for enabling advanced applications.
  • Finally, increasing mandates for energy efficiency and environmental sustainability are compelling the adoption of adaptive lighting controls and light emitting diode fixtures, which can reduce municipal energy consumption by over 50%.
  • This focus on sustainability also supports the broader transition toward transportation electrification.

What are the market trends shaping the Smart Pole Industry?

  • The market is shaped by a strategic evolution toward modular and multi-functional infrastructure design. This approach allows for the creation of customizable and future-proof urban assets.

  • Key trends are reshaping the market toward intelligent, adaptable, and economically viable urban assets. The evolution toward modular and highly customizable hardware architectures is paramount, enabling future-proof urban investments. This allows for the integration of diverse components, such as high-resolution surveillance cameras and EV charging modules, without overhauling entire structures.
  • Another transformative trend is the rise of innovative data monetization strategies through public-private partnerships, turning infrastructure into revenue streams via digital advertising and 5G small cell integration. Furthermore, the deep integration of artificial intelligence and edge analytics is creating decentralized intelligence.
  • This allows for real-time data analysis at the street level, with AI-driven predictive maintenance reducing operational downtime by up to 30% and enhancing public safety monitoring without the network latency of cloud-based processing. The adoption of carbon neutral smart poles powered by off-grid renewable energy is also gaining traction, aligning with global sustainability goals.

What challenges does the Smart Pole Industry face during its growth?

  • High initial capital expenditure and significant financial sustainability constraints present a key challenge to market growth.

  • Despite strong drivers, the market faces significant challenges that can impede widespread adoption. The high initial capital expenditure remains a primary restraint, particularly for smaller municipalities, as the cost of a single smart pole can be up to ten times that of a traditional streetlight. This financial barrier is compounded by long-term ROI cycles that are not always immediately apparent.
  • Secondly, a lack of global technical standardization and interoperability issues create a fragmented ecosystem. This forces cities into vendor lock-in and complicates the integration of hardware from different providers, increasing system management complexity by an estimated 20%. Finally, mounting data privacy concerns and cybersecurity vulnerabilities pose a major risk.
  • The extensive data collection from public spaces requires stringent cybersecurity protocols and transparent governance, as a single network breach could compromise critical city services and erode public trust, potentially leading to restrictive legislation.

Exclusive Technavio Analysis on Customer Landscape

The smart pole market forecasting report includes the adoption lifecycle of the market, covering from the innovator’s stage to the laggard’s stage. It focuses on adoption rates in different regions based on penetration. Furthermore, the smart pole market report also includes key purchase criteria and drivers of price sensitivity to help companies evaluate and develop their market growth analysis strategies.

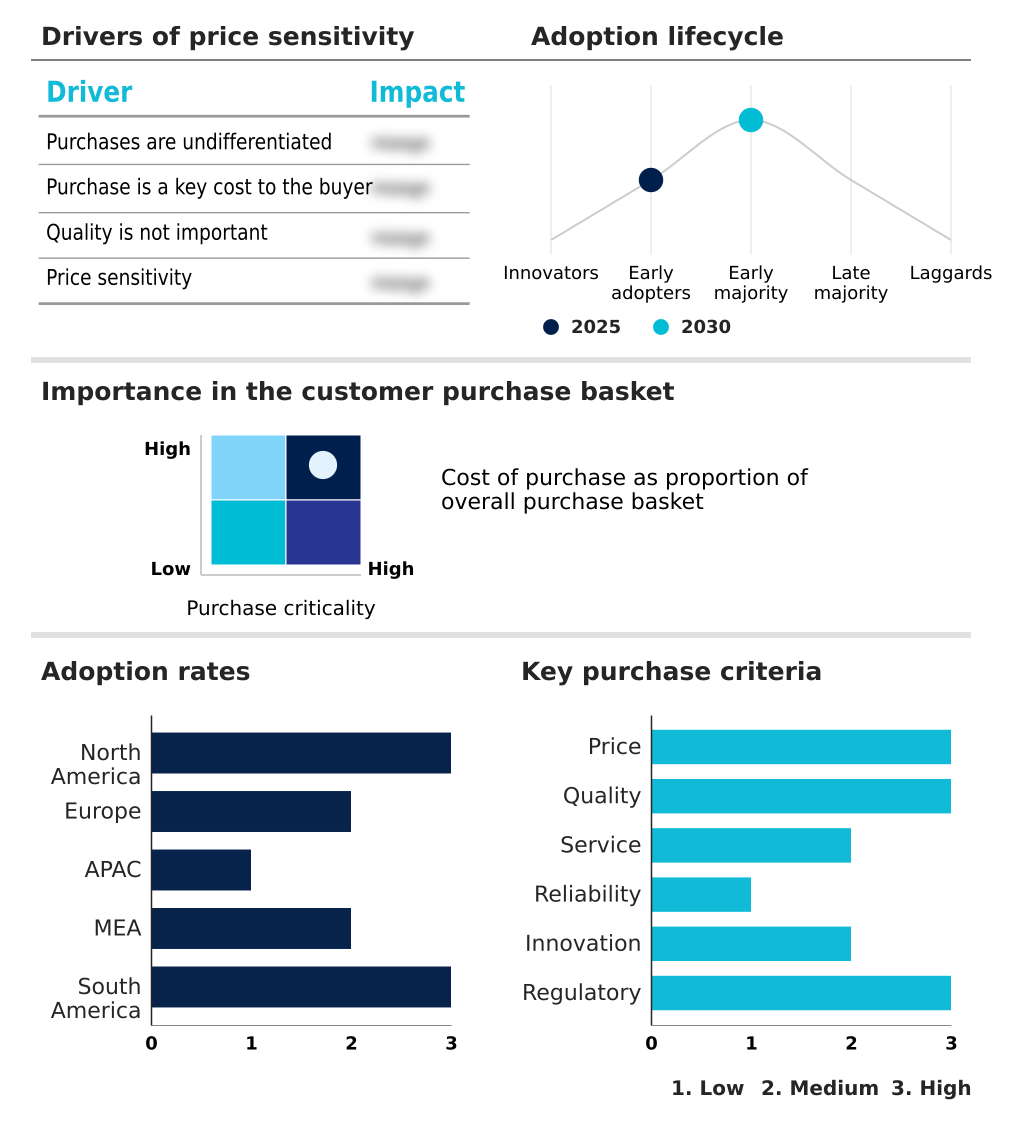
Customer Landscape of Smart Pole Industry

Competitive Landscape

Companies are implementing various strategies, such as strategic alliances, smart pole market forecast, partnerships, mergers and acquisitions, geographical expansion, and product/service launches, to enhance their presence in the industry.

Acuity Brands Inc. - Analysis reveals a market shift toward multifunctional urban infrastructure integrating intelligent lighting, 5G connectivity, and EV charging to enhance civic services and operational efficiency.

The industry research and growth report includes detailed analyses of the competitive landscape of the market and information about key companies, including:

  • Acuity Brands Inc.
  • Bosun Lighting Co. Ltd.
  • Delta Electronics Inc.
  • Eaton Corp. Plc
  • Efftronics Systems Pvt. Ltd
  • Hapco Inc.
  • Hubbell Inc.
  • IRAM Technologies Pvt. Ltd.
  • Kesslec Smart Lighting
  • Lanao Tek Pvt. Ltd.
  • Lumca Inc.
  • National LED Inc.
  • Norsk Hydro ASA
  • Omniflow S.A.
  • Sansi Electronic Engineering Co.
  • Schreder SA
  • Signify NV
  • Sunna Design SAS
  • Valmont Industries Inc.
  • Wipro Ltd.

Qualitative and quantitative analysis of companies has been conducted to help clients understand the wider business environment as well as the strengths and weaknesses of key industry players. Data is qualitatively analyzed to categorize companies as pure play, category-focused, industry-focused, and diversified; it is quantitatively analyzed to categorize companies as dominant, leading, strong, tentative, and weak.

Recent Development and News in Smart pole market

  • In April 2025, Digicomm International acquired EasyStreet Systems to accelerate the deployment of next-generation smart city networks and broadband infrastructure.
  • In May 2025, O2 Telefonica and 5G Synergiewerk partnered to launch a major rollout of 5G-integrated streetlights across 25 major cities in Germany.
  • In December 2025, Omniflow S.A. won the Smart Cities Global Startup Challenge for its carbon-neutral smart poles powered by integrated wind and solar energy.
  • In September 2025, Viper Networks and Apollo completed the pilot deployment of advanced smart city infrastructure, including intelligent lighting poles, in the Kingdom of Saudi Arabia.

Dive into Technavio’s robust research methodology, blending expert interviews, extensive data synthesis, and validated models for unparalleled Smart Pole Market insights. See full methodology.

Market Scope
Page number 320
Base year 2025
Historic period 2020-2024
Forecast period 2026-2030
Growth momentum & CAGR Accelerate at a CAGR of 23.4%
Market growth 2026-2030 USD 31759.1 million
Market structure Fragmented
YoY growth 2025-2026(%) 19.7%
Key countries US, Canada, Mexico, Germany, UK, France, Italy, Spain, The Netherlands, China, India, Japan, South Korea, Australia, Indonesia, Saudi Arabia, UAE, South Africa, Egypt, Turkey, Brazil, Argentina and Chile
Competitive landscape Leading Companies, Market Positioning of Companies, Competitive Strategies, and Industry Risks

Request Free Sample

Research Analyst Overview

  • The Smart Pole Market is defined by the convergence of urban modernization needs with advanced digital capabilities, creating a highly competitive and innovative landscape. The core of this market lies in transforming passive streetlights into active data and communication hubs.
  • Key vendors are differentiating themselves by offering solutions that integrate light emitting diode fixtures, IoT technology, and communication technology into a single, cohesive unit. A primary trend is the adoption of modular hardware architectures, which allow for the seamless addition of components like EV charging modules or high-definition surveillance cameras over time.
  • This trend directly influences boardroom decisions around capital expenditure, shifting the focus from one-time purchases to long-term, scalable infrastructure investments. For instance, the integration of AI-driven predictive maintenance can reduce operational costs by over 25% by anticipating hardware failures. As cities prioritize sustainability, the deployment of adaptive lighting controls becomes critical, with many projects achieving energy reductions of over 50%.
  • However, this hyper-connectivity requires robust cybersecurity protocols and central management software to protect against vulnerabilities and ensure operational integrity, a key consideration for mitigating municipal risk.

What are the Key Data Covered in this Smart Pole Market Research and Growth Report?

  • What is the expected growth of the Smart Pole Market between 2026 and 2030?

    • USD 31.76 billion, at a CAGR of 23.4%

  • What segmentation does the market report cover?

    • The report is segmented by Type (Retrofit installations, and New installations), Product (Component, Software, and Services), Application (Highways and roadways, Public places, and Railways and harbors), Technology (LED technology, IoT technology, Solar power technology, and Communication technology) and Geography (North America, Europe, APAC, Middle East and Africa, South America)

  • Which regions are analyzed in the report?

    • North America, Europe, APAC, Middle East and Africa and South America

  • What are the key growth drivers and market challenges?

    • Acceleration of comprehensive smart city initiatives and urban digitalization, High initial capital expenditure and financial sustainability constraints

  • Who are the major players in the Smart Pole Market?

    • Acuity Brands Inc., Bosun Lighting Co. Ltd., Delta Electronics Inc., Eaton Corp. Plc, Efftronics Systems Pvt. Ltd, Hapco Inc., Hubbell Inc., IRAM Technologies Pvt. Ltd., Kesslec Smart Lighting, Lanao Tek Pvt. Ltd., Lumca Inc., National LED Inc., Norsk Hydro ASA, Omniflow S.A., Sansi Electronic Engineering Co., Schreder SA, Signify NV, Sunna Design SAS, Valmont Industries Inc. and Wipro Ltd.

Market Research Insights

  • Market dynamics are defined by a push toward integrated functionality, where smart city frameworks drive adoption. The implementation of adaptive lighting systems can reduce municipal energy consumption by more than 50%, a compelling driver for widespread upgrades.
  • Concurrently, the need for 5G network densification is met by leveraging smart poles, with some urban projects increasing small cell site availability by over 40%. This synergy supports advanced applications and creates opportunities for asset monetization through revenue-sharing agreements. However, this increased connectivity introduces complexities, as systems without robust interoperability standards can experience 15% higher maintenance costs.
  • Public-private partnerships are proving essential for financing these large-scale projects, enabling urban digital transformation while managing budget constraints. These dynamics create a market where technological integration directly impacts financial and operational outcomes.

We can help! Our analysts can customize this smart pole market research report to meet your requirements.

Get in touch

1. Executive Summary

1.1 Market overview

Executive Summary - Chart on Market Overview
Executive Summary - Data Table on Market Overview
Executive Summary - Chart on Global Market Characteristics
Executive Summary - Chart on Market by Geography
Executive Summary - Chart on Market Segmentation by Type
Executive Summary - Chart on Market Segmentation by Product
Executive Summary - Chart on Market Segmentation by Application
Executive Summary - Chart on Market Segmentation by Technology
Executive Summary - Chart on Incremental Growth
Executive Summary - Data Table on Incremental Growth
Executive Summary - Chart on Company Market Positioning

2. Technavio Analysis

2.1 Analysis of price sensitivity, lifecycle, customer purchase basket, adoption rates, and purchase criteria

2.2 Criticality of inputs and Factors of differentiation

Chart on Overview on criticality of inputs and factors of differentiation

2.3 Factors of disruption

Chart on Overview on factors of disruption

2.4 Impact of drivers and challenges

Chart on Impact of drivers and challenges in 2025 and 2030

3. Market Landscape

3.1 Market ecosystem

Chart on Parent Market
Data Table on - Parent Market

3.2 Market characteristics

Chart on Market characteristics analysis

3.3 Value chain analysis

Chart on Value chain analysis

4. Market Sizing

4.1 Market definition

Data Table on Offerings of companies included in the market definition

4.2 Market segment analysis

Market segments

4.3 Market size 2025

4.4 Market outlook: Forecast for 2025-2030

Chart on Global - Market size and forecast 2025-2030 ($ million)
Data Table on Global - Market size and forecast 2025-2030 ($ million)
Chart on Global Market: Year-over-year growth 2025-2030 (%)
Data Table on Global Market: Year-over-year growth 2025-2030 (%)

5. Historic Market Size

5.1 Global Smart Pole Market 2020 - 2024

Historic Market Size - Data Table on Global Smart Pole Market 2020 - 2024 ($ million)

5.2 Type segment analysis 2020 - 2024

Historic Market Size - Type Segment 2020 - 2024 ($ million)

5.3 Product segment analysis 2020 - 2024

Historic Market Size - Product Segment 2020 - 2024 ($ million)

5.4 Application segment analysis 2020 - 2024

Historic Market Size - Application Segment 2020 - 2024 ($ million)

5.5 Technology segment analysis 2020 - 2024

Historic Market Size - Technology Segment 2020 - 2024 ($ million)

5.6 Geography segment analysis 2020 - 2024

Historic Market Size - Geography Segment 2020 - 2024 ($ million)

5.7 Country segment analysis 2020 - 2024

Historic Market Size - Country Segment 2020 - 2024 ($ million)

6. Qualitative Analysis

6.1 Impact of AI on global smart pole market

6.2 Impact of geopolitical conflicts on global smart pole market

7. Five Forces Analysis

7.1 Five forces summary

Five forces analysis - Comparison between 2025 and 2030

7.2 Bargaining power of buyers

Bargaining power of buyers - Impact of key factors 2025 and 2030

7.3 Bargaining power of suppliers

Bargaining power of suppliers - Impact of key factors in 2025 and 2030

7.4 Threat of new entrants

Threat of new entrants - Impact of key factors in 2025 and 2030

7.5 Threat of substitutes

Threat of substitutes - Impact of key factors in 2025 and 2030

7.6 Threat of rivalry

Threat of rivalry - Impact of key factors in 2025 and 2030

7.7 Market condition

Chart on Market condition - Five forces 2025 and 2030

8. Market Segmentation by Type

8.1 Market segments

Chart on Type - Market share 2025-2030 (%)
Data Table on Type - Market share 2025-2030 (%)

8.2 Comparison by Type

Chart on Comparison by Type
Data Table on Comparison by Type

8.3 Retrofit installations - Market size and forecast 2025-2030

Chart on Retrofit installations - Market size and forecast 2025-2030 ($ million)
Data Table on Retrofit installations - Market size and forecast 2025-2030 ($ million)
Chart on Retrofit installations - Year-over-year growth 2025-2030 (%)
Data Table on Retrofit installations - Year-over-year growth 2025-2030 (%)

8.4 New installations - Market size and forecast 2025-2030

Chart on New installations - Market size and forecast 2025-2030 ($ million)
Data Table on New installations - Market size and forecast 2025-2030 ($ million)
Chart on New installations - Year-over-year growth 2025-2030 (%)
Data Table on New installations - Year-over-year growth 2025-2030 (%)

8.5 Market opportunity by Type

Market opportunity by Type ($ million)
Data Table on Market opportunity by Type ($ million)

9. Market Segmentation by Product

9.1 Market segments

Chart on Product - Market share 2025-2030 (%)
Data Table on Product - Market share 2025-2030 (%)

9.2 Comparison by Product

Chart on Comparison by Product
Data Table on Comparison by Product

9.3 Component - Market size and forecast 2025-2030

Chart on Component - Market size and forecast 2025-2030 ($ million)
Data Table on Component - Market size and forecast 2025-2030 ($ million)
Chart on Component - Year-over-year growth 2025-2030 (%)
Data Table on Component - Year-over-year growth 2025-2030 (%)

9.4 Software - Market size and forecast 2025-2030

Chart on Software - Market size and forecast 2025-2030 ($ million)
Data Table on Software - Market size and forecast 2025-2030 ($ million)
Chart on Software - Year-over-year growth 2025-2030 (%)
Data Table on Software - Year-over-year growth 2025-2030 (%)

9.5 Services - Market size and forecast 2025-2030

Chart on Services - Market size and forecast 2025-2030 ($ million)
Data Table on Services - Market size and forecast 2025-2030 ($ million)
Chart on Services - Year-over-year growth 2025-2030 (%)
Data Table on Services - Year-over-year growth 2025-2030 (%)

9.6 Market opportunity by Product

Market opportunity by Product ($ million)
Data Table on Market opportunity by Product ($ million)

10. Market Segmentation by Application

10.1 Market segments

Chart on Application - Market share 2025-2030 (%)
Data Table on Application - Market share 2025-2030 (%)

10.2 Comparison by Application

Chart on Comparison by Application
Data Table on Comparison by Application

10.3 Highways and roadways - Market size and forecast 2025-2030

Chart on Highways and roadways - Market size and forecast 2025-2030 ($ million)
Data Table on Highways and roadways - Market size and forecast 2025-2030 ($ million)
Chart on Highways and roadways - Year-over-year growth 2025-2030 (%)
Data Table on Highways and roadways - Year-over-year growth 2025-2030 (%)

10.4 Public places - Market size and forecast 2025-2030

Chart on Public places - Market size and forecast 2025-2030 ($ million)
Data Table on Public places - Market size and forecast 2025-2030 ($ million)
Chart on Public places - Year-over-year growth 2025-2030 (%)
Data Table on Public places - Year-over-year growth 2025-2030 (%)

10.5 Railways and harbors - Market size and forecast 2025-2030

Chart on Railways and harbors - Market size and forecast 2025-2030 ($ million)
Data Table on Railways and harbors - Market size and forecast 2025-2030 ($ million)
Chart on Railways and harbors - Year-over-year growth 2025-2030 (%)
Data Table on Railways and harbors - Year-over-year growth 2025-2030 (%)

10.6 Market opportunity by Application

Market opportunity by Application ($ million)
Data Table on Market opportunity by Application ($ million)

11. Market Segmentation by Technology

11.1 Market segments

Chart on Technology - Market share 2025-2030 (%)
Data Table on Technology - Market share 2025-2030 (%)

11.2 Comparison by Technology

Chart on Comparison by Technology
Data Table on Comparison by Technology

11.3 LED technology - Market size and forecast 2025-2030

Chart on LED technology - Market size and forecast 2025-2030 ($ million)
Data Table on LED technology - Market size and forecast 2025-2030 ($ million)
Chart on LED technology - Year-over-year growth 2025-2030 (%)
Data Table on LED technology - Year-over-year growth 2025-2030 (%)

11.4 IoT technology - Market size and forecast 2025-2030

Chart on IoT technology - Market size and forecast 2025-2030 ($ million)
Data Table on IoT technology - Market size and forecast 2025-2030 ($ million)
Chart on IoT technology - Year-over-year growth 2025-2030 (%)
Data Table on IoT technology - Year-over-year growth 2025-2030 (%)

11.5 Solar power technology - Market size and forecast 2025-2030

Chart on Solar power technology - Market size and forecast 2025-2030 ($ million)
Data Table on Solar power technology - Market size and forecast 2025-2030 ($ million)
Chart on Solar power technology - Year-over-year growth 2025-2030 (%)
Data Table on Solar power technology - Year-over-year growth 2025-2030 (%)

11.6 Communication technology - Market size and forecast 2025-2030

Chart on Communication technology - Market size and forecast 2025-2030 ($ million)
Data Table on Communication technology - Market size and forecast 2025-2030 ($ million)
Chart on Communication technology - Year-over-year growth 2025-2030 (%)
Data Table on Communication technology - Year-over-year growth 2025-2030 (%)

11.7 Market opportunity by Technology

Market opportunity by Technology ($ million)
Data Table on Market opportunity by Technology ($ million)

12. Customer Landscape

12.1 Customer landscape overview

Analysis of price sensitivity, lifecycle, customer purchase basket, adoption rates, and purchase criteria

13. Geographic Landscape

13.1 Geographic segmentation

Chart on Market share by geography 2025-2030 (%)
Data Table on Market share by geography 2025-2030 (%)

13.2 Geographic comparison

Chart on Geographic comparison
Data Table on Geographic comparison

13.3 North America - Market size and forecast 2025-2030

Chart on North America - Market size and forecast 2025-2030 ($ million)
Data Table on North America - Market size and forecast 2025-2030 ($ million)
Chart on North America - Year-over-year growth 2025-2030 (%)
Data Table on North America - Year-over-year growth 2025-2030 (%)
Chart on Regional Comparison - North America
Data Table on Regional Comparison - North America

13.3.1 US - Market size and forecast 2025-2030

Chart on US - Market size and forecast 2025-2030 ($ million)
Data Table on US - Market size and forecast 2025-2030 ($ million)
Chart on US - Year-over-year growth 2025-2030 (%)
Data Table on US - Year-over-year growth 2025-2030 (%)

13.3.2 Canada - Market size and forecast 2025-2030

Chart on Canada - Market size and forecast 2025-2030 ($ million)
Data Table on Canada - Market size and forecast 2025-2030 ($ million)
Chart on Canada - Year-over-year growth 2025-2030 (%)
Data Table on Canada - Year-over-year growth 2025-2030 (%)

13.3.3 Mexico - Market size and forecast 2025-2030

Chart on Mexico - Market size and forecast 2025-2030 ($ million)
Data Table on Mexico - Market size and forecast 2025-2030 ($ million)
Chart on Mexico - Year-over-year growth 2025-2030 (%)
Data Table on Mexico - Year-over-year growth 2025-2030 (%)

13.4 Europe - Market size and forecast 2025-2030

Chart on Europe - Market size and forecast 2025-2030 ($ million)
Data Table on Europe - Market size and forecast 2025-2030 ($ million)
Chart on Europe - Year-over-year growth 2025-2030 (%)
Data Table on Europe - Year-over-year growth 2025-2030 (%)
Chart on Regional Comparison - Europe
Data Table on Regional Comparison - Europe

13.4.1 Germany - Market size and forecast 2025-2030

Chart on Germany - Market size and forecast 2025-2030 ($ million)
Data Table on Germany - Market size and forecast 2025-2030 ($ million)
Chart on Germany - Year-over-year growth 2025-2030 (%)
Data Table on Germany - Year-over-year growth 2025-2030 (%)

13.4.2 UK - Market size and forecast 2025-2030

Chart on UK - Market size and forecast 2025-2030 ($ million)
Data Table on UK - Market size and forecast 2025-2030 ($ million)
Chart on UK - Year-over-year growth 2025-2030 (%)
Data Table on UK - Year-over-year growth 2025-2030 (%)

13.4.3 France - Market size and forecast 2025-2030

Chart on France - Market size and forecast 2025-2030 ($ million)
Data Table on France - Market size and forecast 2025-2030 ($ million)
Chart on France - Year-over-year growth 2025-2030 (%)
Data Table on France - Year-over-year growth 2025-2030 (%)

13.4.4 Italy - Market size and forecast 2025-2030

Chart on Italy - Market size and forecast 2025-2030 ($ million)
Data Table on Italy - Market size and forecast 2025-2030 ($ million)
Chart on Italy - Year-over-year growth 2025-2030 (%)
Data Table on Italy - Year-over-year growth 2025-2030 (%)

13.4.5 Spain - Market size and forecast 2025-2030

Chart on Spain - Market size and forecast 2025-2030 ($ million)
Data Table on Spain - Market size and forecast 2025-2030 ($ million)
Chart on Spain - Year-over-year growth 2025-2030 (%)
Data Table on Spain - Year-over-year growth 2025-2030 (%)

13.4.6 The Netherlands - Market size and forecast 2025-2030

Chart on The Netherlands - Market size and forecast 2025-2030 ($ million)
Data Table on The Netherlands - Market size and forecast 2025-2030 ($ million)
Chart on The Netherlands - Year-over-year growth 2025-2030 (%)
Data Table on The Netherlands - Year-over-year growth 2025-2030 (%)

13.5 APAC - Market size and forecast 2025-2030

Chart on APAC - Market size and forecast 2025-2030 ($ million)
Data Table on APAC - Market size and forecast 2025-2030 ($ million)
Chart on APAC - Year-over-year growth 2025-2030 (%)
Data Table on APAC - Year-over-year growth 2025-2030 (%)
Chart on Regional Comparison - APAC
Data Table on Regional Comparison - APAC

13.5.1 China - Market size and forecast 2025-2030

Chart on China - Market size and forecast 2025-2030 ($ million)
Data Table on China - Market size and forecast 2025-2030 ($ million)
Chart on China - Year-over-year growth 2025-2030 (%)
Data Table on China - Year-over-year growth 2025-2030 (%)

13.5.2 India - Market size and forecast 2025-2030

Chart on India - Market size and forecast 2025-2030 ($ million)
Data Table on India - Market size and forecast 2025-2030 ($ million)
Chart on India - Year-over-year growth 2025-2030 (%)
Data Table on India - Year-over-year growth 2025-2030 (%)

13.5.3 Japan - Market size and forecast 2025-2030

Chart on Japan - Market size and forecast 2025-2030 ($ million)
Data Table on Japan - Market size and forecast 2025-2030 ($ million)
Chart on Japan - Year-over-year growth 2025-2030 (%)
Data Table on Japan - Year-over-year growth 2025-2030 (%)

13.5.4 South Korea - Market size and forecast 2025-2030

Chart on South Korea - Market size and forecast 2025-2030 ($ million)
Data Table on South Korea - Market size and forecast 2025-2030 ($ million)
Chart on South Korea - Year-over-year growth 2025-2030 (%)
Data Table on South Korea - Year-over-year growth 2025-2030 (%)

13.5.5 Australia - Market size and forecast 2025-2030

Chart on Australia - Market size and forecast 2025-2030 ($ million)
Data Table on Australia - Market size and forecast 2025-2030 ($ million)
Chart on Australia - Year-over-year growth 2025-2030 (%)
Data Table on Australia - Year-over-year growth 2025-2030 (%)

13.5.6 Indonesia - Market size and forecast 2025-2030

Chart on Indonesia - Market size and forecast 2025-2030 ($ million)
Data Table on Indonesia - Market size and forecast 2025-2030 ($ million)
Chart on Indonesia - Year-over-year growth 2025-2030 (%)
Data Table on Indonesia - Year-over-year growth 2025-2030 (%)

13.6 Middle East and Africa - Market size and forecast 2025-2030

Chart on Middle East and Africa - Market size and forecast 2025-2030 ($ million)
Data Table on Middle East and Africa - Market size and forecast 2025-2030 ($ million)
Chart on Middle East and Africa - Year-over-year growth 2025-2030 (%)
Data Table on Middle East and Africa - Year-over-year growth 2025-2030 (%)
Chart on Regional Comparison - Middle East and Africa
Data Table on Regional Comparison - Middle East and Africa

13.6.1 Saudi Arabia - Market size and forecast 2025-2030

Chart on Saudi Arabia - Market size and forecast 2025-2030 ($ million)
Data Table on Saudi Arabia - Market size and forecast 2025-2030 ($ million)
Chart on Saudi Arabia - Year-over-year growth 2025-2030 (%)
Data Table on Saudi Arabia - Year-over-year growth 2025-2030 (%)

13.6.2 UAE - Market size and forecast 2025-2030

Chart on UAE - Market size and forecast 2025-2030 ($ million)
Data Table on UAE - Market size and forecast 2025-2030 ($ million)
Chart on UAE - Year-over-year growth 2025-2030 (%)
Data Table on UAE - Year-over-year growth 2025-2030 (%)

13.6.3 South Africa - Market size and forecast 2025-2030

Chart on South Africa - Market size and forecast 2025-2030 ($ million)
Data Table on South Africa - Market size and forecast 2025-2030 ($ million)
Chart on South Africa - Year-over-year growth 2025-2030 (%)
Data Table on South Africa - Year-over-year growth 2025-2030 (%)

13.6.4 Egypt - Market size and forecast 2025-2030

Chart on Egypt - Market size and forecast 2025-2030 ($ million)
Data Table on Egypt - Market size and forecast 2025-2030 ($ million)
Chart on Egypt - Year-over-year growth 2025-2030 (%)
Data Table on Egypt - Year-over-year growth 2025-2030 (%)

13.6.5 Turkey - Market size and forecast 2025-2030

Chart on Turkey - Market size and forecast 2025-2030 ($ million)
Data Table on Turkey - Market size and forecast 2025-2030 ($ million)
Chart on Turkey - Year-over-year growth 2025-2030 (%)
Data Table on Turkey - Year-over-year growth 2025-2030 (%)

13.7 South America - Market size and forecast 2025-2030

Chart on South America - Market size and forecast 2025-2030 ($ million)
Data Table on South America - Market size and forecast 2025-2030 ($ million)
Chart on South America - Year-over-year growth 2025-2030 (%)
Data Table on South America - Year-over-year growth 2025-2030 (%)
Chart on Regional Comparison - South America
Data Table on Regional Comparison - South America

13.7.1 Brazil - Market size and forecast 2025-2030

Chart on Brazil - Market size and forecast 2025-2030 ($ million)
Data Table on Brazil - Market size and forecast 2025-2030 ($ million)
Chart on Brazil - Year-over-year growth 2025-2030 (%)
Data Table on Brazil - Year-over-year growth 2025-2030 (%)

13.7.2 Argentina - Market size and forecast 2025-2030

Chart on Argentina - Market size and forecast 2025-2030 ($ million)
Data Table on Argentina - Market size and forecast 2025-2030 ($ million)
Chart on Argentina - Year-over-year growth 2025-2030 (%)
Data Table on Argentina - Year-over-year growth 2025-2030 (%)

13.7.3 Chile - Market size and forecast 2025-2030

Chart on Chile - Market size and forecast 2025-2030 ($ million)
Data Table on Chile - Market size and forecast 2025-2030 ($ million)
Chart on Chile - Year-over-year growth 2025-2030 (%)
Data Table on Chile - Year-over-year growth 2025-2030 (%)

13.8 Market opportunity by geography

Market opportunity by geography ($ million)
Data Tables on Market opportunity by geography ($ million)

14. Drivers, Challenges, and Opportunity

14.1 Market drivers

Acceleration of comprehensive smart city initiatives and urban digitalization
Global proliferation of 5G network infrastructure and small cell deployment
Increasing mandates for energy efficiency and environmental sustainability

14.2 Market challenges

High initial capital expenditure and financial sustainability constraints
Interoperability issues and lack of global technical standardization
Data privacy concerns and cybersecurity vulnerabilities in public spaces

14.3 Impact of drivers and challenges

Impact of drivers and challenges in 2025 and 2030

14.4 Market opportunities

Evolution toward modular and multi-functional infrastructure design
Increasing implementation of data monetization and public-private partnership models
Integration of artificial intelligence and edge analytics for real-time governance

15. Competitive Landscape

15.1 Overview

15.2

Overview on criticality of inputs and factors of differentiation

15.3 Landscape disruption

Overview on factors of disruption

15.4 Industry risks

Impact of key risks on business

16. Competitive Analysis

16.1 Companies profiled

Companies covered

16.2 Company ranking index

16.3 Market positioning of companies

Matrix on companies position and classification

16.4 Acuity Brands Inc.

Acuity Brands Inc. - Overview
Acuity Brands Inc. - Business segments
Acuity Brands Inc. - Key offerings
Acuity Brands Inc. - Segment focus
SWOT

16.5 Delta Electronics Inc.

Delta Electronics Inc. - Overview
Delta Electronics Inc. - Business segments
Delta Electronics Inc. - Key offerings
Delta Electronics Inc. - Segment focus
SWOT

16.6 Eaton Corp. Plc

Eaton Corp. Plc - Overview
Eaton Corp. Plc - Business segments
Eaton Corp. Plc - Key news
Eaton Corp. Plc - Key offerings
Eaton Corp. Plc - Segment focus
SWOT

16.7 Efftronics Systems Pvt. Ltd

Efftronics Systems Pvt. Ltd - Overview
Efftronics Systems Pvt. Ltd - Product / Service
Efftronics Systems Pvt. Ltd - Key offerings
SWOT

16.8 Hapco Inc.

Hapco Inc. - Overview
Hapco Inc. - Product / Service
Hapco Inc. - Key offerings
SWOT

16.9 Hubbell Inc.

Hubbell Inc. - Overview
Hubbell Inc. - Business segments
Hubbell Inc. - Key offerings
Hubbell Inc. - Segment focus
SWOT

16.10 Kesslec Smart Lighting

Kesslec Smart Lighting - Overview
Kesslec Smart Lighting - Product / Service
Kesslec Smart Lighting - Key offerings
SWOT

16.11 National LED Inc.

National LED Inc. - Overview
National LED Inc. - Product / Service
National LED Inc. - Key offerings
SWOT

16.12 Norsk Hydro ASA

Norsk Hydro ASA - Overview
Norsk Hydro ASA - Business segments
Norsk Hydro ASA - Key news
Norsk Hydro ASA - Key offerings
Norsk Hydro ASA - Segment focus
SWOT

16.13 Omniflow S.A.

Omniflow S.A. - Overview
Omniflow S.A. - Product / Service
Omniflow S.A. - Key offerings
SWOT

16.14 Schreder SA

Schreder SA - Overview
Schreder SA - Product / Service
Schreder SA - Key offerings
SWOT

16.15 Signify NV

Signify NV - Overview
Signify NV - Business segments
Signify NV - Key offerings
Signify NV - Segment focus
SWOT

16.16 Sunna Design SAS

Sunna Design SAS - Overview
Sunna Design SAS - Product / Service
Sunna Design SAS - Key offerings
SWOT

16.17 Valmont Industries Inc.

Valmont Industries Inc. - Overview
Valmont Industries Inc. - Business segments
Valmont Industries Inc. - Key offerings
Valmont Industries Inc. - Segment focus
SWOT

16.18 Wipro Ltd.

Wipro Ltd. - Overview
Wipro Ltd. - Business segments
Wipro Ltd. - Key news
Wipro Ltd. - Key offerings
Wipro Ltd. - Segment focus
SWOT

17. Appendix

17.1 Scope of the report

Market definition
Objectives
Notes and caveats

17.2 Inclusions and exclusions checklist

Inclusions checklist
Exclusions checklist

17.3 Currency conversion rates for US$

17.4 Research methodology

17.5 Data procurement

Information sources

17.6 Data validation

17.7 Validation techniques employed for market sizing

17.8 Data synthesis

17.9 360 degree market analysis

17.10 List of abbreviations

Research Methodology

Technavio presents a detailed picture of the market by way of study, synthesis, and summation of data from multiple sources. The analysts have presented the various facets of the market with a particular focus on identifying the key industry influencers. The data thus presented is comprehensive, reliable, and the result of extensive research, both primary and secondary.

INFORMATION SOURCES

Primary sources

  • Manufacturers and suppliers
  • Channel partners
  • Industry experts
  • Strategic decision makers

Secondary sources

  • Industry journals and periodicals
  • Government data
  • Financial reports of key industry players
  • Historical data
  • Press releases

DATA ANALYSIS

Data Synthesis

  • Collation of data
  • Estimation of key figures
  • Analysis of derived insights

Data Validation

  • Triangulation with data models
  • Reference against proprietary databases
  • Corroboration with industry experts

REPORT WRITING

Qualitative

  • Market drivers
  • Market challenges
  • Market trends
  • Five forces analysis

Quantitative

  • Market size and forecast
  • Market segmentation
  • Geographical insights
  • Competitive landscape

Interested in this report?

Get your sample now to see our research methodology and insights!

Download Now

Frequently Asked Questions

Smart Pole market growth will increase by USD 31759.1 million during 2026-2030.

The Smart Pole market is expected to grow at a CAGR of 23.4% during 2026-2030.

Smart Pole market is segmented by Type (Retrofit installations, New installations) Product (Component, Software, Services) Application (Highways and roadways, Public places, Railways and harbors) Technology (LED technology, IoT technology, Solar power technology, Communication technology)

Acuity Brands Inc., Bosun Lighting Co. Ltd., Delta Electronics Inc., Eaton Corp. Plc, Efftronics Systems Pvt. Ltd, Hapco Inc., Hubbell Inc., IRAM Technologies Pvt. Ltd., Kesslec Smart Lighting, Lanao Tek Pvt. Ltd., Lumca Inc., National LED Inc., Norsk Hydro ASA, Omniflow S.A., Sansi Electronic Engineering Co., Schreder SA, Signify NV, Sunna Design SAS, Valmont Industries Inc., Wipro Ltd. are a few of the key vendors in the Smart Pole market.

North America will register the highest growth rate of 35.1% among the other regions. Therefore, the Smart Pole market in North America is expected to garner significant business opportunities for the vendors during the forecast period.

US, Canada, Mexico, Germany, UK, France, Italy, Spain, The Netherlands, China, India, Japan, South Korea, Australia, Indonesia, Saudi Arabia, UAE, South Africa, Egypt, Turkey, Brazil, Argentina, Chile

  • Acceleration of comprehensive smart city initiatives and urban digitalization is the driving factor this market.

The Smart Pole market vendors should focus on grabbing business opportunities from the Type segment as it accounted for the largest market share in the base year.
RIA - Research AI Assistant
Ask RIA