Edge Computing Market Analysis, Size, and Forecast 2025-2029: North America (US, Canada), Europe (Germany, UK, Italy, France), APAC (China, India, Japan), South America (Brazil), Middle East & Africa

Edge Computing Market Analysis, Size, and Forecast 2025-2029:
North America (US, Canada), Europe (Germany, UK, Italy, France), APAC (China, India, Japan), South America (Brazil), Middle East & Africa

Published: Feb 2025 261 Pages SKU: IRTNTR41519

Market Overview at a Glance

$29.41 B
Market Opportunity
37.4%
CAGR
28.1
YoY growth 2024-2025(%)

Edge Computing Market Size 2025-2029

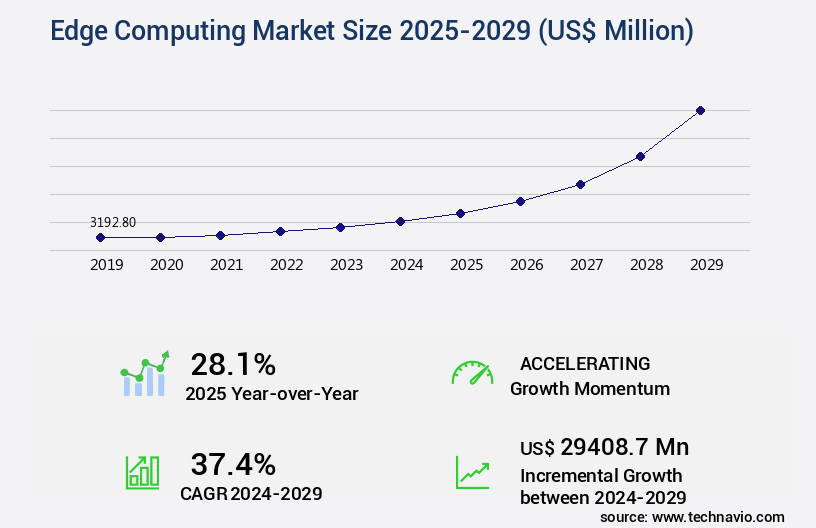
The edge computing market size is valued to increase USD 29.41 billion, at a CAGR of 37.4% from 2024 to 2029. Rising demand for decentralized computing to reduce latency in decision making will drive the edge computing market.

Major Market Trends & Insights

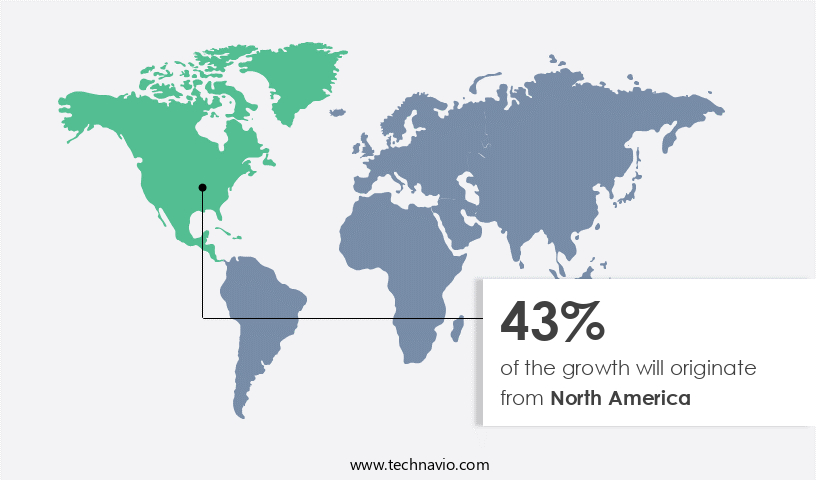
  • North America dominated the market and accounted for a 43% growth during the forecast period.
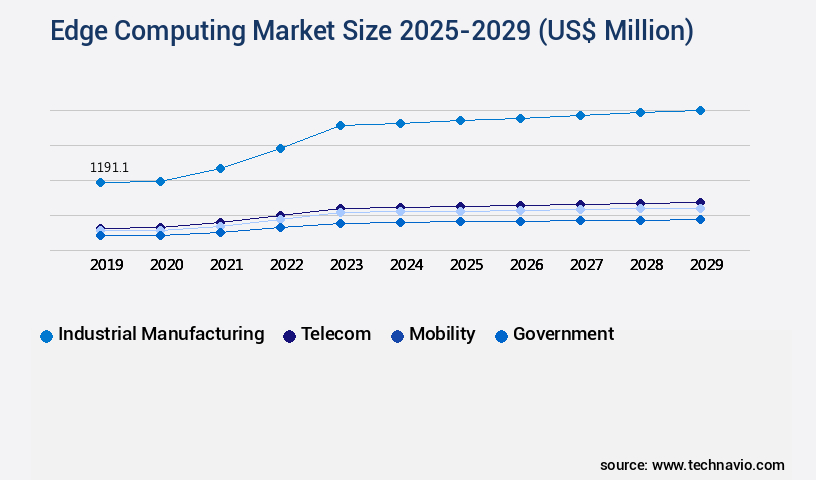
  • By End-user - Industrial manufacturing segment was valued at USD 1.19 billion in 2023
  • By Component - Hardware segment accounted for the largest market revenue share in 2023

Market Size & Forecast

  • Market Opportunities: USD 1.00 million
  • Market Future Opportunities: USD 29408.70 million
  • CAGR from 2024 to 2029 : 37.4%

Market Summary

  • The market represents a dynamic and continually evolving landscape, driven by the increasing demand for decentralized computing to minimize latency in real-time decision making. Core technologies, such as fog computing and edge analytics, are gaining traction, enabling the deployment of Industry 4.0 infrastructure and the integration of IoT devices. However, competition from low-cost centralized computing infrastructure poses a significant challenge. According to recent reports, the market is expected to account for over 30% of the total IoT infrastructure spending by 2025.
  • This trend underscores the growing importance of edge computing in addressing the demands of data-intensive applications and the need for faster, more efficient processing at the source.

What will be the Size of the Edge Computing Market during the forecast period?

Edge Computing Market Size

Get Key Insights on Market Forecast (PDF) Request Free Sample

How is the Edge Computing Market Segmented ?

The edge computing industry research report provides comprehensive data (region-wise segment analysis), with forecasts and estimates in "USD million" for the period 2025-2029, as well as historical data from 2019-2023 for the following segments.

  • End-user
    • Industrial manufacturing
    • Telecom
    • Mobility
    • Government
    • Others
  • Component
    • Hardware
    • Software
    • Services
    • Edge-managed platforms
  • Type
    • Small and medium-sized enterprises (SMEs)
    • Large enterprises
    • Others
  • Application
    • IoT applications
    • Robotics and automation
    • Predictive maintenance
    • Remote monitoring
    • Others
  • Geography
    • North America
      • US
      • Canada
    • Europe
      • France
      • Germany
      • Italy
      • UK
    • Middle East and Africa
      • Egypt
      • KSA
      • Oman
      • UAE
    • APAC
      • China
      • India
      • Japan
    • South America
      • Argentina
      • Brazil
    • Rest of World (ROW)

    By End-user Insights

    The industrial manufacturing segment is estimated to witness significant growth during the forecast period.

    Edge computing is a dynamic and evolving market, gaining significant traction in various industries, particularly manufacturing and process environments. Industrial IoT devices, automation hardware, and connected sensors and actuators are integral to these sectors, necessitating the use of edge computing infrastructure for seamless operations. According to recent studies, the adoption of edge computing in industrial applications has seen a substantial increase of 21%, underlining its growing importance. Moreover, industry experts anticipate that this trend will continue, with future growth expectations reaching 27% in the coming years. Edge computing plays a pivotal role in the implementation of Industry 4.0 infrastructure and practices, driving the digitalization and automation of manufacturing and process industries.

    Strategic partnerships between end-users and technology providers are increasingly common, as companies look to integrate edge computing into their operations. Edge computing facilitates industrial machine learning (ML) and artificial intelligence (AI) networks, enabling automation through robotics. Distributed computing, security threat modeling, software-defined networking, application performance monitoring, and fault tolerance mechanisms are some of the key technologies shaping the edge computing landscape. Moreover, edge computing offers advantages such as low-latency applications, hardware acceleration, and scalability improvements. Thermal management, edge AI deployment, data encryption methods, 5G network slicing, network function virtualization, IoT device management, cloud-edge integration, network virtualization, edge data centers, microservices architecture, and data processing latency are essential aspects of edge computing infrastructure.

    Power consumption metrics, content delivery networks, resource management strategies, real-time analytics, cybersecurity protocols, remote data storage, and sensor data aggregation are other critical components of edge computing. With the ongoing advancements in these areas, the market is poised for continued growth and innovation.

    Edge Computing Market Size

    Request Free Sample

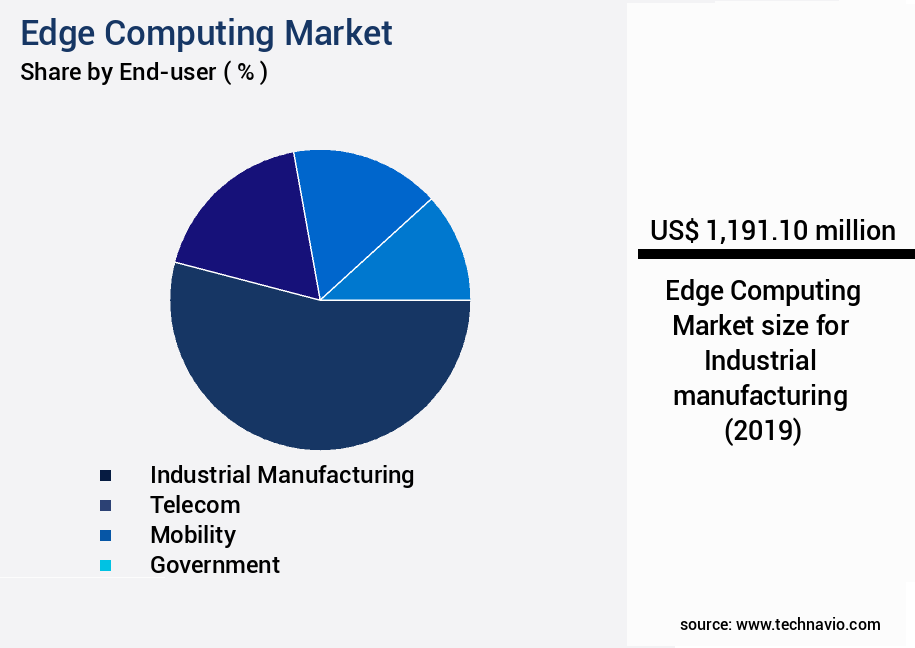
    The Industrial manufacturing segment was valued at USD 1.19 billion in 2019 and showed a gradual increase during the forecast period.

    Edge Computing Market Size

    Request Free Sample

    Regional Analysis

    North America is estimated to contribute 43% to the growth of the global market during the forecast period.Technavio’s analysts have elaborately explained the regional trends and drivers that shape the market during the forecast period.

    Edge Computing Market Share by Geography

    See How Edge Computing Market Demand is Rising in North America Request Free Sample

    The market in North America is experiencing notable expansion, fueled by the growing demand for optimized IT infrastructure in commercial and industrial sectors. The adoption of big data analytics and the Internet of Things (IoT) by end-users is a significant driving force. In the United States and Canada, numerous enterprises are prioritizing the shift from traditional core computing systems to edge computing solutions.

    This transition is further bolstered by the escalating consumption of online audio/visual content from streaming and gaming platforms. The proliferation of this content is leading to the implementation of edge computing technologies to enhance user experience and minimize latency.

    Market Dynamics

    Our researchers analyzed the data with 2024 as the base year, along with the key drivers, trends, and challenges. A holistic analysis of drivers will help companies refine their marketing strategies to gain a competitive advantage.

    The market is experiencing significant growth as businesses seek to optimize IoT device data processing at the network edge. Real-time analytics using edge computing technologies enable organizations to make faster, data-driven decisions, reducing the need for constant network traffic to centralized data centers. This approach also helps optimize network bandwidth for edge applications, making them more efficient and cost-effective. One of the key advantages of edge computing is the deployment of AI models on edge devices. By processing data locally, response times are improved, and latency is minimized. Secure data transmission in edge computing networks is another critical aspect, ensuring sensitive information remains protected.

    Managing power consumption in edge data centers is essential for maintaining scalability and cost optimization, making this infrastructure increasingly attractive for businesses. Ensuring high availability in edge computing deployments is crucial, as downtime can lead to significant losses. Edge computing is also being leveraged for content delivery networks, improving user experience and reducing the load on central servers. Remote monitoring solutions for edge devices are increasingly popular, allowing for proactive maintenance and reducing the need for on-site visits. Industrial automation is another area where edge computing is gaining traction. Applying machine learning for predictive maintenance in edge environments can significantly reduce downtime and maintenance costs.

    Implementing cybersecurity protocols for edge computing is also essential, as these systems can be vulnerable to cyberattacks. Microservices architecture for edge applications, data center thermal management strategies, and software-defined networking in edge computing environments are some of the emerging trends in this market. Hardware acceleration for edge AI applications and API gateway management for edge services are also crucial components, enhancing performance and security. Compared to traditional cloud computing, edge computing offers several advantages, including reduced latency, improved security, and increased efficiency. For instance, a study revealed that edge computing can reduce latency by up to 20x compared to cloud computing for certain applications.

    This makes edge computing an attractive option for businesses seeking to gain a competitive edge in today's data-driven economy.

    Edge Computing Market Size

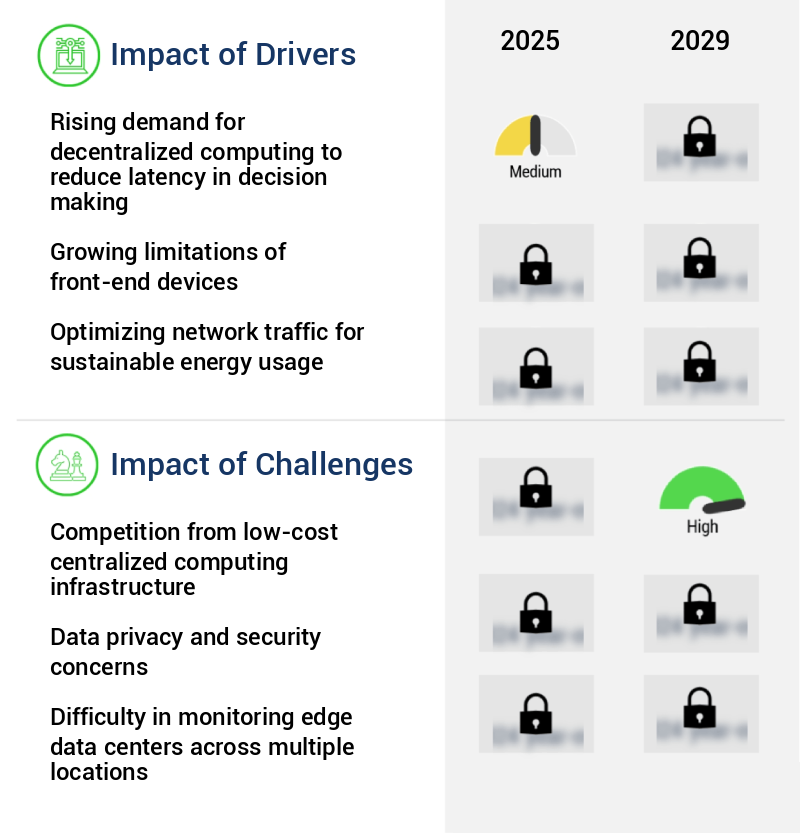
    What are the key market drivers leading to the rise in the adoption of Edge Computing Industry?

    • The surge in demand for decentralized computing solutions is the primary market driver, as this approach reduces latency and enhances the efficiency of decision-making processes. 

    • Centralized computing systems, such as cloud infrastructure, encounter latency issues due to their geographically dispersed architecture. These delays pose significant challenges for time-critical applications, including autonomous vehicles and wearables, which demand sub-25 millisecond (ms) response times. Edge computing mitigates this problem by deploying nodes near users or devices, thereby reducing latency compared to distant cloud servers. For instance, latency between Hong Kong and the US is approximately 150-170 ms one-way, while North America to India experiences even greater delays (230-290 ms) due to limited undersea cable connectivity.
    • By bringing computational power closer to the source of data generation, edge computing enhances the efficiency and responsiveness of applications, ensuring optimal performance in latency-sensitive industries.

    What are the market trends shaping the Edge Computing Industry?

    • Industry 4.0 infrastructure deployment is the current market trend. This refers to the implementation of advanced technology in manufacturing processes.

    • Industry 4.0, characterized by connected automation systems and technologies, significantly influences the industrial sector through the integration of cyber-physical systems, IoT devices, cloud computing, and cognitive computing. This transformation leads to the anticipated impact on edge computing demand. Industry 4.0 principles include machine interconnection, enabling machines and devices to communicate via IoT, and big data collection, amassing extensive data from various sensors and instrumentation for insightful decision-making.
    • The interconnectedness of machines and data-driven insights are essential components of Industry 4.0's transformative potential. By fostering seamless communication between machines and the collection and analysis of vast data, organizations can optimize manufacturing processes and enhance overall operational efficiency.

    What challenges does the Edge Computing Industry face during its growth?

    • The expansion of low-cost centralized computing infrastructure presents a significant challenge to the industry's growth trajectory. 

    • Centralized computing infrastructure, such as cloud data centers and supercomputing facilities, presents a substantial challenge to the market. These systems offer pay-as-you-go computing and storage services, making them a cost-effective alternative for businesses. The competitive landscape of cloud providers with scalable solutions and flexible pricing models limits the adoption of edge computing. However, edge computing infrastructure necessitates additional investments in hardware, network infrastructure, and skilled labor for maintenance. These costs can divert organizational focus from core applications to managing the edge environment. Despite these challenges, the market continues to evolve, with applications spanning various sectors like healthcare, manufacturing, and transportation.
    • Edge computing's ability to process data closer to the source, reducing latency and bandwidth requirements, makes it an attractive solution for organizations seeking to enhance operational efficiency and improve customer experiences. The market's dynamics and applications underscore the need for a balanced approach to infrastructure deployment, considering the unique requirements and benefits of both centralized and edge computing solutions.

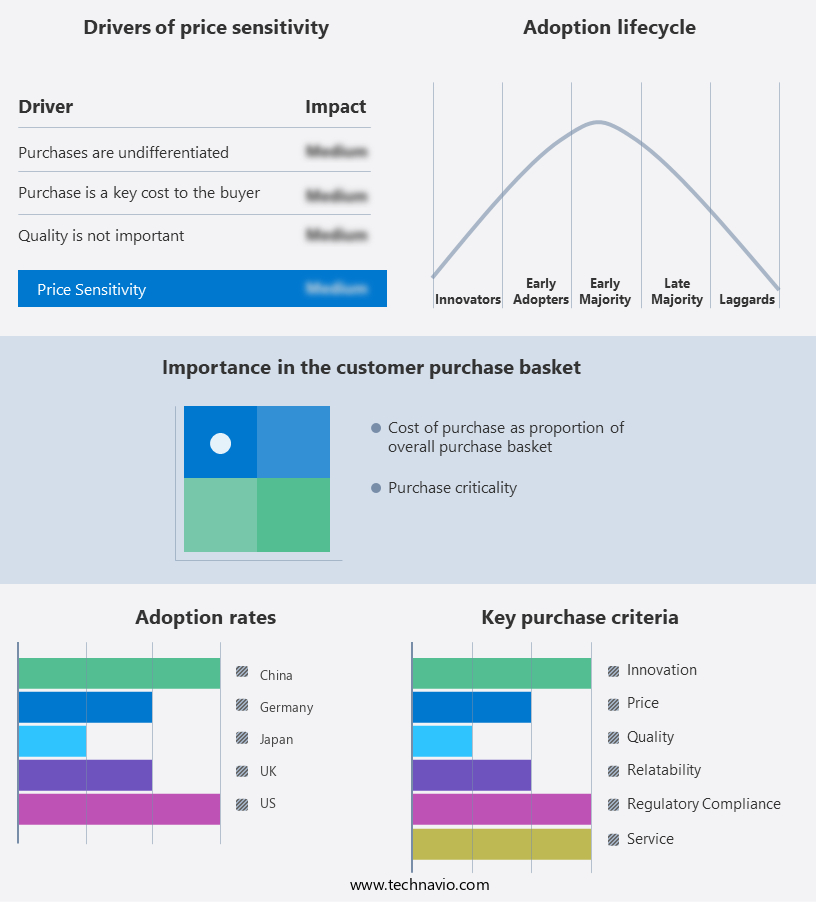
    Exclusive Technavio Analysis on Customer Landscape

    The edge computing market forecasting report includes the adoption lifecycle of the market, covering from the innovator’s stage to the laggard’s stage. It focuses on adoption rates in different regions based on penetration. Furthermore, the edge computing market report also includes key purchase criteria and drivers of price sensitivity to help companies evaluate and develop their market growth analysis strategies.

    Edge Computing Market Share by Geography

     Customer Landscape of Edge Computing Industry

    Competitive Landscape

    Companies are implementing various strategies, such as strategic alliances, edge computing market forecast, partnerships, mergers and acquisitions, geographical expansion, and product/service launches, to enhance their presence in the industry.

    Aarna Networks Inc. - The company provides edge computing solutions via Google Distributed Cloud Edge, enabling businesses to process data closer to its source for improved efficiency and reduced latency. This approach empowers organizations to make real-time decisions and enhance customer experiences. Google's edge computing services facilitate the integration of AI and machine learning capabilities at the edge, fostering innovation and driving digital transformation.

    The industry research and growth report includes detailed analyses of the competitive landscape of the market and information about key companies, including:

    • Aarna Networks Inc.
    • Alphabet Inc.
    • Amazon.com Inc.
    • Arrow Electronics Inc.
    • Capgemini Services SAS
    • Cisco Systems Inc.
    • ClearBlade Inc.
    • Dell Technologies Inc.
    • EdgeConneX Inc.
    • General Electric Co.
    • Hewlett Packard Enterprise Co.
    • Huawei Technologies Co. Ltd.
    • Intel Corp.
    • International Business Machines Corp.
    • Microsoft Corp.
    • Nokia Corp.
    • NVIDIA Corp.
    • Renesas Electronics Corp.
    • Schneider Electric SE
    • Telefonaktiebolaget LM Ericsson

    Qualitative and quantitative analysis of companies has been conducted to help clients understand the wider business environment as well as the strengths and weaknesses of key industry players. Data is qualitatively analyzed to categorize companies as pure play, category-focused, industry-focused, and diversified; it is quantitatively analyzed to categorize companies as dominant, leading, strong, tentative, and weak.

    Recent Development and News in Edge Computing Market

    • In January 2024, IBM announced the launch of its new edge computing platform, "IBM Edge Application Manager," designed to help businesses manage and deploy applications across multiple edge locations. This solution aims to reduce latency and improve data processing for industries such as manufacturing and healthcare (IBM Press Release, 2024).
    • In March 2024, Microsoft and NVIDIA collaborated to integrate Azure IoT Edge with NVIDIA Jetson, enabling real-time AI processing at the edge for industries like transportation and retail (Microsoft News Center, 2024).
    • In May 2024, Intel invested USD20 billion in its new "Intel Foundry Services" to expand its edge computing capabilities, aiming to manufacture chips for other tech companies and boost its market share in the edge computing sector (Intel Press Release, 2024).
    • In February 2025, Google Cloud and Siemens announced a partnership to offer edge computing solutions for industrial applications, integrating Google Cloud's edge computing capabilities with Siemens' industrial IoT platform (Google Cloud Blog, 2025).

    Dive into Technavio’s robust research methodology, blending expert interviews, extensive data synthesis, and validated models for unparalleled Edge Computing Market insights. See full methodology.

    Market Scope

    Report Coverage

    Details

    Page number

    261

    Base year

    2024

    Historic period

    2019-2023

    Forecast period

    2025-2029

    Growth momentum & CAGR

    Accelerate at a CAGR of 37.4%

    Market growth 2025-2029

    USD 29408.7 million

    Market structure

    Fragmented

    YoY growth 2024-2025(%)

    28.1

    Key countries

    US, Canada, Germany, UK, Italy, France, China, India, Japan, Brazil, Egypt, UAE, Oman, Argentina, and KSA

    Competitive landscape

    Leading Companies, Market Positioning of Companies, Competitive Strategies, and Industry Risks

    Request Free Sample

    Research Analyst Overview

    • In the rapidly evolving technological landscape, edge computing has emerged as a game-changer, bridging the gap between cloud computing and distributed computing. This approach enables data processing at the source, closer to the point of origin, addressing the challenges of bandwidth optimization and data center optimization. The market is characterized by continuous innovation, with key trends including distributed computing, security threat modeling, software-defined networking, and application performance monitoring. Fog computing, hardware acceleration, and low-latency applications are driving the adoption of edge computing in various industries. Fault tolerance mechanisms, container orchestration, and deployment automation are essential components of edge computing infrastructure, ensuring scalability improvements and thermal management.
    • Edge AI deployment, data encryption methods, and 5G network slicing are revolutionizing the way data is processed and transmitted, enabling real-time analytics and cybersecurity protocols. Network edge devices, API gateway management, and power consumption metrics are crucial aspects of edge computing, optimizing network throughput and resource management strategies. The integration of edge data centers, microservices architecture, and cloud-edge solutions further enhances the capabilities of edge computing, addressing data processing latency and network virtualization. The market is marked by the deployment of advanced network function virtualization, IoT device management, and edge server infrastructure. Remote data storage and sensor data aggregation are key areas of focus, ensuring efficient data handling and processing.
    • In summary, the market is a dynamic and evolving ecosystem, addressing the demands of modern businesses for faster, more secure, and efficient data processing. The integration of various technologies, from distributed computing and security to AI and 5G, is shaping the future of edge computing and redefining the way businesses operate.

    What are the Key Data Covered in this Edge Computing Market Research and Growth Report?

    • What is the expected growth of the Edge Computing Market between 2025 and 2029?

      • USD 29.41 billion, at a CAGR of 37.4%

    • What segmentation does the market report cover?

      • The report segmented by End-user (Industrial manufacturing, Telecom, Mobility, Government, and Others), Component (Hardware, Software, Services, and Edge-managed platforms), Type (Small and medium-sized enterprises (SMEs), Large enterprises, and Others), Application (IoT applications, Robotics and automation, Predictive maintenance, Remote monitoring, and Others), and Geography (North America, Europe, APAC, South America, and Middle East and Africa)

    • Which regions are analyzed in the report?

      • North America, Europe, APAC, South America, and Middle East and Africa

    • What are the key growth drivers and market challenges?

      • Rising demand for decentralized computing to reduce latency in decision making, Competition from low-cost centralized computing infrastructure

    • Who are the major players in the Edge Computing Market?

      • Key Companies Aarna Networks Inc., Alphabet Inc., Amazon.com Inc., Arrow Electronics Inc., Capgemini Services SAS, Cisco Systems Inc., ClearBlade Inc., Dell Technologies Inc., EdgeConneX Inc., General Electric Co., Hewlett Packard Enterprise Co., Huawei Technologies Co. Ltd., Intel Corp., International Business Machines Corp., Microsoft Corp., Nokia Corp., NVIDIA Corp., Renesas Electronics Corp., Schneider Electric SE, and Telefonaktiebolaget LM Ericsson

    Market Research Insights

    • The market continues to evolve, with a growing emphasis on enhancing security and optimizing performance. According to recent estimates, the global edge device security market is projected to reach USD12.6 billion by 2026, up from USD3.2 billion in 2021, representing a compound annual growth rate (CAGR) of 25.6% during the forecast period. This growth is driven by the increasing adoption of edge devices and the need to secure data and applications at the network edge. Moreover, performance optimization is another significant area of focus in the market. Energy efficiency gains, achieved through the use of machine learning models and server virtualization, are expected to reduce operational costs and improve application response times.
    • For instance, data centers can save up to 40% of their energy consumption through efficient cooling systems and network capacity planning. With network traffic patterns continuing to grow, capacity scaling and cost optimization are critical for businesses to maintain system uptime and meet compliance requirements.

    We can help! Our analysts can customize this edge computing market research report to meet your requirements.

    Get in touch

    1 Executive Summary

    • 1.1 Market overview
      • Executive Summary - Chart on Market Overview
      • Executive Summary - Data Table on Market Overview
      • Executive Summary - Chart on Global Market Characteristics
      • Executive Summary - Chart on Market by Geography
      • Executive Summary - Chart on Market Segmentation by End-user
      • Executive Summary - Chart on Market Segmentation by Component
      • Executive Summary - Chart on Market Segmentation by Type
      • Executive Summary - Chart on Market Segmentation by Application
      • Executive Summary - Chart on Incremental Growth
      • Executive Summary - Data Table on Incremental Growth
      • Executive Summary - Chart on Company Market Positioning

    2 Technavio Analysis

    • 2.1 Analysis of price sensitivity, lifecycle, customer purchase basket, adoption rates, and purchase criteria
      • Analysis of price sensitivity, lifecycle, customer purchase basket, adoption rates, and purchase criteria
    • 2.2 Criticality of inputs and Factors of differentiation
      • Overview on criticality of inputs and factors of differentiation
    • 2.3 Factors of disruption
      • Overview on factors of disruption
    • 2.4 Impact of drivers and challenges
      • Impact of drivers and challenges in 2024 and 2029

    3 Market Landscape

    • 3.1 Market ecosystem
      • Parent Market
      • Data Table on - Parent Market
    • 3.2 Market characteristics
      • Market characteristics analysis
    • 3.3 Value chain analysis
      • Value chain analysis

    4 Market Sizing

    • 4.1 Market definition
      • Offerings of companies included in the market definition
    • 4.2 Market segment analysis
      • Market segments
    • 4.3 Market size 2024
      • 4.4 Market outlook: Forecast for 2024-2029
        • Chart on Global - Market size and forecast 2024-2029 ($ million)
        • Data Table on Global - Market size and forecast 2024-2029 ($ million)
        • Chart on Global Market: Year-over-year growth 2024-2029 (%)
        • Data Table on Global Market: Year-over-year growth 2024-2029 (%)

      5 Historic Market Size

      • 5.1 Global Edge Computing Market 2019 - 2023
        • Historic Market Size - Data Table on Global Edge Computing Market 2019 - 2023 ($ million)
      • 5.2 End-user segment analysis 2019 - 2023
        • Historic Market Size - End-user Segment 2019 - 2023 ($ million)
      • 5.3 Component segment analysis 2019 - 2023
        • Historic Market Size - Component Segment 2019 - 2023 ($ million)
      • 5.4 Type segment analysis 2019 - 2023
        • Historic Market Size - Type Segment 2019 - 2023 ($ million)
      • 5.5 Application segment analysis 2019 - 2023
        • Historic Market Size - Application Segment 2019 - 2023 ($ million)
      • 5.6 Geography segment analysis 2019 - 2023
        • Historic Market Size - Geography Segment 2019 - 2023 ($ million)
      • 5.7 Country segment analysis 2019 - 2023
        • Historic Market Size - Country Segment 2019 - 2023 ($ million)

      6 Qualitative Analysis

      • 6.1 Impact of AI on global edge computing market

        7 Five Forces Analysis

        • 7.1 Five forces summary
          • Five forces analysis - Comparison between 2024 and 2029
        • 7.2 Bargaining power of buyers
          • Bargaining power of buyers - Impact of key factors 2024 and 2029
        • 7.3 Bargaining power of suppliers
          • Bargaining power of suppliers - Impact of key factors in 2024 and 2029
        • 7.4 Threat of new entrants
          • Threat of new entrants - Impact of key factors in 2024 and 2029
        • 7.5 Threat of substitutes
          • Threat of substitutes - Impact of key factors in 2024 and 2029
        • 7.6 Threat of rivalry
          • Threat of rivalry - Impact of key factors in 2024 and 2029
        • 7.7 Market condition
          • Chart on Market condition - Five forces 2024 and 2029

        8 Market Segmentation by End-user

        • 8.1 Market segments
          • Chart on End-user - Market share 2024-2029 (%)
          • Data Table on End-user - Market share 2024-2029 (%)
        • 8.2 Comparison by End-user
          • Chart on Comparison by End-user
          • Data Table on Comparison by End-user
        • 8.3 Industrial manufacturing - Market size and forecast 2024-2029
          • Chart on Industrial manufacturing - Market size and forecast 2024-2029 ($ million)
          • Data Table on Industrial manufacturing - Market size and forecast 2024-2029 ($ million)
          • Chart on Industrial manufacturing - Year-over-year growth 2024-2029 (%)
          • Data Table on Industrial manufacturing - Year-over-year growth 2024-2029 (%)
        • 8.4 Telecom - Market size and forecast 2024-2029
          • Chart on Telecom - Market size and forecast 2024-2029 ($ million)
          • Data Table on Telecom - Market size and forecast 2024-2029 ($ million)
          • Chart on Telecom - Year-over-year growth 2024-2029 (%)
          • Data Table on Telecom - Year-over-year growth 2024-2029 (%)
        • 8.5 Mobility - Market size and forecast 2024-2029
          • Chart on Mobility - Market size and forecast 2024-2029 ($ million)
          • Data Table on Mobility - Market size and forecast 2024-2029 ($ million)
          • Chart on Mobility - Year-over-year growth 2024-2029 (%)
          • Data Table on Mobility - Year-over-year growth 2024-2029 (%)
        • 8.6 Government - Market size and forecast 2024-2029
          • Chart on Government - Market size and forecast 2024-2029 ($ million)
          • Data Table on Government - Market size and forecast 2024-2029 ($ million)
          • Chart on Government - Year-over-year growth 2024-2029 (%)
          • Data Table on Government - Year-over-year growth 2024-2029 (%)
        • 8.7 Others - Market size and forecast 2024-2029
          • Chart on Others - Market size and forecast 2024-2029 ($ million)
          • Data Table on Others - Market size and forecast 2024-2029 ($ million)
          • Chart on Others - Year-over-year growth 2024-2029 (%)
          • Data Table on Others - Year-over-year growth 2024-2029 (%)
        • 8.8 Market opportunity by End-user
          • Market opportunity by End-user ($ million)
          • Data Table on Market opportunity by End-user ($ million)

        9 Market Segmentation by Component

        • 9.1 Market segments
          • Chart on Component - Market share 2024-2029 (%)
          • Data Table on Component - Market share 2024-2029 (%)
        • 9.2 Comparison by Component
          • Chart on Comparison by Component
          • Data Table on Comparison by Component
        • 9.3 Hardware - Market size and forecast 2024-2029
          • Chart on Hardware - Market size and forecast 2024-2029 ($ million)
          • Data Table on Hardware - Market size and forecast 2024-2029 ($ million)
          • Chart on Hardware - Year-over-year growth 2024-2029 (%)
          • Data Table on Hardware - Year-over-year growth 2024-2029 (%)
        • 9.4 Software - Market size and forecast 2024-2029
          • Chart on Software - Market size and forecast 2024-2029 ($ million)
          • Data Table on Software - Market size and forecast 2024-2029 ($ million)
          • Chart on Software - Year-over-year growth 2024-2029 (%)
          • Data Table on Software - Year-over-year growth 2024-2029 (%)
        • 9.5 Services - Market size and forecast 2024-2029
          • Chart on Services - Market size and forecast 2024-2029 ($ million)
          • Data Table on Services - Market size and forecast 2024-2029 ($ million)
          • Chart on Services - Year-over-year growth 2024-2029 (%)
          • Data Table on Services - Year-over-year growth 2024-2029 (%)
        • 9.6 Edge-managed platforms - Market size and forecast 2024-2029
          • Chart on Edge-managed platforms - Market size and forecast 2024-2029 ($ million)
          • Data Table on Edge-managed platforms - Market size and forecast 2024-2029 ($ million)
          • Chart on Edge-managed platforms - Year-over-year growth 2024-2029 (%)
          • Data Table on Edge-managed platforms - Year-over-year growth 2024-2029 (%)
        • 9.7 Market opportunity by Component
          • Market opportunity by Component ($ million)
          • Data Table on Market opportunity by Component ($ million)

        10 Market Segmentation by Type

        • 10.1 Market segments
          • Chart on Type - Market share 2024-2029 (%)
          • Data Table on Type - Market share 2024-2029 (%)
        • 10.2 Comparison by Type
          • Chart on Comparison by Type
          • Data Table on Comparison by Type
        • 10.3 Small and medium-sized enterprises (SMEs) - Market size and forecast 2024-2029
          • Chart on Small and medium-sized enterprises (SMEs) - Market size and forecast 2024-2029 ($ million)
          • Data Table on Small and medium-sized enterprises (SMEs) - Market size and forecast 2024-2029 ($ million)
          • Chart on Small and medium-sized enterprises (SMEs) - Year-over-year growth 2024-2029 (%)
          • Data Table on Small and medium-sized enterprises (SMEs) - Year-over-year growth 2024-2029 (%)
        • 10.4 Large enterprises - Market size and forecast 2024-2029
          • Chart on Large enterprises - Market size and forecast 2024-2029 ($ million)
          • Data Table on Large enterprises - Market size and forecast 2024-2029 ($ million)
          • Chart on Large enterprises - Year-over-year growth 2024-2029 (%)
          • Data Table on Large enterprises - Year-over-year growth 2024-2029 (%)
        • 10.5 Others - Market size and forecast 2024-2029
          • Chart on Others - Market size and forecast 2024-2029 ($ million)
          • Data Table on Others - Market size and forecast 2024-2029 ($ million)
          • Chart on Others - Year-over-year growth 2024-2029 (%)
          • Data Table on Others - Year-over-year growth 2024-2029 (%)
        • 10.6 Market opportunity by Type
          • Market opportunity by Type ($ million)
          • Data Table on Market opportunity by Type ($ million)

        11 Market Segmentation by Application

        • 11.1 Market segments
          • Chart on Application - Market share 2024-2029 (%)
          • Data Table on Application - Market share 2024-2029 (%)
        • 11.2 Comparison by Application
          • Chart on Comparison by Application
          • Data Table on Comparison by Application
        • 11.3 IoT applications - Market size and forecast 2024-2029
          • Chart on IoT applications - Market size and forecast 2024-2029 ($ million)
          • Data Table on IoT applications - Market size and forecast 2024-2029 ($ million)
          • Chart on IoT applications - Year-over-year growth 2024-2029 (%)
          • Data Table on IoT applications - Year-over-year growth 2024-2029 (%)
        • 11.4 Robotics and automation - Market size and forecast 2024-2029
          • Chart on Robotics and automation - Market size and forecast 2024-2029 ($ million)
          • Data Table on Robotics and automation - Market size and forecast 2024-2029 ($ million)
          • Chart on Robotics and automation - Year-over-year growth 2024-2029 (%)
          • Data Table on Robotics and automation - Year-over-year growth 2024-2029 (%)
        • 11.5 Predictive maintenance - Market size and forecast 2024-2029
          • Chart on Predictive maintenance - Market size and forecast 2024-2029 ($ million)
          • Data Table on Predictive maintenance - Market size and forecast 2024-2029 ($ million)
          • Chart on Predictive maintenance - Year-over-year growth 2024-2029 (%)
          • Data Table on Predictive maintenance - Year-over-year growth 2024-2029 (%)
        • 11.6 Remote monitoring - Market size and forecast 2024-2029
          • Chart on Remote monitoring - Market size and forecast 2024-2029 ($ million)
          • Data Table on Remote monitoring - Market size and forecast 2024-2029 ($ million)
          • Chart on Remote monitoring - Year-over-year growth 2024-2029 (%)
          • Data Table on Remote monitoring - Year-over-year growth 2024-2029 (%)
        • 11.7 Others - Market size and forecast 2024-2029
          • Chart on Others - Market size and forecast 2024-2029 ($ million)
          • Data Table on Others - Market size and forecast 2024-2029 ($ million)
          • Chart on Others - Year-over-year growth 2024-2029 (%)
          • Data Table on Others - Year-over-year growth 2024-2029 (%)
        • 11.8 Market opportunity by Application
          • Market opportunity by Application ($ million)
          • Data Table on Market opportunity by Application ($ million)

        12 Customer Landscape

        • 12.1 Customer landscape overview
          • Analysis of price sensitivity, lifecycle, customer purchase basket, adoption rates, and purchase criteria

        13 Geographic Landscape

        • 13.1 Brazil - Market size and forecast (2024-2029)
          • Chart on Brazil - Market size and forecast (2024-2029) ($ million)
          • Data Table on Brazil - Market size and forecast (2024-2029) ($ million)
          • Chart on Brazil - Year-over-year growth (2024-2029) (%)
          • Data Table on Brazil - Year-over-year growth (2024-2029) (%)
          • Chart on Market share by geography 2024-2029 (%)
          • Data Table on Market share by geography 2024-2029 (%)
        • 13.2 Germany - Market size and forecast (2024-2029)
          • Chart on Germany - Market size and forecast (2024-2029) ($ million)
          • Data Table on Germany - Market size and forecast (2024-2029) ($ million)
          • Chart on Germany - Year-over-year growth (2024-2029) (%)
          • Data Table on Germany - Year-over-year growth (2024-2029) (%)
          • Chart on Geographic comparison
          • Data Table on Geographic comparison
        • 13.3 Canada - Market size and forecast (2024-2029)
          • Chart on Canada - Market size and forecast (2024-2029) ($ million)
          • Data Table on Canada - Market size and forecast (2024-2029) ($ million)
          • Chart on Canada - Year-over-year growth (2024-2029) (%)
          • Data Table on Canada - Year-over-year growth (2024-2029) (%)
          • Chart on North America - Market size and forecast 2024-2029 ($ million)
          • Data Table on North America - Market size and forecast 2024-2029 ($ million)
          • Chart on North America - Year-over-year growth 2024-2029 (%)
          • Data Table on North America - Year-over-year growth 2024-2029 (%)
        • 13.4 Japan - Market size and forecast (2024-2029)
          • Chart on Japan - Market size and forecast (2024-2029) ($ million)
          • Data Table on Japan - Market size and forecast (2024-2029) ($ million)
          • Chart on Japan - Year-over-year growth (2024-2029) (%)
          • Data Table on Japan - Year-over-year growth (2024-2029) (%)
          • Chart on Europe - Market size and forecast 2024-2029 ($ million)
          • Data Table on Europe - Market size and forecast 2024-2029 ($ million)
          • Chart on Europe - Year-over-year growth 2024-2029 (%)
          • Data Table on Europe - Year-over-year growth 2024-2029 (%)
        • 13.5 UK - Market size and forecast (2024-2029)
          • Chart on UK - Market size and forecast (2024-2029) ($ million)
          • Data Table on UK - Market size and forecast (2024-2029) ($ million)
          • Chart on UK - Year-over-year growth (2024-2029) (%)
          • Data Table on UK - Year-over-year growth (2024-2029) (%)
          • Chart on APAC - Market size and forecast 2024-2029 ($ million)
          • Data Table on APAC - Market size and forecast 2024-2029 ($ million)
          • Chart on APAC - Year-over-year growth 2024-2029 (%)
          • Data Table on APAC - Year-over-year growth 2024-2029 (%)
        • 13.6 China - Market size and forecast (2024-2029)
          • Chart on China - Market size and forecast (2024-2029) ($ million)
          • Data Table on China - Market size and forecast (2024-2029) ($ million)
          • Chart on China - Year-over-year growth (2024-2029) (%)
          • Data Table on China - Year-over-year growth (2024-2029) (%)
          • Chart on South America - Market size and forecast 2024-2029 ($ million)
          • Data Table on South America - Market size and forecast 2024-2029 ($ million)
          • Chart on South America - Year-over-year growth 2024-2029 (%)
          • Data Table on South America - Year-over-year growth 2024-2029 (%)
        • 13.7 France - Market size and forecast (2024-2029)
          • Chart on France - Market size and forecast (2024-2029) ($ million)
          • Data Table on France - Market size and forecast (2024-2029) ($ million)
          • Chart on France - Year-over-year growth (2024-2029) (%)
          • Data Table on France - Year-over-year growth (2024-2029) (%)
          • Chart on Middle East and Africa - Market size and forecast 2024-2029 ($ million)
          • Data Table on Middle East and Africa - Market size and forecast 2024-2029 ($ million)
          • Chart on Middle East and Africa - Year-over-year growth 2024-2029 (%)
          • Data Table on Middle East and Africa - Year-over-year growth 2024-2029 (%)
        • 13.8 India - Market size and forecast (2024-2029)
          • Chart on India - Market size and forecast (2024-2029) ($ million)
          • Data Table on India - Market size and forecast (2024-2029) ($ million)
          • Chart on India - Year-over-year growth (2024-2029) (%)
          • Data Table on India - Year-over-year growth (2024-2029) (%)
          • Chart on US - Market size and forecast 2024-2029 ($ million)
          • Data Table on US - Market size and forecast 2024-2029 ($ million)
          • Chart on US - Year-over-year growth 2024-2029 (%)
          • Data Table on US - Year-over-year growth 2024-2029 (%)
        • 13.9 Italy - Market size and forecast (2024-2029)
          • Chart on Italy - Market size and forecast (2024-2029) ($ million)
          • Data Table on Italy - Market size and forecast (2024-2029) ($ million)
          • Chart on Italy - Year-over-year growth (2024-2029) (%)
          • Data Table on Italy - Year-over-year growth (2024-2029) (%)
          • Chart on Germany - Market size and forecast 2024-2029 ($ million)
          • Data Table on Germany - Market size and forecast 2024-2029 ($ million)
          • Chart on Germany - Year-over-year growth 2024-2029 (%)
          • Data Table on Germany - Year-over-year growth 2024-2029 (%)
        • 13.10 Canada - Market size and forecast 2024-2029
          • Chart on Canada - Market size and forecast 2024-2029 ($ million)
          • Data Table on Canada - Market size and forecast 2024-2029 ($ million)
          • Chart on Canada - Year-over-year growth 2024-2029 (%)
          • Data Table on Canada - Year-over-year growth 2024-2029 (%)
        • 13.11 Japan - Market size and forecast 2024-2029
          • Chart on Japan - Market size and forecast 2024-2029 ($ million)
          • Data Table on Japan - Market size and forecast 2024-2029 ($ million)
          • Chart on Japan - Year-over-year growth 2024-2029 (%)
          • Data Table on Japan - Year-over-year growth 2024-2029 (%)
        • 13.12 UK - Market size and forecast 2024-2029
          • Chart on UK - Market size and forecast 2024-2029 ($ million)
          • Data Table on UK - Market size and forecast 2024-2029 ($ million)
          • Chart on UK - Year-over-year growth 2024-2029 (%)
          • Data Table on UK - Year-over-year growth 2024-2029 (%)
        • 13.13 China - Market size and forecast 2024-2029
          • Chart on China - Market size and forecast 2024-2029 ($ million)
          • Data Table on China - Market size and forecast 2024-2029 ($ million)
          • Chart on China - Year-over-year growth 2024-2029 (%)
          • Data Table on China - Year-over-year growth 2024-2029 (%)
        • 13.14 France - Market size and forecast 2024-2029
          • Chart on France - Market size and forecast 2024-2029 ($ million)
          • Data Table on France - Market size and forecast 2024-2029 ($ million)
          • Chart on France - Year-over-year growth 2024-2029 (%)
          • Data Table on France - Year-over-year growth 2024-2029 (%)
        • 13.15 India - Market size and forecast 2024-2029
          • Chart on India - Market size and forecast 2024-2029 ($ million)
          • Data Table on India - Market size and forecast 2024-2029 ($ million)
          • Chart on India - Year-over-year growth 2024-2029 (%)
          • Data Table on India - Year-over-year growth 2024-2029 (%)
        • 13.16 Italy - Market size and forecast 2024-2029
          • Chart on Italy - Market size and forecast 2024-2029 ($ million)
          • Data Table on Italy - Market size and forecast 2024-2029 ($ million)
          • Chart on Italy - Year-over-year growth 2024-2029 (%)
          • Data Table on Italy - Year-over-year growth 2024-2029 (%)
        • 13.17 Brazil - Market size and forecast 2024-2029
          • Chart on Brazil - Market size and forecast 2024-2029 ($ million)
          • Data Table on Brazil - Market size and forecast 2024-2029 ($ million)
          • Chart on Brazil - Year-over-year growth 2024-2029 (%)
          • Data Table on Brazil - Year-over-year growth 2024-2029 (%)
        • 13.18 Market opportunity by geography
          • Market opportunity by geography ($ million)
          • Data Tables on Market opportunity by geography ($ million)
        • 13.19 US - Market size and forecast (2024-2029)
          • Chart on US - Market size and forecast (2024-2029) ($ million)
          • Data Table on US - Market size and forecast (2024-2029) ($ million)
          • Chart on US - Year-over-year growth (2024-2029) (%)
          • Data Table on US - Year-over-year growth (2024-2029) (%)

        14 Drivers, Challenges, and Opportunity/Restraints

        • 14.1 Market drivers
          • 14.2 Market challenges
            • 14.3 Impact of drivers and challenges
              • Impact of drivers and challenges in 2024 and 2029
            • 14.4 Market opportunities/restraints

              15 Competitive Landscape

              • 15.1 Overview
                • 15.2 Competitive Landscape
                  • Overview on criticality of inputs and factors of differentiation
                • 15.3 Landscape disruption
                  • Overview on factors of disruption
                • 15.4 Industry risks
                  • Impact of key risks on business

                16 Competitive Analysis

                • 16.1 Companies profiled
                  • Companies covered
                • 16.2 Company ranking index
                  • Company ranking index
                • 16.3 Market positioning of companies
                  • Matrix on companies position and classification
                • 16.4 Alphabet Inc.
                  • Alphabet Inc. - Overview
                  • Alphabet Inc. - Business segments
                  • Alphabet Inc. - Key offerings
                  • Alphabet Inc. - Segment focus
                  • SWOT
                • 16.5 Amazon.com Inc.
                  • Amazon.com Inc. - Overview
                  • Amazon.com Inc. - Business segments
                  • Amazon.com Inc. - Key news
                  • Amazon.com Inc. - Key offerings
                  • Amazon.com Inc. - Segment focus
                  • SWOT
                • 16.6 Arrow Electronics Inc.
                  • Arrow Electronics Inc. - Overview
                  • Arrow Electronics Inc. - Business segments
                  • Arrow Electronics Inc. - Key news
                  • Arrow Electronics Inc. - Key offerings
                  • Arrow Electronics Inc. - Segment focus
                  • SWOT
                • 16.7 Capgemini Services SAS
                  • Capgemini Services SAS - Overview
                  • Capgemini Services SAS - Business segments
                  • Capgemini Services SAS - Key news
                  • Capgemini Services SAS - Key offerings
                  • Capgemini Services SAS - Segment focus
                  • SWOT
                • 16.8 Cisco Systems Inc.
                  • Cisco Systems Inc. - Overview
                  • Cisco Systems Inc. - Business segments
                  • Cisco Systems Inc. - Key news
                  • Cisco Systems Inc. - Key offerings
                  • Cisco Systems Inc. - Segment focus
                  • SWOT
                • 16.9 ClearBlade Inc.
                  • ClearBlade Inc. - Overview
                  • ClearBlade Inc. - Product / Service
                  • ClearBlade Inc. - Key offerings
                  • SWOT
                • 16.10 Dell Technologies Inc.
                  • Dell Technologies Inc. - Overview
                  • Dell Technologies Inc. - Business segments
                  • Dell Technologies Inc. - Key offerings
                  • Dell Technologies Inc. - Segment focus
                  • SWOT
                • 16.11 EdgeConneX Inc.
                  • EdgeConneX Inc. - Overview
                  • EdgeConneX Inc. - Product / Service
                  • EdgeConneX Inc. - Key offerings
                  • SWOT
                • 16.12 General Electric Co.
                  • General Electric Co. - Overview
                  • General Electric Co. - Business segments
                  • General Electric Co. - Key news
                  • General Electric Co. - Key offerings
                  • General Electric Co. - Segment focus
                  • SWOT
                • 16.13 Hewlett Packard Enterprise Co.
                  • Hewlett Packard Enterprise Co. - Overview
                  • Hewlett Packard Enterprise Co. - Business segments
                  • Hewlett Packard Enterprise Co. - Key news
                  • Hewlett Packard Enterprise Co. - Key offerings
                  • Hewlett Packard Enterprise Co. - Segment focus
                  • SWOT
                • 16.14 Huawei Technologies Co. Ltd.
                  • Huawei Technologies Co. Ltd. - Overview
                  • Huawei Technologies Co. Ltd. - Product / Service
                  • Huawei Technologies Co. Ltd. - Key news
                  • Huawei Technologies Co. Ltd. - Key offerings
                  • SWOT
                • 16.15 Intel Corp.
                  • Intel Corp. - Overview
                  • Intel Corp. - Business segments
                  • Intel Corp. - Key news
                  • Intel Corp. - Key offerings
                  • Intel Corp. - Segment focus
                  • SWOT
                • 16.16 International Business Machines Corp.
                  • International Business Machines Corp. - Overview
                  • International Business Machines Corp. - Business segments
                  • International Business Machines Corp. - Key news
                  • International Business Machines Corp. - Key offerings
                  • International Business Machines Corp. - Segment focus
                  • SWOT
                • 16.17 Microsoft Corp.
                  • Microsoft Corp. - Overview
                  • Microsoft Corp. - Business segments
                  • Microsoft Corp. - Key news
                  • Microsoft Corp. - Key offerings
                  • Microsoft Corp. - Segment focus
                  • SWOT
                • 16.18 Telefonaktiebolaget LM Ericsson
                  • Telefonaktiebolaget LM Ericsson - Overview
                  • Telefonaktiebolaget LM Ericsson - Business segments
                  • Telefonaktiebolaget LM Ericsson - Key news
                  • Telefonaktiebolaget LM Ericsson - Key offerings
                  • Telefonaktiebolaget LM Ericsson - Segment focus
                  • SWOT

                17 Appendix

                • 17.1 Scope of the report
                  • 17.2 Inclusions and exclusions checklist
                    • Inclusions checklist
                    • Exclusions checklist
                  • 17.3 Currency conversion rates for US$
                    • Currency conversion rates for US$
                  • 17.4 Research methodology
                    • Research methodology
                  • 17.5 Data procurement
                    • Information sources
                  • 17.6 Data validation
                    • Data validation
                  • 17.7 Validation techniques employed for market sizing
                    • Validation techniques employed for market sizing
                  • 17.8 Data synthesis
                    • Data synthesis
                  • 17.9 360 degree market analysis
                    • 360 degree market analysis
                  • 17.10 List of abbreviations
                    • List of abbreviations

                  Research Methodology

                  Technavio presents a detailed picture of the market by way of study, synthesis, and summation of data from multiple sources. The analysts have presented the various facets of the market with a particular focus on identifying the key industry influencers. The data thus presented is comprehensive, reliable, and the result of extensive research, both primary and secondary.

                  INFORMATION SOURCES

                  Primary sources

                  • Manufacturers and suppliers
                  • Channel partners
                  • Industry experts
                  • Strategic decision makers

                  Secondary sources

                  • Industry journals and periodicals
                  • Government data
                  • Financial reports of key industry players
                  • Historical data
                  • Press releases

                  DATA ANALYSIS

                  Data Synthesis

                  • Collation of data
                  • Estimation of key figures
                  • Analysis of derived insights

                  Data Validation

                  • Triangulation with data models
                  • Reference against proprietary databases
                  • Corroboration with industry experts

                  REPORT WRITING

                  Qualitative

                  • Market drivers
                  • Market challenges
                  • Market trends
                  • Five forces analysis

                  Quantitative

                  • Market size and forecast
                  • Market segmentation
                  • Geographical insights
                  • Competitive landscape

                  Interested in this report?

                  Get your sample now to see our research methodology and insights!

                  Download Now

                  Frequently Asked Questions

                  Edge Computing market growth will increase by $ 29408.7 mn during 2025-2029 .

                  The Edge Computing market is expected to grow at a CAGR of 37.4% during 2025-2029 .

                  Edge Computing market is segmented by End-user( Industrial manufacturing, Telecom, Mobility, Government, Others) Component( Hardware, Software, Services, Edge-managed platforms) Type( Small and medium-sized enterprises (SMEs), Large enterprises, Others, South America, Middle East and Africa)

                  Aarna Networks Inc., Alphabet Inc., Amazon.com Inc., Arrow Electronics Inc., Capgemini Services SAS, Cisco Systems Inc., ClearBlade Inc., Dell Technologies Inc., EdgeConneX Inc., General Electric Co., Hewlett Packard Enterprise Co., Huawei Technologies Co. Ltd., Intel Corp., International Business Machines Corp., Microsoft Corp., Nokia Corp., NVIDIA Corp., Renesas Electronics Corp., Schneider Electric SE, Telefonaktiebolaget LM Ericsson are a few of the key vendors in the Edge Computing market.

                  North America will register the highest growth rate of 43% among the other regions. Therefore, the Edge Computing market in North America is expected to garner significant business opportunities for the vendors during the forecast period.

                  US, Canada, Germany, UK, Italy, France, China, India, Japan, Brazil, Egypt, UAE, Oman, Argentina, KSA

                  • Rising demand for decentralized computing to reduce latency in decision makingCentralized computing systems is the driving factor this market.
                  • such as cloud infrastructure is the driving factor this market.
                  • often face latency challenges due to their geographically distributed nature. These delays are particularly problematic for time-sensitive applications is the driving factor this market.
                  • such as autonomous vehicles and wearables is the driving factor this market.
                  • which require response times below 25 milliseconds (ms). Edge computing addresses this issue by deploying nodes closer to users or devices is the driving factor this market.
                  • reducing round-trip latency compared to cloud servers is the driving factor this market.
                  • which may require multiple network hops. For example is the driving factor this market.
                  • data transmitted between Hong Kong and the US experiences latency of 150 to170 ms one-way is the driving factor this market.
                  • while North America to India faces even higher delays (230 to 290 ms) due to limited undersea cable connectivity. Edge computing provides real-time or near-real-time responses (25 to 50 ms) is the driving factor this market.
                  • mitigating issues like packet loss and network congestion.Several companies are developing edge solutions to eliminate reliance on constant internet connectivity is the driving factor this market.
                  • enabling faster decision-making in critical applications. In August 2023 is the driving factor this market.
                  • Dell Technologies launched NativeEdge is the driving factor this market.
                  • an edge operations software platform designed to optimize secure edge deployments.Edge computing also enhances security by minimizing data exposure during transmission. For instance is the driving factor this market.
                  • industries like healthcare and finance is the driving factor this market.
                  • which handle sensitive data is the driving factor this market.
                  • benefit from localized processing to comply with regulations such as General Data Protection Regulation (GDPR). As more enterprises adopt edge computing to meet low-latency demands is the driving factor this market.
                  • the market is expected to grow significantly during the forecast period. is the driving factor this market.

                  The Edge Computing market vendors should focus on grabbing business opportunities from the Industrial manufacturing segment as it accounted for the largest market share in the base year.