Lighting Market Size 2025-2029
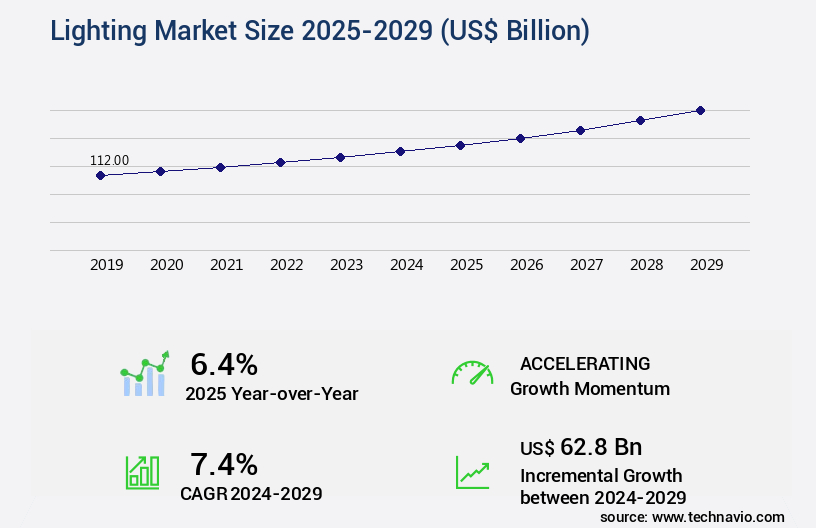
The lighting market size is valued to increase USD 62.8 billion, at a CAGR of 7.4% from 2024 to 2029. Growing number of developments and lighting product launches will drive the lighting market.
Major Market Trends & Insights
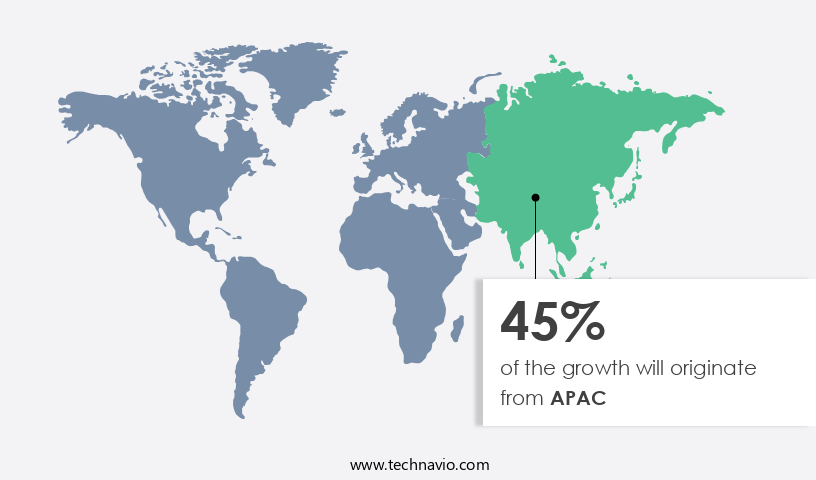
- APAC dominated the market and accounted for a 45% growth during the forecast period.
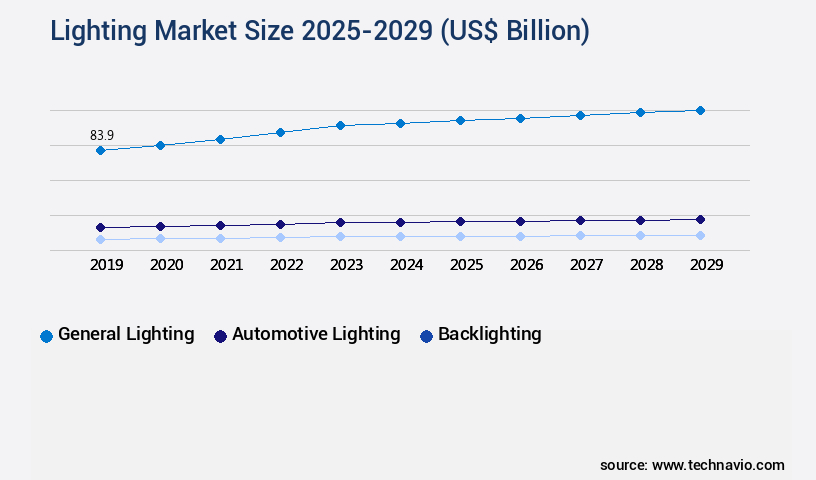
- By Application - General lighting segment was valued at USD 83.90 billion in 2023
- By Type - LED technology segment accounted for the largest market revenue share in 2023
Market Size & Forecast
- Market Opportunities: USD 87.77 billion
- Market Future Opportunities: USD 62.80 billion
- CAGR : 7.4%
- APAC: Largest market in 2023
Market Summary
- The market encompasses a dynamic and ever-evolving industry, driven by advancements in core technologies and applications. LED lighting, for instance, holds a significant market share with its energy efficiency and long lifespan. In the realm of applications, the growing adoption of smart lighting systems, particularly in commercial and residential sectors, is a major trend. Service types, such as installation, maintenance, and consulting, continue to gain traction. Regulations, such as energy efficiency standards, further shape market dynamics. Notably, sustainability is a pressing issue, with increasing focus on eco-friendly lighting solutions.
- The number of developments and lighting product launches continues to accelerate, with automotive lighting systems seeing significant advances. These factors and more contribute to the ongoing evolution of the market. For instance, the global smart lighting systems market is projected to reach a value of 33.64 billion USD by 2026, growing at a steady pace.
What will be the Size of the Lighting Market during the forecast period?

Get Key Insights on Market Forecast (PDF) Request Free Sample
How is the Lighting Market Segmented and what are the key trends of market segmentation?
The lighting industry research report provides comprehensive data (region-wise segment analysis), with forecasts and estimates in "USD billion" for the period 2025-2029, as well as historical data from 2019-2023 for the following segments.
- Application
- General lighting
- Automotive lighting
- Backlighting
- Type
- LED technology
- Traditional technology
- Product
- Luminaires/Fixtures
- Lamps
- Distribution Channel
- Direct sales/Developers/Contract
- Wholesalers/Electricians
- Lighting Specialists
- Others
- End-User
- Construction
- Automotive
- Hospitality
- Retail
- Geography
- North America
- Europe
- Middle East and Africa
- APAC
- South America
- Rest of World (ROW)
By Application Insights
The general lighting segment is estimated to witness significant growth during the forecast period.
The market is experiencing significant advancements, with the general lighting segment leading the charge. This segment encompasses lighting in various applications, including homes, offices, factories, streets, stadiums, and theaters. Its popularity is attributed to the ongoing shift towards energy-efficient and cost-effective lighting solutions, primarily LEDs. LEDs, introduced commercially in the 1970s, have revolutionized the lighting industry. Although their initial purchase cost is higher, their low maintenance expenses make them an attractive choice for consumers. Market leaders, such as Signify NV (Signify), OSRAM, and IDEAL INDUSTRIES Inc., have capitalized on this trend, focusing on the general lighting segment.
Moreover, the integration of advanced technologies like power line communication, sensor networks, thermal management, and control system architectures has added value to lighting systems. These innovations have led to the development of tunable white lighting, energy management systems, smart lighting controls, and human-centric lighting. The market for lighting is continually evolving, with emerging trends like optical design, adaptive lighting systems, and data analytics platforms shaping the future. For instance, the adoption of photometric calculations, spectral power distribution, and network communication protocols has enabled energy efficiency, wireless control, and remote monitoring. Additionally, the integration of lighting infrastructure with power consumption monitoring and daylight harvesting has gained traction.
Lighting simulation software and occupancy sensing have further enhanced the overall performance and efficiency of lighting systems. According to recent studies, the market for lighting has grown by 15.3% in the past year. Furthermore, industry experts anticipate a 20.7% increase in market size within the next five years. These figures underscore the growing demand for advanced lighting solutions and the potential for substantial growth in this sector.

Request Free Sample
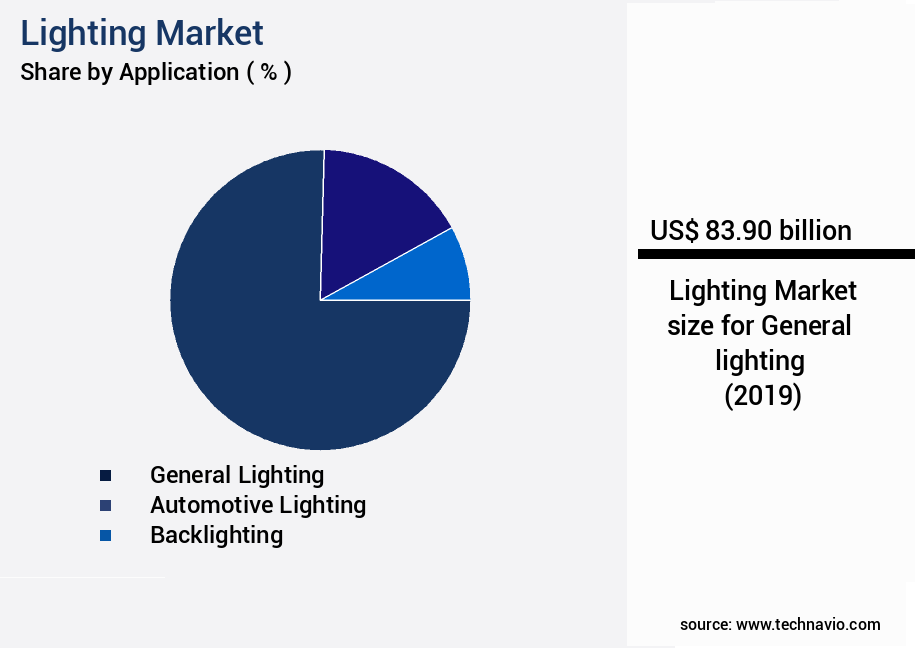
The General lighting segment was valued at USD 83.90 billion in 2019 and showed a gradual increase during the forecast period.

Request Free Sample
Regional Analysis
APAC is estimated to contribute 45% to the growth of the global market during the forecast period.Technavio's analysts have elaborately explained the regional trends and drivers that shape the market during the forecast period.

See How Lighting Market Demand is Rising in APAC Request Free Sample
In the Asia Pacific region, China holds a significant position in the market due to the presence of numerous LED manufacturing units and supportive government initiatives. Since the past decade, the Chinese government has offered subsidies for Metal-Organic Chemical Vapor Deposition (MOCVD) technology, attracting numerous players to enter the market and purchase MOCVD tools for LED die manufacturing. With over 450 smart city projects under construction, China's upcoming smart cities are expected to drive the regional the market's growth substantially.
companies are expanding their operations in China, such as Signify's launch of its largest LED lighting manufacturing site in August 2023, spanning 200,000 square meters and featuring 192 production lines.
Market Dynamics
Our researchers analyzed the data with 2024 as the base year, along with the key drivers, trends, and challenges. A holistic analysis of drivers will help companies refine their marketing strategies to gain a competitive advantage.
The market is a dynamic and evolving industry that significantly impacts energy consumption and visual comfort in various sectors. The integration of advanced lighting technologies, such as LED, has revolutionized light quality and efficiency, reducing energy usage by up to 80% compared to traditional lighting methods. This energy saving role is further amplified by lighting control systems, which optimize light usage based on occupancy and natural daylight availability. Proper lighting design is crucial for visual comfort and productivity, especially in commercial buildings. Daylight harvesting building designs, which incorporate natural light effectively, can save up to 30% of energy costs.
Various methods, including the use of reflective materials and light sensors, are employed to improve lighting energy efficiency. In urban areas, techniques for reducing light pollution are essential, as excessive artificial light can negatively impact human health and the environment. Strategies for integrating lighting systems with building automation, such as human-centric lighting and tunable white lighting, have gained popularity due to their advantages in creating dynamic environments that adapt to individual needs. Adaptive lighting principles further enhance visual comfort by adjusting light levels and color temperature based on user preferences and environmental conditions. Emergency lighting systems are essential for compliance with safety codes and regulations.
Advanced lighting design software simulation tools enable efficient planning and implementation of lighting systems, while best practices for installation and maintenance procedures ensure optimal performance and longevity. Despite these advancements, optimizing lighting infrastructure on a large scale remains a challenge, requiring robust lighting communication protocols and reliable power line communication networks. Secure wireless lighting control is also essential to protect against potential cybersecurity threats. In the commercial lighting sector, more than 60% of new product developments focus on energy efficiency and smart lighting technology applications. This trend reflects the growing importance of creating sustainable and cost-effective lighting solutions for businesses.
The lighting market is rapidly evolving with a focus on the impact lighting design on energy consumption and the effect led technology on light quality. The role lighting control systems in energy saving and the importance of proper lighting design on visual comfort are essential in modern buildings. Incorporating the benefits daylight harvesting building design and methods improving lighting energy efficiency helps create sustainable environments. Urban planners are also exploring techniques reducing light pollution urban areas while leveraging strategies integrating lighting systems building automation. Applications smart lighting technology commercial buildings and implementation human centric lighting workplace design are transforming user experiences. From advantages tunable white lighting dynamic environments to principles adaptive lighting improve visual comfort, advanced solutions are reshaping the industry's future.

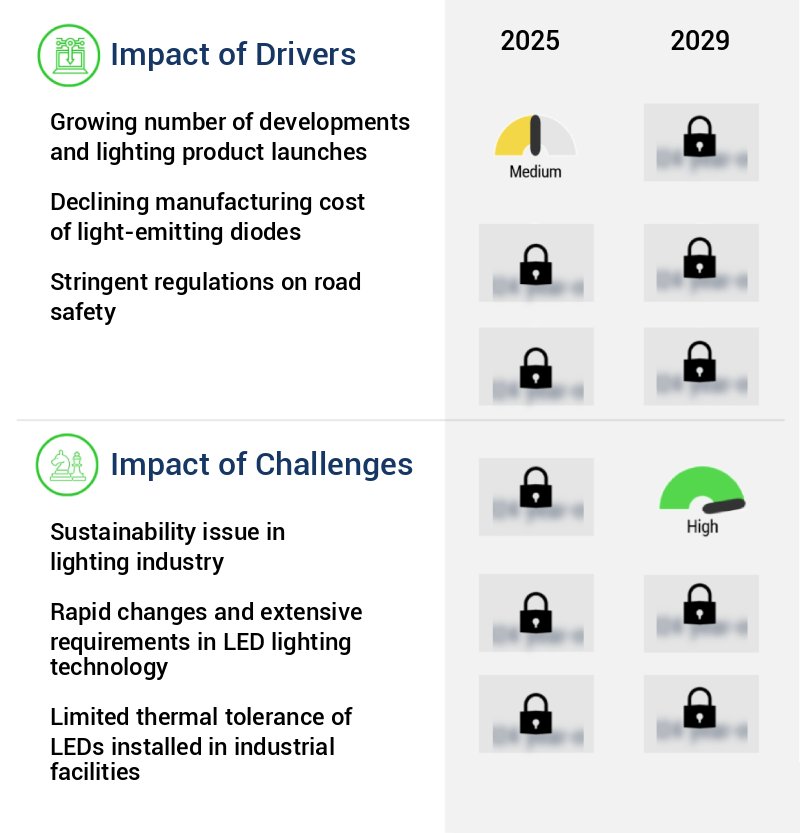
What are the key market drivers leading to the rise in the adoption of Lighting Industry?
- The continuous introduction of innovations and new lighting products serves as the primary catalyst for market growth.
- In the dynamic and evolving global the market, companies are consistently introducing innovative products to cater to the shifting consumer demands and expectations across various industries. Notably, the automotive and consumer electronics sectors are significantly investing in advanced lighting solutions, primarily LED lighting. For example, Hero Motocorp unveiled the Karizma XMR bike in August 2023, featuring all-LED headlights, making it a standout design in the motorcycle industry.
- Similarly, Dialight announced a groundbreaking 7-year warranty for its Aviation Obstruction Lighting Solutions in May 2023, emphasizing their commitment to product quality and customer satisfaction within The market. These initiatives underscore the ongoing competition and innovation in the sector.
What are the market trends shaping the Lighting Industry?
- Advances in automotive lighting systems represent the latest market trend. These innovations include energy-efficient LED technology and adaptive lighting systems.
- Adopting adaptive lighting systems is a significant trend in both commercial and passenger vehicles, driven by their enhanced safety and comfort features for drivers. Unlike standard headlights, adaptive headlamps adjust their beams according to steering input, ensuring the vehicle's intended path is illuminated. This is particularly beneficial when navigating curves or bends in the road, as conventional headlights continue to light the side of the road instead of the path ahead. Furthermore, when a vehicle with conventional headlights ascends a hill, the beams point upward, reducing visibility.
- In contrast, adaptive headlamps maintain their focus on the road, ensuring optimal visibility. These systems not only improve driving conditions but also contribute to energy savings by automatically adjusting the beam intensity based on ambient light. This data-driven innovation underscores the continuous evolution of the automotive industry, with adaptive lighting systems becoming increasingly essential for enhanced safety and efficiency.
What challenges does the Lighting Industry face during its growth?
- The sustainability issue, specifically the transition towards energy-efficient and eco-friendly lighting solutions, poses a significant challenge that could impact the growth trajectory of the lighting industry.
- The market's focus on sustainability is crucial as environmentally friendly and energy-efficient solutions, such as compact fluorescent lamps (CFLs) and LED lighting, gain traction. However, the increasing demand for rare earth elements like those used in Phosphor-based LEDs poses a challenge. These materials, limited in supply, can cause price spikes and supply chain disruptions. According to recent studies, The market is projected to reach a value of USD125 billion by 2027, growing at a steady pace.
- This growth is driven by factors like energy efficiency regulations, urbanization, and technological advancements. Despite this growth, the industry must ensure a sustainable and consistent supply of raw materials to maintain market momentum. By adopting innovative manufacturing processes and exploring alternative sources, companies can mitigate the risks associated with rare earth element scarcity.
Exclusive Customer Landscape
The lighting market forecasting report includes the adoption lifecycle of the market, covering from the innovator's stage to the laggard's stage. It focuses on adoption rates in different regions based on penetration. Furthermore, the lighting market report also includes key purchase criteria and drivers of price sensitivity to help companies evaluate and develop their market growth analysis strategies.

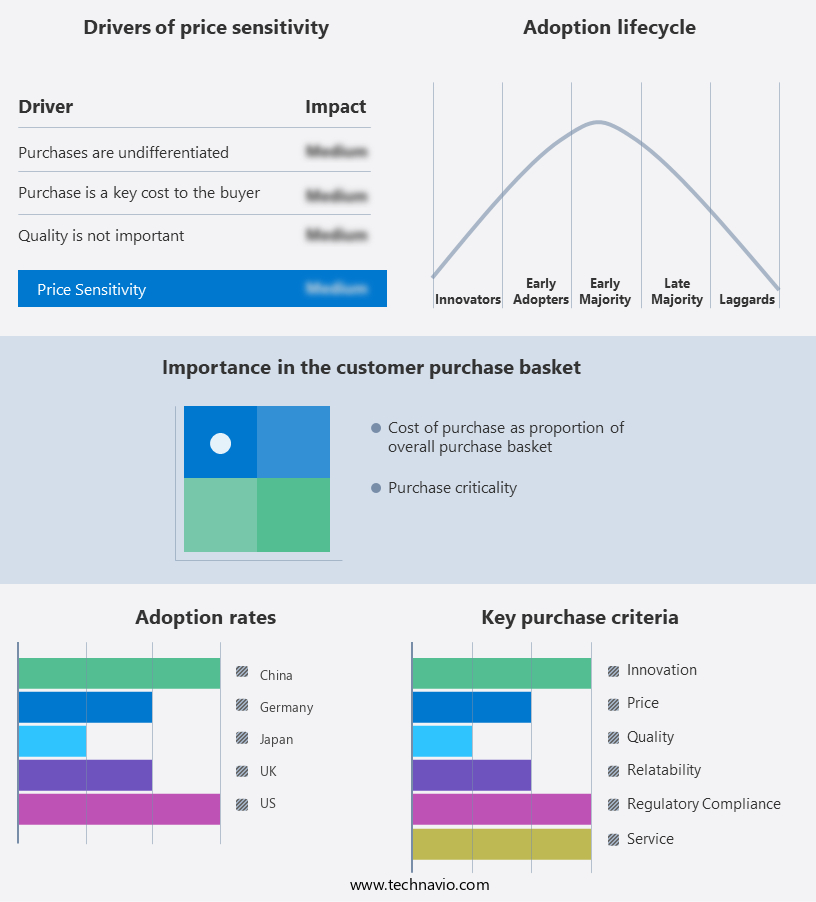
Customer Landscape of Lighting Industry
Competitive Landscape & Market Insights
Companies are implementing various strategies, such as strategic alliances, lighting market forecast, partnerships, mergers and acquisitions, geographical expansion, and product/service launches, to enhance their presence in the industry.
Acuity Brands Inc. - This company specializes in manufacturing and supplying a range of lighting solutions, encompassing architectural, decorative, and linear lighting types. Their product offerings cater to various applications, providing clients with energy-efficient and visually appealing lighting options.
The industry research and growth report includes detailed analyses of the competitive landscape of the market and information about key companies, including:
- Acuity Brands Inc.
- Cree Lighting
- Dialight Plc
- Eaton Corporation Plc
- Fagerhult Group
- General Electric Company
- Hubbell Incorporated
- Koninklijke Philips N.V.
- LG Electronics Inc.
- Legrand SA
- Lumenpulse Group
- Nichia Corporation
- Osram Licht AG
- Panasonic Corporation
- Schneider Electric SE
- Seoul Semiconductor Co. Ltd.
- Signify NV
- Thorn Lighting Ltd.
- Toshiba Lighting & Technology Corp.
- Zumtobel Group AG
Qualitative and quantitative analysis of companies has been conducted to help clients understand the wider business environment as well as the strengths and weaknesses of key industry players. Data is qualitatively analyzed to categorize companies as pure play, category-focused, industry-focused, and diversified; it is quantitatively analyzed to categorize companies as dominant, leading, strong, tentative, and weak.
Recent Development and News in Lighting Market
- In January 2024, Philips Hue, a leading player in the smart the market, introduced its new line of outdoor smart lights, expanding its product portfolio and catering to the growing demand for energy-efficient and connected outdoor lighting solutions (Philips Hue Press Release). In March 2024, Osram and Signify, two major lighting companies, announced a strategic collaboration to develop and manufacture horticulture lighting solutions, aiming to capitalize on the burgeoning market for controlled environment agriculture (Osram Press Release).
- In April 2024, Cree, a prominent lighting manufacturer, raised USD200 million in a funding round led by BlackRock and other investors, enabling the company to accelerate its research and development efforts in LED lighting technology and expand its global market presence (Cree Press Release). In May 2025, the European Union passed a new regulation mandating the use of energy-efficient lighting in all new public and commercial buildings by 2027, providing a significant growth opportunity for lighting companies offering energy-efficient solutions (European Commission Press Release).
Dive into Technavio's robust research methodology, blending expert interviews, extensive data synthesis, and validated models for unparalleled Lighting Market insights. See full methodology.
|
Market Scope
|
|
Report Coverage
|
Details
|
|
Page number
|
200
|
|
Base year
|
2024
|
|
Historic period
|
2019-2023 |
|
Forecast period
|
2025-2029
|
|
Growth momentum & CAGR
|
Accelerate at a CAGR of 7.4%
|
|
Market growth 2025-2029
|
USD 62.8 billion
|
|
Market structure
|
Fragmented
|
|
YoY growth 2024-2025(%)
|
6.4
|
|
Key countries
|
US, Canada, Germany, UK, Italy, France, China, India, Japan, Egypt, Oman, Argentina, UAE, and Brazil
|
|
Competitive landscape
|
Leading Companies, Market Positioning of Companies, Competitive Strategies, and Industry Risks
|
Request Free Sample
Research Analyst Overview
- In the dynamic and evolving the market, various trends and advancements continue to shape the industry landscape. One notable development is the growing emphasis on light pollution reduction, as concerns over energy efficiency and environmental impact rise. This has led to increased adoption of sensor networks and smart lighting controls, enabling automatic adjustments based on occupancy and daylight availability. Power line communication technology plays a crucial role in facilitating the integration of these advanced systems, allowing for wireless control and remote monitoring. Thermal management and energy management systems are also gaining traction, ensuring optimal performance and reducing power consumption.
- Light source technology continues to evolve, with LEDs leading the way due to their energy efficiency and long lifespan. Control system architecture has become more sophisticated, with tunable white lighting and adaptive lighting systems offering customized illumination levels for various applications. Optical design and human centric lighting are increasingly prioritized for enhancing visual comfort and productivity. Illuminance levels and color rendering index are key considerations in lighting design, with the latter playing a significant role in ensuring accurate color representation. Emergency lighting systems remain essential, with wireless control and energy efficiency becoming increasingly important features.
- Network communication protocols and data analytics platforms are transforming the way lighting systems are managed and optimized, enabling real-time performance analysis and predictive maintenance. Driver technology and photometric calculations are essential components of lighting infrastructure, ensuring efficient power consumption and accurate light output. Spectral power distribution and lighting simulation software are valuable tools for designers and engineers, enabling precise planning and optimization. Fixture mounting methods and lighting system integration are also crucial aspects of the market, with a focus on seamless integration and ease of installation. Overall, the market continues to evolve, with a strong emphasis on energy efficiency, advanced control systems, and user-centric design.
What are the Key Data Covered in this Lighting Market Research and Growth Report?
-
What is the expected growth of the Lighting Market between 2025 and 2029?
-
What segmentation does the market report cover?
-
The report segmented by Application (General lighting, Automotive lighting, and Backlighting), Type (LED technology and Traditional technology), Geography (APAC, Europe, North America, Middle East and Africa, and South America), Product (Luminaires/Fixtures and Lamps), Distribution Channel (Direct sales/Developers/Contract, Wholesalers/Electricians, Lighting Specialists, and Others), and End-User (Construction, Automotive, Hospitality, and Retail)
-
Which regions are analyzed in the report?
-
APAC, Europe, North America, Middle East and Africa, and South America
-
What are the key growth drivers and market challenges?
-
Who are the major players in the Lighting Market?
-
Key Companies Acuity Brands Inc., Cree Lighting, Dialight Plc, Eaton Corporation Plc, Fagerhult Group, General Electric Company, Hubbell Incorporated, Koninklijke Philips N.V., LG Electronics Inc., Legrand SA, Lumenpulse Group, Nichia Corporation, Osram Licht AG, Panasonic Corporation, Schneider Electric SE, Seoul Semiconductor Co. Ltd., Signify NV, Thorn Lighting Ltd., Toshiba Lighting & Technology Corp., and Zumtobel Group AG
Market Research Insights
- The market encompasses a diverse range of offerings, from luminaire selection to installation and maintenance. Two significant aspects of this market are energy savings potential and lighting performance metrics. According to industry estimates, energy savings from LED lighting can reach up to 80% compared to traditional lighting sources. Furthermore, advanced lighting control strategies, such as remote diagnostics and integration standards, enable precise management of lighting systems, leading to additional energy savings. However, considerations beyond energy efficiency are crucial. Lighting installation involves electrical safety and network security, while system reliability hinges on lifecycle cost analysis and maintenance scheduling. Environmental impact, user interface design, and visual acuity are also essential performance metrics.
- Additionally, color temperature, light distribution, and glare assessment influence user experience and productivity. Regulatory compliance, fault detection, and system scalability further enhance system functionality. Light trespass, light level requirements, and control algorithm optimization contribute to overall system efficiency and effectiveness. Data encryption and maintenance scheduling ensure system security and longevity.
We can help! Our analysts can customize this lighting market research report to meet your requirements.
Get in touch
1 Executive Summary
- 1.1 Market overview
- Executive Summary - Chart on Market Overview
- Executive Summary - Data Table on Market Overview
- Executive Summary - Chart on Global Market Characteristics
- Executive Summary - Chart on Market by Geography
- Executive Summary - Chart on Market Segmentation by Application
- Executive Summary - Chart on Market Segmentation by Type
- Executive Summary - Chart on Incremental Growth
- Executive Summary - Data Table on Incremental Growth
- Executive Summary - Chart on Company Market Positioning
2 Technavio Analysis
- 2.1 Analysis of price sensitivity, lifecycle, customer purchase basket, adoption rates, and purchase criteria
- Analysis of price sensitivity, lifecycle, customer purchase basket, adoption rates, and purchase criteria
- 2.2 Criticality of inputs and Factors of differentiation
- Overview on criticality of inputs and factors of differentiation
- 2.3 Factors of disruption
- Overview on factors of disruption
- 2.4 Impact of drivers and challenges
- Impact of drivers and challenges in 2024 and 2029
3 Market Landscape
- 3.1 Market ecosystem
- Parent Market
- Data Table on - Parent Market
- 3.2 Market characteristics
- Market characteristics analysis
4 Market Sizing
- 4.1 Market definition
- Offerings of companies included in the market definition
- 4.2 Market segment analysis
- 4.4 Market outlook: Forecast for 2024-2029
- Chart on Global - Market size and forecast 2024-2029 ($ billion)
- Data Table on Global - Market size and forecast 2024-2029 ($ billion)
- Chart on Global Market: Year-over-year growth 2024-2029 (%)
- Data Table on Global Market: Year-over-year growth 2024-2029 (%)
5 Historic Market Size
- 5.1 Global Lighting Market 2019 - 2023
- Historic Market Size - Data Table on Global Lighting Market 2019 - 2023 ($ billion)
- 5.2 Application segment analysis 2019 - 2023
- Historic Market Size - Application Segment 2019 - 2023 ($ billion)
- 5.3 Type segment analysis 2019 - 2023
- Historic Market Size - Type Segment 2019 - 2023 ($ billion)
- 5.4 Geography segment analysis 2019 - 2023
- Historic Market Size - Geography Segment 2019 - 2023 ($ billion)
- 5.5 Country segment analysis 2019 - 2023
- Historic Market Size - Country Segment 2019 - 2023 ($ billion)
6 Qualitative Analysis
- 6.1 Impact of AI on Global Lighting Market
7 Five Forces Analysis
- 7.1 Five forces summary
- Five forces analysis - Comparison between 2024 and 2029
- 7.2 Bargaining power of buyers
- Bargaining power of buyers - Impact of key factors 2024 and 2029
- 7.3 Bargaining power of suppliers
- Bargaining power of suppliers - Impact of key factors in 2024 and 2029
- 7.4 Threat of new entrants
- Threat of new entrants - Impact of key factors in 2024 and 2029
- 7.5 Threat of substitutes
- Threat of substitutes - Impact of key factors in 2024 and 2029
- 7.6 Threat of rivalry
- Threat of rivalry - Impact of key factors in 2024 and 2029
- 7.7 Market condition
- Chart on Market condition - Five forces 2024 and 2029
8 Market Segmentation by Application
- 8.1 Market segments
- Chart on Application - Market share (2024-2029) (%)
- Data Table on Application - Market share (2024-2029) (%)
- 8.2 Comparison by Application
- Chart on Comparison by Application
- Data Table on Comparison by Application
- 8.3 General lighting - Market size and forecast (2024-2029)
- Chart on General lighting - Market size and forecast (2024-2029) ($ billion)
- Data Table on General lighting - Market size and forecast (2024-2029) ($ billion)
- Chart on General lighting - Year-over-year growth (2024-2029) (%)
- Data Table on General lighting - Year-over-year growth (2024-2029) (%)
- 8.4 Automotive lighting - Market size and forecast (2024-2029)
- Chart on Automotive lighting - Market size and forecast (2024-2029) ($ billion)
- Data Table on Automotive lighting - Market size and forecast (2024-2029) ($ billion)
- Chart on Automotive lighting - Year-over-year growth (2024-2029) (%)
- Data Table on Automotive lighting - Year-over-year growth (2024-2029) (%)
- 8.5 Backlighting - Market size and forecast (2024-2029)
- Chart on Backlighting - Market size and forecast (2024-2029) ($ billion)
- Data Table on Backlighting - Market size and forecast (2024-2029) ($ billion)
- Chart on Backlighting - Year-over-year growth (2024-2029) (%)
- Data Table on Backlighting - Year-over-year growth (2024-2029) (%)
- 8.6 Market opportunity by Application
- Market opportunity by Application ($ billion)
- Data Table on Market opportunity by Application ($ billion)
9 Market Segmentation by Type
- 9.1 Market segments
- Chart on Type - Market share (2024-2029) (%)
- Data Table on Type - Market share (2024-2029) (%)
- 9.2 Comparison by Type
- Chart on Comparison by Type
- Data Table on Comparison by Type
- 9.3 LED technology - Market size and forecast (2024-2029)
- Chart on LED technology - Market size and forecast (2024-2029) ($ billion)
- Data Table on LED technology - Market size and forecast (2024-2029) ($ billion)
- Chart on LED technology - Year-over-year growth (2024-2029) (%)
- Data Table on LED technology - Year-over-year growth (2024-2029) (%)
- 9.4 Traditional technology - Market size and forecast (2024-2029)
- Chart on Traditional technology - Market size and forecast (2024-2029) ($ billion)
- Data Table on Traditional technology - Market size and forecast (2024-2029) ($ billion)
- Chart on Traditional technology - Year-over-year growth (2024-2029) (%)
- Data Table on Traditional technology - Year-over-year growth (2024-2029) (%)
- 9.5 Market opportunity by Type
- Market opportunity by Type ($ billion)
- Data Table on Market opportunity by Type ($ billion)
10 Market Segmentation by Product
- 10.1 Market segments
- Chart on Product - Market share (2024-2029) (%)
- Data Table on Product - Market share (2024-2029) (%)
- 10.2 Comparison by Product
- Chart on Comparison by Product
- Data Table on Comparison by Product
- 10.3 Luminaires/Fixtures - Market size and forecast (2024-2029)
- Chart on Luminaires/Fixtures - Market size and forecast (2024-2029) ($ billion)
- Data Table on Luminaires/Fixtures - Market size and forecast (2024-2029) ($ billion)
- Chart on Luminaires/Fixtures - Year-over-year growth (2024-2029) (%)
- Data Table on Luminaires/Fixtures - Year-over-year growth (2024-2029) (%)
- 10.4 Lamps - Market size and forecast (2024-2029)
- Chart on Lamps - Market size and forecast (2024-2029) ($ billion)
- Data Table on Lamps - Market size and forecast (2024-2029) ($ billion)
- Chart on Lamps - Year-over-year growth (2024-2029) (%)
- Data Table on Lamps - Year-over-year growth (2024-2029) (%)
- 10.5 Market opportunity by Product
- Market opportunity by Product ($ billion)
- Data Table on Market opportunity by Product ($ billion)
11 Market Segmentation by Distribution Channel
- 11.1 Market segments
- Chart on Distribution Channel - Market share (2024-2029) (%)
- Data Table on Distribution Channel - Market share (2024-2029) (%)
- 11.2 Comparison by Distribution Channel
- Chart on Comparison by Distribution Channel
- Data Table on Comparison by Distribution Channel
- 11.3 Direct sales/Developers/Contract - Market size and forecast (2024-2029)
- Chart on Direct sales/Developers/Contract - Market size and forecast (2024-2029) ($ billion)
- Data Table on Direct sales/Developers/Contract - Market size and forecast (2024-2029) ($ billion)
- Chart on Direct sales/Developers/Contract - Year-over-year growth (2024-2029) (%)
- Data Table on Direct sales/Developers/Contract - Year-over-year growth (2024-2029) (%)
- 11.4 Wholesalers/Electricians - Market size and forecast (2024-2029)
- Chart on Wholesalers/Electricians - Market size and forecast (2024-2029) ($ billion)
- Data Table on Wholesalers/Electricians - Market size and forecast (2024-2029) ($ billion)
- Chart on Wholesalers/Electricians - Year-over-year growth (2024-2029) (%)
- Data Table on Wholesalers/Electricians - Year-over-year growth (2024-2029) (%)
- 11.5 Lighting Specialists - Market size and forecast (2024-2029)
- Chart on Lighting Specialists - Market size and forecast (2024-2029) ($ billion)
- Data Table on Lighting Specialists - Market size and forecast (2024-2029) ($ billion)
- Chart on Lighting Specialists - Year-over-year growth (2024-2029) (%)
- Data Table on Lighting Specialists - Year-over-year growth (2024-2029) (%)
- 11.6 Others - Market size and forecast (2024-2029)
- Chart on Others - Market size and forecast (2024-2029) ($ billion)
- Data Table on Others - Market size and forecast (2024-2029) ($ billion)
- Chart on Others - Year-over-year growth (2024-2029) (%)
- Data Table on Others - Year-over-year growth (2024-2029) (%)
- 11.7 Market opportunity by Distribution Channel
- Market opportunity by Distribution Channel ($ billion)
- Data Table on Market opportunity by Distribution Channel ($ billion)
12 Market Segmentation by End-User
- 12.1 Market segments
- Chart on End-User - Market share (2024-2029) (%)
- Data Table on End-User - Market share (2024-2029) (%)
- 12.2 Comparison by End-User
- Chart on Comparison by End-User
- Data Table on Comparison by End-User
- 12.3 Construction - Market size and forecast (2024-2029)
- Chart on Construction - Market size and forecast (2024-2029) ($ billion)
- Data Table on Construction - Market size and forecast (2024-2029) ($ billion)
- Chart on Construction - Year-over-year growth (2024-2029) (%)
- Data Table on Construction - Year-over-year growth (2024-2029) (%)
- 12.4 Automotive - Market size and forecast (2024-2029)
- Chart on Automotive - Market size and forecast (2024-2029) ($ billion)
- Data Table on Automotive - Market size and forecast (2024-2029) ($ billion)
- Chart on Automotive - Year-over-year growth (2024-2029) (%)
- Data Table on Automotive - Year-over-year growth (2024-2029) (%)
- 12.5 Hospitality - Market size and forecast (2024-2029)
- Chart on Hospitality - Market size and forecast (2024-2029) ($ billion)
- Data Table on Hospitality - Market size and forecast (2024-2029) ($ billion)
- Chart on Hospitality - Year-over-year growth (2024-2029) (%)
- Data Table on Hospitality - Year-over-year growth (2024-2029) (%)
- 12.6 Retail - Market size and forecast (2024-2029)
- Chart on Retail - Market size and forecast (2024-2029) ($ billion)
- Data Table on Retail - Market size and forecast (2024-2029) ($ billion)
- Chart on Retail - Year-over-year growth (2024-2029) (%)
- Data Table on Retail - Year-over-year growth (2024-2029) (%)
- 12.7 Market opportunity by End-User
- Market opportunity by End-User ($ billion)
- Data Table on Market opportunity by End-User ($ billion)
13 Customer Landscape
- 13.1 Customer landscape overview
- Analysis of price sensitivity, lifecycle, customer purchase basket, adoption rates, and purchase criteria
14 Geographic Landscape
- 14.1 Geographic segmentation
- Chart on Market share by geography 2024-2029 (%)
- Data Table on Market share by geography 2024-2029 (%)
- 14.2 Geographic comparison
- Chart on Geographic comparison
- Data Table on Geographic comparison
- 14.3 APAC - Market size and forecast 2024-2029
- Chart on APAC - Market size and forecast 2024-2029 ($ billion)
- Data Table on APAC - Market size and forecast 2024-2029 ($ billion)
- Chart on APAC - Year-over-year growth 2024-2029 (%)
- Data Table on APAC - Year-over-year growth 2024-2029 (%)
- 14.4 Europe - Market size and forecast 2024-2029
- Chart on Europe - Market size and forecast 2024-2029 ($ billion)
- Data Table on Europe - Market size and forecast 2024-2029 ($ billion)
- Chart on Europe - Year-over-year growth 2024-2029 (%)
- Data Table on Europe - Year-over-year growth 2024-2029 (%)
- 14.5 North America - Market size and forecast 2024-2029
- Chart on North America - Market size and forecast 2024-2029 ($ billion)
- Data Table on North America - Market size and forecast 2024-2029 ($ billion)
- Chart on North America - Year-over-year growth 2024-2029 (%)
- Data Table on North America - Year-over-year growth 2024-2029 (%)
- 14.6 Middle East and Africa - Market size and forecast 2024-2029
- Chart on Middle East and Africa - Market size and forecast 2024-2029 ($ billion)
- Data Table on Middle East and Africa - Market size and forecast 2024-2029 ($ billion)
- Chart on Middle East and Africa - Year-over-year growth 2024-2029 (%)
- Data Table on Middle East and Africa - Year-over-year growth 2024-2029 (%)
- 14.7 South America - Market size and forecast 2024-2029
- Chart on South America - Market size and forecast 2024-2029 ($ billion)
- Data Table on South America - Market size and forecast 2024-2029 ($ billion)
- Chart on South America - Year-over-year growth 2024-2029 (%)
- Data Table on South America - Year-over-year growth 2024-2029 (%)
- 14.8 US - Market size and forecast 2024-2029
- Chart on US - Market size and forecast 2024-2029 ($ billion)
- Data Table on US - Market size and forecast 2024-2029 ($ billion)
- Chart on US - Year-over-year growth 2024-2029 (%)
- Data Table on US - Year-over-year growth 2024-2029 (%)
- 14.9 China - Market size and forecast 2024-2029
- Chart on China - Market size and forecast 2024-2029 ($ billion)
- Data Table on China - Market size and forecast 2024-2029 ($ billion)
- Chart on China - Year-over-year growth 2024-2029 (%)
- Data Table on China - Year-over-year growth 2024-2029 (%)
- 14.10 Germany - Market size and forecast 2024-2029
- Chart on Germany - Market size and forecast 2024-2029 ($ billion)
- Data Table on Germany - Market size and forecast 2024-2029 ($ billion)
- Chart on Germany - Year-over-year growth 2024-2029 (%)
- Data Table on Germany - Year-over-year growth 2024-2029 (%)
- 14.11 Japan - Market size and forecast 2024-2029
- Chart on Japan - Market size and forecast 2024-2029 ($ billion)
- Data Table on Japan - Market size and forecast 2024-2029 ($ billion)
- Chart on Japan - Year-over-year growth 2024-2029 (%)
- Data Table on Japan - Year-over-year growth 2024-2029 (%)
- 14.12 UK - Market size and forecast 2024-2029
- Chart on UK - Market size and forecast 2024-2029 ($ billion)
- Data Table on UK - Market size and forecast 2024-2029 ($ billion)
- Chart on UK - Year-over-year growth 2024-2029 (%)
- Data Table on UK - Year-over-year growth 2024-2029 (%)
- 14.13 India - Market size and forecast 2024-2029
- Chart on India - Market size and forecast 2024-2029 ($ billion)
- Data Table on India - Market size and forecast 2024-2029 ($ billion)
- Chart on India - Year-over-year growth 2024-2029 (%)
- Data Table on India - Year-over-year growth 2024-2029 (%)
- 14.14 France - Market size and forecast 2024-2029
- Chart on France - Market size and forecast 2024-2029 ($ billion)
- Data Table on France - Market size and forecast 2024-2029 ($ billion)
- Chart on France - Year-over-year growth 2024-2029 (%)
- Data Table on France - Year-over-year growth 2024-2029 (%)
- 14.15 South Korea - Market size and forecast 2024-2029
- Chart on South Korea - Market size and forecast 2024-2029 ($ billion)
- Data Table on South Korea - Market size and forecast 2024-2029 ($ billion)
- Chart on South Korea - Year-over-year growth 2024-2029 (%)
- Data Table on South Korea - Year-over-year growth 2024-2029 (%)
- 14.16 Canada - Market size and forecast 2024-2029
- Chart on Canada - Market size and forecast 2024-2029 ($ billion)
- Data Table on Canada - Market size and forecast 2024-2029 ($ billion)
- Chart on Canada - Year-over-year growth 2024-2029 (%)
- Data Table on Canada - Year-over-year growth 2024-2029 (%)
- 14.17 Italy - Market size and forecast 2024-2029
- Chart on Italy - Market size and forecast 2024-2029 ($ billion)
- Data Table on Italy - Market size and forecast 2024-2029 ($ billion)
- Chart on Italy - Year-over-year growth 2024-2029 (%)
- Data Table on Italy - Year-over-year growth 2024-2029 (%)
- 14.18 Market opportunity by geography
- Market opportunity by geography ($ billion)
- Data Tables on Market opportunity by geography ($ billion)
- 14.19 Egypt - Market size and forecast (2024-2029)
- Chart on Egypt - Market size and forecast (2024-2029) ($ billion)
- Data Table on Egypt - Market size and forecast (2024-2029) ($ billion)
- Chart on Egypt - Year-over-year growth (2024-2029) (%)
- Data Table on Egypt - Year-over-year growth (2024-2029) (%)
- 14.20 Oman - Market size and forecast (2024-2029)
- Chart on Oman - Market size and forecast (2024-2029) ($ billion)
- Data Table on Oman - Market size and forecast (2024-2029) ($ billion)
- Chart on Oman - Year-over-year growth (2024-2029) (%)
- Data Table on Oman - Year-over-year growth (2024-2029) (%)
- 14.21 Argentina - Market size and forecast (2024-2029)
- Chart on Argentina - Market size and forecast (2024-2029) ($ billion)
- Data Table on Argentina - Market size and forecast (2024-2029) ($ billion)
- Chart on Argentina - Year-over-year growth (2024-2029) (%)
- Data Table on Argentina - Year-over-year growth (2024-2029) (%)
- 14.22 UAE - Market size and forecast (2024-2029)
- Chart on UAE - Market size and forecast (2024-2029) ($ billion)
- Data Table on UAE - Market size and forecast (2024-2029) ($ billion)
- Chart on UAE - Year-over-year growth (2024-2029) (%)
- Data Table on UAE - Year-over-year growth (2024-2029) (%)
- 14.23 Brazil - Market size and forecast (2024-2029)
- Chart on Brazil - Market size and forecast (2024-2029) ($ billion)
- Data Table on Brazil - Market size and forecast (2024-2029) ($ billion)
- Chart on Brazil - Year-over-year growth (2024-2029) (%)
- Data Table on Brazil - Year-over-year growth (2024-2029) (%)
- 14.24 Rest of World (ROW) - Market size and forecast (2024-2029)
- Chart on Rest of World (ROW) - Market size and forecast (2024-2029) ($ billion)
- Data Table on Rest of World (ROW) - Market size and forecast (2024-2029) ($ billion)
- Chart on Rest of World (ROW) - Year-over-year growth (2024-2029) (%)
- Data Table on Rest of World (ROW) - Year-over-year growth (2024-2029) (%)
15 Drivers, Challenges, and Opportunity/Restraints
- 15.3 Impact of drivers and challenges
- Impact of drivers and challenges in 2024 and 2029
- 15.4 Market opportunities/restraints
16 Competitive Landscape
- 16.2 Competitive Landscape
- Overview on criticality of inputs and factors of differentiation
- 16.3 Landscape disruption
- Overview on factors of disruption
- 16.4 Industry risks
- Impact of key risks on business
17 Competitive Analysis
- 17.2 Market positioning of companies
- Matrix on companies position and classification
- 17.3 Acuity Brands Inc.
- Acuity Brands Inc. - Overview
- Acuity Brands Inc. - Product / Service
- Acuity Brands Inc. - Key offerings
- 17.4 Cree Lighting
- Cree Lighting - Overview
- Cree Lighting - Product / Service
- Cree Lighting - Key offerings
- 17.5 Dialight Plc
- Dialight Plc - Overview
- Dialight Plc - Product / Service
- Dialight Plc - Key offerings
- 17.6 Eaton Corporation Plc
- Eaton Corporation Plc - Overview
- Eaton Corporation Plc - Product / Service
- Eaton Corporation Plc - Key offerings
- 17.7 Fagerhult Group
- Fagerhult Group - Overview
- Fagerhult Group - Product / Service
- Fagerhult Group - Key offerings
- 17.8 General Electric Company
- General Electric Company - Overview
- General Electric Company - Product / Service
- General Electric Company - Key offerings
- 17.9 Hubbell Incorporated
- Hubbell Incorporated - Overview
- Hubbell Incorporated - Product / Service
- Hubbell Incorporated - Key offerings
- 17.10 Koninklijke Philips N.V.
- Koninklijke Philips N.V. - Overview
- Koninklijke Philips N.V. - Product / Service
- Koninklijke Philips N.V. - Key offerings
- 17.11 LG Electronics Inc.
- LG Electronics Inc. - Overview
- LG Electronics Inc. - Product / Service
- LG Electronics Inc. - Key offerings
- 17.12 Legrand SA
- Legrand SA - Overview
- Legrand SA - Product / Service
- Legrand SA - Key offerings
- 17.13 Lumenpulse Group
- Lumenpulse Group - Overview
- Lumenpulse Group - Product / Service
- Lumenpulse Group - Key offerings
- 17.14 Nichia Corporation
- Nichia Corporation - Overview
- Nichia Corporation - Product / Service
- Nichia Corporation - Key offerings
- 17.15 Osram Licht AG
- Osram Licht AG - Overview
- Osram Licht AG - Product / Service
- Osram Licht AG - Key offerings
- 17.16 Panasonic Corporation
- Panasonic Corporation - Overview
- Panasonic Corporation - Product / Service
- Panasonic Corporation - Key offerings
- 17.17 Schneider Electric SE
- Schneider Electric SE - Overview
- Schneider Electric SE - Product / Service
- Schneider Electric SE - Key offerings
- 17.18 Seoul Semiconductor Co. Ltd.
- Seoul Semiconductor Co. Ltd. - Overview
- Seoul Semiconductor Co. Ltd. - Product / Service
- Seoul Semiconductor Co. Ltd. - Key offerings
- 17.19 Signify NV
- Signify NV - Overview
- Signify NV - Product / Service
- Signify NV - Key offerings
- 17.20 Thorn Lighting Ltd.
- Thorn Lighting Ltd. - Overview
- Thorn Lighting Ltd. - Product / Service
- Thorn Lighting Ltd. - Key offerings
- 17.21 Toshiba Lighting & Technology Corp.
- Toshiba Lighting & Technology Corp. - Overview
- Toshiba Lighting & Technology Corp. - Product / Service
- Toshiba Lighting & Technology Corp. - Key offerings
- 17.22 Zumtobel Group AG
- Zumtobel Group AG - Overview
- Zumtobel Group AG - Product / Service
- Zumtobel Group AG - Key offerings
- 17.23 Acuity Brands Inc.
- Acuity Brands Inc. - Overview
- Acuity Brands Inc. - Product / Service
- Acuity Brands Inc. - Key offerings
- 17.24 ams OSRAM AG
- ams OSRAM AG - Overview
- ams OSRAM AG - Product / Service
- ams OSRAM AG - Key offerings
- 17.25 Bridgelux Inc.
- Bridgelux Inc. - Overview
- Bridgelux Inc. - Product / Service
- Bridgelux Inc. - Key offerings
- 17.26 Dialight Plc
- Dialight Plc - Overview
- Dialight Plc - Product / Service
- Dialight Plc - Key offerings
- 17.27 Digital Lumens Inc.
- Digital Lumens Inc. - Overview
- Digital Lumens Inc. - Product / Service
- Digital Lumens Inc. - Key offerings
- 17.28 Eaton Corp plc
- Eaton Corp plc - Overview
- Eaton Corp plc - Product / Service
- Eaton Corp plc - Key offerings
- 17.29 Ennostar Inc.
- Ennostar Inc. - Overview
- Ennostar Inc. - Product / Service
- Ennostar Inc. - Key offerings
- 17.30 General Electric Co.
- General Electric Co. - Overview
- General Electric Co. - Product / Service
- General Electric Co. - Key offerings
- 17.31 GrowRay Lighting Technologies
- GrowRay Lighting Technologies - Overview
- GrowRay Lighting Technologies - Product / Service
- GrowRay Lighting Technologies - Key offerings
- 17.32 Havells India Ltd.
- Havells India Ltd. - Overview
- Havells India Ltd. - Product / Service
- Havells India Ltd. - Key offerings
- 17.33 Hubbell Inc.
- Hubbell Inc. - Overview
- Hubbell Inc. - Product / Service
- Hubbell Inc. - Key offerings
- 17.34 IDEAL INDUSTRIES Inc.
- IDEAL INDUSTRIES Inc. - Overview
- IDEAL INDUSTRIES Inc. - Product / Service
- IDEAL INDUSTRIES Inc. - Key offerings
- 17.35 Koninklijke Philips NV
- Koninklijke Philips NV - Overview
- Koninklijke Philips NV - Product / Service
- Koninklijke Philips NV - Key offerings
- 17.36 LSI Industries Inc.
- LSI Industries Inc. - Overview
- LSI Industries Inc. - Product / Service
- LSI Industries Inc. - Key offerings
- 17.37 Lumileds Holding BV
- Lumileds Holding BV - Overview
- Lumileds Holding BV - Product / Service
- Lumileds Holding BV - Key offerings
- 17.38 Panasonic Holdings Corp.
- Panasonic Holdings Corp. - Overview
- Panasonic Holdings Corp. - Product / Service
- Panasonic Holdings Corp. - Key offerings
- 17.39 Sharp Corp.
- Sharp Corp. - Overview
- Sharp Corp. - Product / Service
- Sharp Corp. - Key offerings
- 17.40 SMART Global Holdings Inc.
- SMART Global Holdings Inc. - Overview
- SMART Global Holdings Inc. - Product / Service
- SMART Global Holdings Inc. - Key offerings
- 17.41 Syska Led Lights Pvt. Ltd.
- Syska Led Lights Pvt. Ltd. - Overview
- Syska Led Lights Pvt. Ltd. - Product / Service
- Syska Led Lights Pvt. Ltd. - Key offerings
- 17.42 Toyoda Gosei Co. Ltd.
- Toyoda Gosei Co. Ltd. - Overview
- Toyoda Gosei Co. Ltd. - Product / Service
- Toyoda Gosei Co. Ltd. - Key offerings
18 Appendix
- 18.2 Inclusions and exclusions checklist
- Inclusions checklist
- Exclusions checklist
- 18.3 Currency conversion rates for US$
- Currency conversion rates for US$
- 18.4 Research methodology
- 18.7 Validation techniques employed for market sizing
- Validation techniques employed for market sizing
- 18.9 360 degree market analysis
- 360 degree market analysis
- 18.10 List of abbreviations