Sensor Market Analysis, Size, and Forecast 2026-2030: North America (US, Canada, and Mexico), APAC (China, Japan, and India), Europe (Germany, UK, and France), Middle East and Africa (Saudi Arabia, UAE, and South Africa), South America (Brazil, Argentina, and Colombia), and Rest of World (ROW)

Sensor Market Analysis, Size, and Forecast 2026-2030:
North America (US, Canada, and Mexico), APAC (China, Japan, and India), Europe (Germany, UK, and France), Middle East and Africa (Saudi Arabia, UAE, and South Africa), South America (Brazil, Argentina, and Colombia), and Rest of World (ROW)

Published: Mar 2026 338 Pages SKU: IRTNTR71913

Market Overview at a Glance

$794.3 B
Market Opportunity
26.7%
CAGR 2025 - 2030
42.8%
North America Growth
$70.8 B
Temperature sensor segment 2024

Sensor Market Size 2026-2030

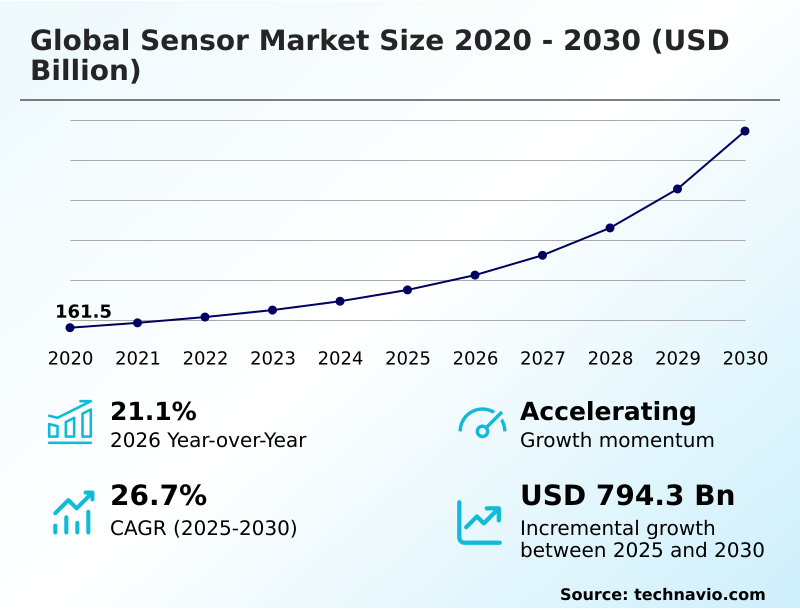
The sensor market size is valued to increase by USD 794.3 billion, at a CAGR of 26.7% from 2025 to 2030. Rise in demand for IoT technology-based devices will drive the sensor market.

Major Market Trends & Insights

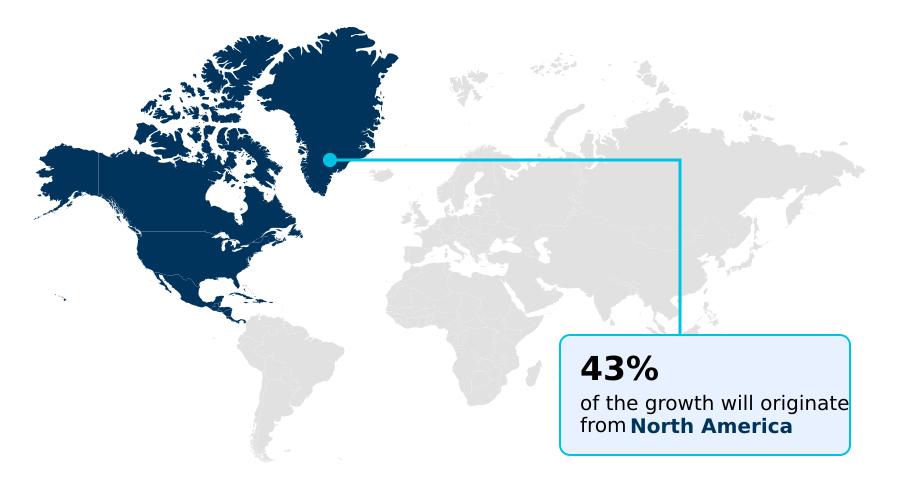
  • North America dominated the market and accounted for a 42.8% growth during the forecast period.
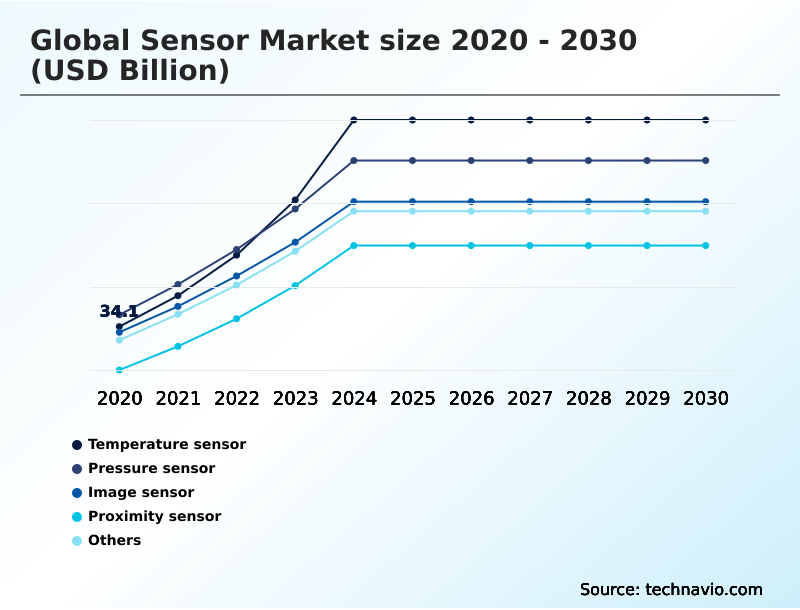
  • By Type - Temperature sensor segment was valued at USD 70.8 billion in 2024
  • By Connectivity - Wired sensor segment accounted for the largest market revenue share in 2024

Market Size & Forecast

  • Market Opportunities: USD 983.2 billion
  • Market Future Opportunities: USD 794.3 billion
  • CAGR from 2025 to 2030 : 26.7%

Market Summary

  • The sensor market is a critical enabler of digital transformation, focused on devices that measure physical parameters for industrial, commercial, and consumer applications. Growth is fueled by the proliferation of IoT, which relies on wireless sensor networks and low power consumption sensors to deliver real-time data acquisition for automation and remote monitoring.
  • A key trend is the integration of wearable biometric sensors into consumer health and wellness devices, driving sensor miniaturization trends. In industrial settings, predictive maintenance sensors are pivotal. For instance, in a complex supply chain, vibration sensors for structural health monitoring on vehicles and environmental monitoring sensors in warehouses can reduce spoilage and equipment downtime, optimizing logistics.
  • However, the market faces challenges related to the high complexity of multi-sensor fusion and the cybersecurity risks of network embedded sensors. The need for precise sensor calibration techniques and a robust semiconductor fabrication process also impacts production costs and scalability, requiring continuous innovation to balance performance with affordability across machine vision systems and other advanced platforms.
  • This ecosystem, built on technologies like micro-electro-mechanical systems, is integral to modern data-driven operations and intelligent transportation systems.

What will be the Size of the Sensor Market during the forecast period?

Get Key Insights on Market Forecast (PDF) Request Free Sample

How is the Sensor Market Segmented?

The sensor industry research report provides comprehensive data (region-wise segment analysis), with forecasts and estimates in "USD billion" for the period 2026-2030, as well as historical data from 2020-2024 for the following segments.

  • Type
    • Temperature sensor
    • Pressure sensor
    • Image sensor
    • Proximity sensor
    • Others
  • Connectivity
    • Wired sensor
    • Wireless sensor
  • End-user
    • Electronics
    • IT and telecom
    • Automotive
    • Industrial
    • Others
  • Technology
    • CMOS
    • MEMS
    • NEMS
    • Others
  • Geography
    • North America
      • US
      • Canada
      • Mexico
    • APAC
      • China
      • Japan
      • India
    • Europe
      • Germany
      • UK
      • France
    • Middle East and Africa
      • Saudi Arabia
      • UAE
      • South Africa
    • South America
      • Brazil
      • Argentina
      • Colombia
    • Rest of World (ROW)

By Type Insights

The temperature sensor segment is estimated to witness significant growth during the forecast period.

The temperature sensor segment is foundational, driven by its extensive use in industrial, commercial, and consumer sectors. These devices are crucial for monitoring thermal conditions, enabling precise industrial process control and safety protocols.

Applications span from manufacturing and healthcare to automotive systems, where real-time data acquisition supports operational stability and regulatory compliance. The adoption of smart manufacturing frameworks and predictive maintenance sensors further elevates demand.

Advanced semiconductor fabrication process and sensor calibration techniques are improving performance, with some systems achieving up to a 15% enhancement in control accuracy.

As industries increasingly prioritize efficiency and data-driven operations, the need for reliable low power consumption sensors and environmental monitoring sensors integrated within wireless sensor networks remains consistently high.

Request Free Sample

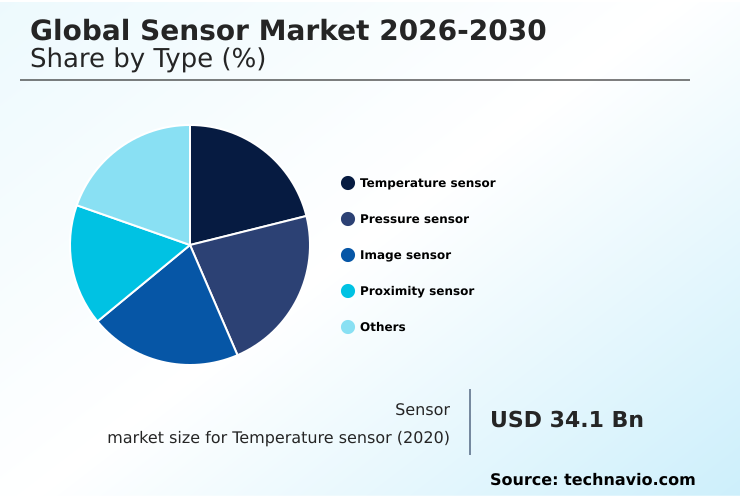
The Temperature sensor segment was valued at USD 70.8 billion in 2024 and showed a gradual increase during the forecast period.

Request Free Sample

Regional Analysis

North America is estimated to contribute 42.8% to the growth of the global market during the forecast period.Technavio’s analysts have elaborately explained the regional trends and drivers that shape the market during the forecast period.

See How Sensor Market Demand is Rising in North America Request Free Sample

The market's geographic landscape is characterized by robust growth across key regions, with North America and APAC at the forefront.

North America, accounting for over 42% of the market's incremental growth, leads in the adoption of automotive ADAS sensors and medical diagnostic sensors, driven by high R&D investment and stringent regulatory standards.

The region's focus on smart grid management and industrial automation reinforces its position.

Meanwhile, APAC is the fastest-growing region, expanding at a rate nearly 3% higher than Europe, fueled by its dominance in consumer electronics manufacturing and the rapid deployment of smart city sensor networks.

This expansion is driving demand for low-cost sensors for consumer electronics and components supporting AI-driven virtual sensing, establishing the region as a critical hub for both production and consumption.

Market Dynamics

Our researchers analyzed the data with 2025 as the base year, along with the key drivers, trends, and challenges. A holistic analysis of drivers will help companies refine their marketing strategies to gain a competitive advantage.

  • Strategic decision-making in the global sensor market 2026-2030 requires a deep understanding of competing technologies and applications. The debate over cmos vs mems sensor performance is central to product design, especially in low-cost sensors for consumer electronics where cost is paramount.
  • In industrial settings, the focus is on ROI, with industrial iot predictive maintenance sensors becoming a standard for optimizing asset uptime. The role of sensors in industry 4.0 is expanding beyond simple monitoring to enabling fully autonomous systems.
  • Key applications driving innovation include wearable device health monitoring applications and the complex requirements for sensors for autonomous vehicle navigation, which often rely on sensor fusion for enhanced accuracy. Concurrently, the deployment of smart city environmental monitoring solutions is scaling rapidly.
  • However, significant hurdles remain, including the persistent challenges in wireless sensor network security and the growing cybersecurity risks in network embedded sensors. The evolution of advancements in medical biosensor technology and nems technology in advanced diagnostics highlights the push toward higher precision.
  • From remote sensing for precision agriculture to image sensors in machine vision systems, the entire ecosystem is affected by the calibration requirements for high-precision sensors. For example, systems leveraging vibration sensors for structural health monitoring can reduce maintenance costs by more than double the amount compared to traditional scheduled inspections.
  • Other critical areas include the use of pressure sensors in automotive systems, proximity sensors for robotic applications, and developing sustainable energy harvesting for wireless sensors. Finally, the viability of high-temperature sensors for industrial automation depends on overcoming material and integration complexities.

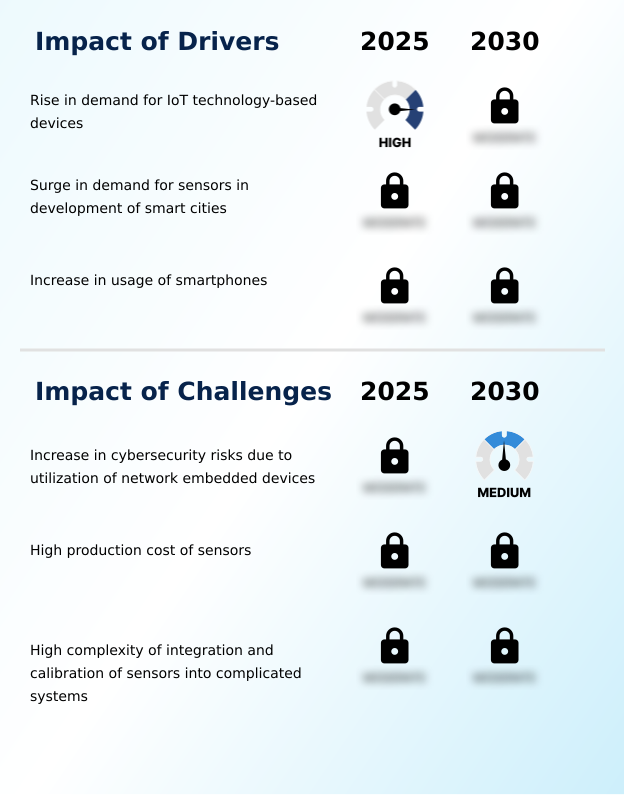
What are the key market drivers leading to the rise in the adoption of Sensor Industry?

  • A rising demand for devices based on IoT technology is a key driver for the market's growth.

  • Market growth is fundamentally driven by the expanding IoT ecosystem, where wireless sensor networks facilitate real-time data acquisition across industries, boosting operational efficiency by an average of 18%.
  • The development of smart city sensor networks is another critical driver, enabling municipalities to reduce energy consumption by over 15% through intelligent lighting and traffic management. This relies on a variety of environmental monitoring sensors and low power consumption sensors.
  • Concurrently, the proliferation of smartphones integrating sophisticated complementary metal-oxide-semiconductor image sensors and inertial measurement units continues to fuel demand.
  • These devices leverage platforms like the AI virtual smart sensor platform to deliver advanced features, creating a cycle of innovation that also benefits automotive ADAS sensors and other connected mobility solutions.
  • The demand for augmented reality sensors and biometric authentication sensors is also rising.

What are the market trends shaping the Sensor Industry?

  • The increasing adoption of wearable devices emerges as an influential market trend, driven by consumer and industrial demand for real-time health and environmental data.

  • Key market trends are centered on embedding intelligence and connectivity into smaller, more efficient devices. The rise of wearable biometric sensors is a primary driver, with new devices improving health tracking accuracy by over 25% compared to previous generations. In industrial sectors, the move toward smart manufacturing frameworks leverages predictive maintenance sensors to reduce unplanned downtime by up to 40%.
  • This trend is supported by advancements in micro-electro-mechanical systems and sensor miniaturization trends that allow for integration into robotics and automated system control. Furthermore, remote sensing technologies, utilizing hyperspectral detectors and LIDAR terrain mapping, are expanding capabilities in agriculture and environmental management, providing data that enhances resource allocation and crop yield analysis.
  • Digital twin technology is also becoming more prevalent across these applications, along with acoustic wave sensors and haptic feedback systems.

What challenges does the Sensor Industry face during its growth?

  • The increase in cybersecurity risks associated with the utilization of network-embedded devices presents a key challenge to industry growth.

  • Despite strong demand, the market faces significant challenges, primarily the cybersecurity vulnerabilities of network embedded sensors. Addressing these threats can increase initial development costs by as much as 25%. The complexity of system integration and the need for precise sensor calibration techniques also present hurdles, with integration efforts often accounting for up to 40% of a project's total deployment budget.
  • High production costs, influenced by the intricate semiconductor fabrication process and volatile raw material prices, restrain wider adoption of advanced technologies like nanoelectromechanical systems and high-precision navigation modules. Ensuring interoperability within cyber-physical systems and mastering multi-sensor fusion require specialized expertise, which can slow the pace of deployment for complex applications like autonomous decision making and industrial process control.

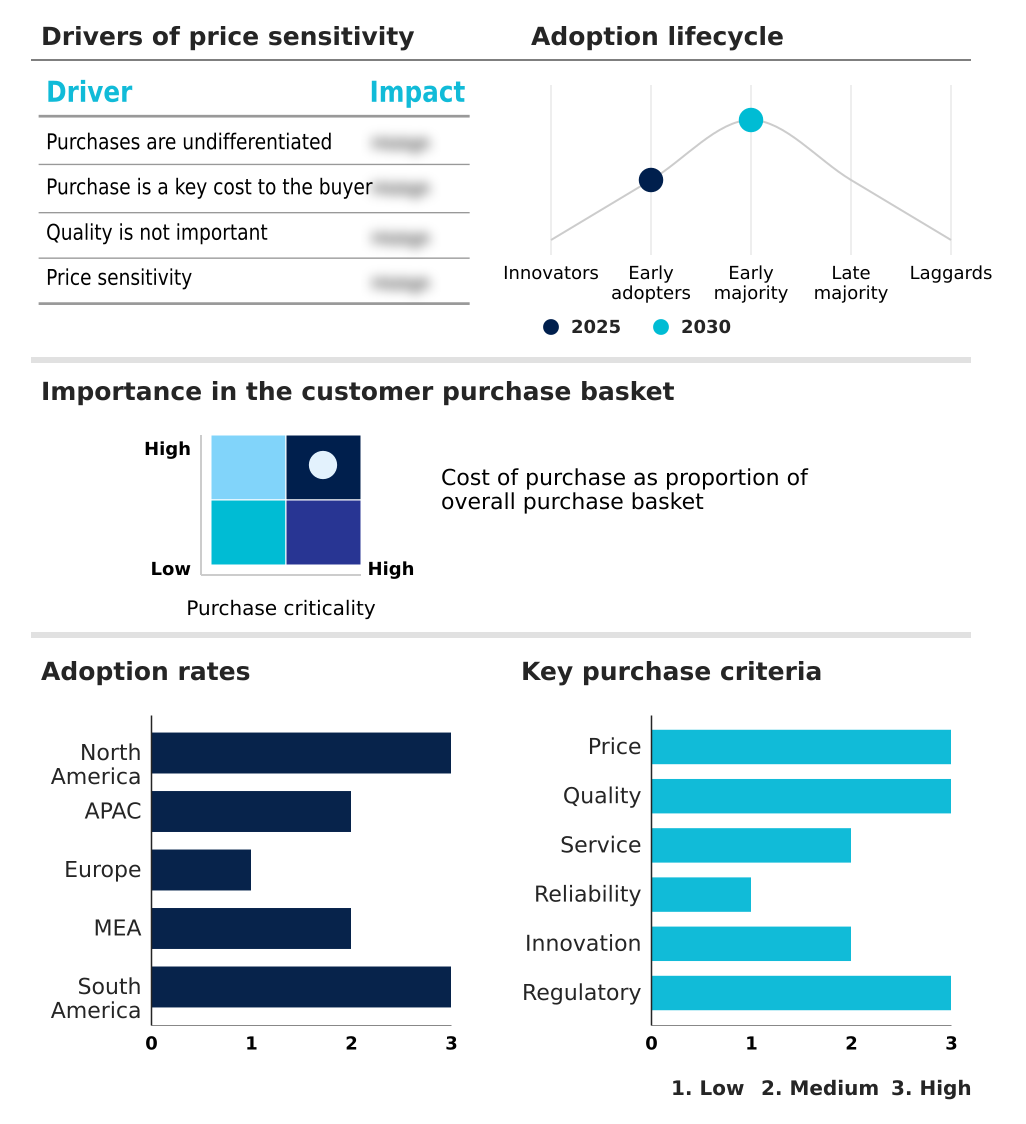
Exclusive Technavio Analysis on Customer Landscape

The sensor market forecasting report includes the adoption lifecycle of the market, covering from the innovator’s stage to the laggard’s stage. It focuses on adoption rates in different regions based on penetration. Furthermore, the sensor market report also includes key purchase criteria and drivers of price sensitivity to help companies evaluate and develop their market growth analysis strategies.

Customer Landscape of Sensor Industry

Competitive Landscape

Companies are implementing various strategies, such as strategic alliances, sensor market forecast, partnerships, mergers and acquisitions, geographical expansion, and product/service launches, to enhance their presence in the industry.

ABB Ltd. - A portfolio of sensor technologies provides critical measurement data, including temperature, pressure, and position, for diverse industrial and commercial applications.

The industry research and growth report includes detailed analyses of the competitive landscape of the market and information about key companies, including:

  • ABB Ltd.
  • DENSO Corp.
  • Honeywell International Inc.
  • Infineon Technologies AG
  • Keyence Corp.
  • NXP Semiconductors NV
  • OMRON Corp.
  • Panasonic Holdings Corp.
  • Robert Bosch GmbH
  • Rockwell Automation Inc.
  • Samsung Electronics Co. Ltd.
  • Schneider Electric SE
  • Sensata Technologies Inc.
  • SICK AG
  • Sony Group Corp.
  • STMicroelectronics NV
  • TE Connectivity plc
  • Texas Instruments Inc.

Qualitative and quantitative analysis of companies has been conducted to help clients understand the wider business environment as well as the strengths and weaknesses of key industry players. Data is qualitatively analyzed to categorize companies as pure play, category-focused, industry-focused, and diversified; it is quantitatively analyzed to categorize companies as dominant, leading, strong, tentative, and weak.

Recent Development and News in Sensor market

  • In November, 2024, Siemens expanded its Industrial Operations X platform by introducing new smart sensing devices designed to support condition monitoring and predictive maintenance in industrial and energy infrastructure.
  • In January, 2025, HT-Nova Limited Company launched its First Find series of high-performance sensors at the Sensor Test Expo, including photoionization detectors and bioaerosol sensors for advanced environmental monitoring.
  • In March, 2025, Elliptic Labs announced the integration of its AI Virtual Smart Sensor Platform into seven new smartphone models from Transsion and vivo, enabling features like proximity detection without dedicated hardware.
  • In March, 2025, Zebra Technologies showcased new solutions at ProMat 2025, advancing intelligent automation in warehousing and supply chains through sensor-integrated asset tracking and environmental monitoring.

Dive into Technavio’s robust research methodology, blending expert interviews, extensive data synthesis, and validated models for unparalleled Sensor Market insights. See full methodology.

Market Scope
Page number 338
Base year 2025
Historic period 2020-2024
Forecast period 2026-2030
Growth momentum & CAGR Accelerate at a CAGR of 26.7%
Market growth 2026-2030 USD 794.3 billion
Market structure Fragmented
YoY growth 2025-2026(%) 21.1%
Key countries US, Canada, Mexico, China, Japan, India, South Korea, Australia, Indonesia, Germany, UK, France, Italy, Spain, The Netherlands, Saudi Arabia, UAE, South Africa, Israel, Turkey, Brazil, Argentina and Colombia
Competitive landscape Leading Companies, Market Positioning of Companies, Competitive Strategies, and Industry Risks

Request Free Sample

Research Analyst Overview

  • The Sensor Market's evolution is defined by relentless innovation in core technologies like micro-electro-mechanical systems and complementary metal-oxide-semiconductor, with nanoelectromechanical systems emerging for ultra-high-precision tasks. Boardroom decisions are increasingly shaped by sensor miniaturization trends, compelling companies to invest in advanced semiconductor fabrication process to compete in the wearables sector.
  • This strategic pivot has led to R&D spending on miniaturization being 50% higher than on conventional sensor development. Key components such as the AI virtual smart sensor platform and multi-parameter MEMS sensor are enabling smarter devices.
  • Specialized photoionization detectors and bioaerosol sensors are critical for environmental monitoring sensors, while raman spectroscopy sensors and RGB-IR image sensor technology advance machine vision systems. From industrial process control to in-cabin monitoring cameras, the demand for real-time data acquisition is universal. Predictive maintenance sensors and tactile sensing technology are transforming automated system control and robotics.
  • This progress relies on sensor calibration techniques, digital signal processing, and achieving low power consumption sensors, particularly within complex wireless sensor networks. Innovations like back-side illumination, stacked CMOS architectures, and 3D sensor integration are crucial for next-generation medical diagnostic sensors and automotive ADAS sensors.

What are the Key Data Covered in this Sensor Market Research and Growth Report?

  • What is the expected growth of the Sensor Market between 2026 and 2030?

    • USD 794.3 billion, at a CAGR of 26.7%

  • What segmentation does the market report cover?

    • The report is segmented by Type (Temperature sensor, Pressure sensor, Image sensor, Proximity sensor, and Others), Connectivity (Wired sensor, and Wireless sensor), End-user (Electronics, IT and telecom, Automotive, Industrial, and Others), Technology (CMOS, MEMS, NEMS, and Others) and Geography (North America, APAC, Europe, Middle East and Africa, South America)

  • Which regions are analyzed in the report?

    • North America, APAC, Europe, Middle East and Africa and South America

  • What are the key growth drivers and market challenges?

    • Rise in demand for IoT technology-based devices, Increase in cybersecurity risks due to utilization of network embedded devices

  • Who are the major players in the Sensor Market?

    • ABB Ltd., DENSO Corp., Honeywell International Inc., Infineon Technologies AG, Keyence Corp., NXP Semiconductors NV, OMRON Corp., Panasonic Holdings Corp., Robert Bosch GmbH, Rockwell Automation Inc., Samsung Electronics Co. Ltd., Schneider Electric SE, Sensata Technologies Inc., SICK AG, Sony Group Corp., STMicroelectronics NV, TE Connectivity plc and Texas Instruments Inc.

Market Research Insights

  • The market is driven by the integration of advanced sensing capabilities into core business operations. Technologies like LIDAR terrain mapping and optical imaging technology are enhancing high-precision navigation in autonomous systems, improving operational safety. The implementation of data-driven industrial operations, supported by process variable monitoring and automated quality assurance, has been shown to increase production throughput by over 15%.
  • In logistics, the use of asset tracking technologies enhances supply chain visibility by up to 30%. Intelligent transportation systems leverage multi-sensor fusion to manage traffic flow, while smart grid management relies on energy management sensors for efficiency.
  • The push for environmental compliance monitoring and the adoption of AI-driven virtual sensing in consumer devices further underscore the market's diverse impact across industries.

We can help! Our analysts can customize this sensor market research report to meet your requirements.

Get in touch

1. Executive Summary

1.1 Market overview

Executive Summary - Chart on Market Overview
Executive Summary - Data Table on Market Overview
Executive Summary - Chart on Global Market Characteristics
Executive Summary - Chart on Market by Geography
Executive Summary - Chart on Market Segmentation by Type
Executive Summary - Chart on Market Segmentation by Connectivity
Executive Summary - Chart on Market Segmentation by End-user
Executive Summary - Chart on Market Segmentation by Technology
Executive Summary - Chart on Incremental Growth
Executive Summary - Data Table on Incremental Growth
Executive Summary - Chart on Company Market Positioning

2. Technavio Analysis

2.1 Analysis of price sensitivity, lifecycle, customer purchase basket, adoption rates, and purchase criteria

2.2 Criticality of inputs and Factors of differentiation

Chart on Overview on criticality of inputs and factors of differentiation

2.3 Factors of disruption

Chart on Overview on factors of disruption

2.4 Impact of drivers and challenges

Chart on Impact of drivers and challenges in 2025 and 2030

3. Market Landscape

3.1 Market ecosystem

Chart on Parent Market
Data Table on - Parent Market

3.2 Market characteristics

Chart on Market characteristics analysis

3.3 Value chain analysis

Chart on Value chain analysis

4. Market Sizing

4.1 Market definition

Data Table on Offerings of companies included in the market definition

4.2 Market segment analysis

Market segments

4.3 Market size 2025

4.4 Market outlook: Forecast for 2025-2030

Chart on Global - Market size and forecast 2025-2030 ($ billion)
Data Table on Global - Market size and forecast 2025-2030 ($ billion)
Chart on Global Market: Year-over-year growth 2025-2030 (%)
Data Table on Global Market: Year-over-year growth 2025-2030 (%)

5. Historic Market Size

5.1 Global Sensor Market 2020 - 2024

Historic Market Size - Data Table on Global Sensor Market 2020 - 2024 ($ billion)

5.2 Type segment analysis 2020 - 2024

Historic Market Size - Type Segment 2020 - 2024 ($ billion)

5.3 Connectivity segment analysis 2020 - 2024

Historic Market Size - Connectivity Segment 2020 - 2024 ($ billion)

5.4 End-user segment analysis 2020 - 2024

Historic Market Size - End-user Segment 2020 - 2024 ($ billion)

5.5 Technology segment analysis 2020 - 2024

Historic Market Size - Technology Segment 2020 - 2024 ($ billion)

5.6 Geography segment analysis 2020 - 2024

Historic Market Size - Geography Segment 2020 - 2024 ($ billion)

5.7 Country segment analysis 2020 - 2024

Historic Market Size - Country Segment 2020 - 2024 ($ billion)

6. Qualitative Analysis

6.1 AI Impact on the Global Sensor Market

7. Five Forces Analysis

7.1 Five forces summary

Five forces analysis - Comparison between 2025 and 2030

7.2 Bargaining power of buyers

Bargaining power of buyers - Impact of key factors 2025 and 2030

7.3 Bargaining power of suppliers

Bargaining power of suppliers - Impact of key factors in 2025 and 2030

7.4 Threat of new entrants

Threat of new entrants - Impact of key factors in 2025 and 2030

7.5 Threat of substitutes

Threat of substitutes - Impact of key factors in 2025 and 2030

7.6 Threat of rivalry

Threat of rivalry - Impact of key factors in 2025 and 2030

7.7 Market condition

Chart on Market condition - Five forces 2025 and 2030

8. Market Segmentation by Type

8.1 Market segments

Chart on Type - Market share 2025-2030 (%)
Data Table on Type - Market share 2025-2030 (%)

8.2 Comparison by Type

Chart on Comparison by Type
Data Table on Comparison by Type

8.3 Temperature sensor - Market size and forecast 2025-2030

Chart on Temperature sensor - Market size and forecast 2025-2030 ($ billion)
Data Table on Temperature sensor - Market size and forecast 2025-2030 ($ billion)
Chart on Temperature sensor - Year-over-year growth 2025-2030 (%)
Data Table on Temperature sensor - Year-over-year growth 2025-2030 (%)

8.4 Pressure sensor - Market size and forecast 2025-2030

Chart on Pressure sensor - Market size and forecast 2025-2030 ($ billion)
Data Table on Pressure sensor - Market size and forecast 2025-2030 ($ billion)
Chart on Pressure sensor - Year-over-year growth 2025-2030 (%)
Data Table on Pressure sensor - Year-over-year growth 2025-2030 (%)

8.5 Image sensor - Market size and forecast 2025-2030

Chart on Image sensor - Market size and forecast 2025-2030 ($ billion)
Data Table on Image sensor - Market size and forecast 2025-2030 ($ billion)
Chart on Image sensor - Year-over-year growth 2025-2030 (%)
Data Table on Image sensor - Year-over-year growth 2025-2030 (%)

8.6 Proximity sensor - Market size and forecast 2025-2030

Chart on Proximity sensor - Market size and forecast 2025-2030 ($ billion)
Data Table on Proximity sensor - Market size and forecast 2025-2030 ($ billion)
Chart on Proximity sensor - Year-over-year growth 2025-2030 (%)
Data Table on Proximity sensor - Year-over-year growth 2025-2030 (%)

8.7 Others - Market size and forecast 2025-2030

Chart on Others - Market size and forecast 2025-2030 ($ billion)
Data Table on Others - Market size and forecast 2025-2030 ($ billion)
Chart on Others - Year-over-year growth 2025-2030 (%)
Data Table on Others - Year-over-year growth 2025-2030 (%)

8.8 Market opportunity by Type

Market opportunity by Type ($ billion)
Data Table on Market opportunity by Type ($ billion)

9. Market Segmentation by Connectivity

9.1 Market segments

Chart on Connectivity - Market share 2025-2030 (%)
Data Table on Connectivity - Market share 2025-2030 (%)

9.2 Comparison by Connectivity

Chart on Comparison by Connectivity
Data Table on Comparison by Connectivity

9.3 Wired sensor - Market size and forecast 2025-2030

Chart on Wired sensor - Market size and forecast 2025-2030 ($ billion)
Data Table on Wired sensor - Market size and forecast 2025-2030 ($ billion)
Chart on Wired sensor - Year-over-year growth 2025-2030 (%)
Data Table on Wired sensor - Year-over-year growth 2025-2030 (%)

9.4 Wireless sensor - Market size and forecast 2025-2030

Chart on Wireless sensor - Market size and forecast 2025-2030 ($ billion)
Data Table on Wireless sensor - Market size and forecast 2025-2030 ($ billion)
Chart on Wireless sensor - Year-over-year growth 2025-2030 (%)
Data Table on Wireless sensor - Year-over-year growth 2025-2030 (%)

9.5 Market opportunity by Connectivity

Market opportunity by Connectivity ($ billion)
Data Table on Market opportunity by Connectivity ($ billion)

10. Market Segmentation by End-user

10.1 Market segments

Chart on End-user - Market share 2025-2030 (%)
Data Table on End-user - Market share 2025-2030 (%)

10.2 Comparison by End-user

Chart on Comparison by End-user
Data Table on Comparison by End-user

10.3 Electronics - Market size and forecast 2025-2030

Chart on Electronics - Market size and forecast 2025-2030 ($ billion)
Data Table on Electronics - Market size and forecast 2025-2030 ($ billion)
Chart on Electronics - Year-over-year growth 2025-2030 (%)
Data Table on Electronics - Year-over-year growth 2025-2030 (%)

10.4 IT and telecom - Market size and forecast 2025-2030

Chart on IT and telecom - Market size and forecast 2025-2030 ($ billion)
Data Table on IT and telecom - Market size and forecast 2025-2030 ($ billion)
Chart on IT and telecom - Year-over-year growth 2025-2030 (%)
Data Table on IT and telecom - Year-over-year growth 2025-2030 (%)

10.5 Automotive - Market size and forecast 2025-2030

Chart on Automotive - Market size and forecast 2025-2030 ($ billion)
Data Table on Automotive - Market size and forecast 2025-2030 ($ billion)
Chart on Automotive - Year-over-year growth 2025-2030 (%)
Data Table on Automotive - Year-over-year growth 2025-2030 (%)

10.6 Industrial - Market size and forecast 2025-2030

Chart on Industrial - Market size and forecast 2025-2030 ($ billion)
Data Table on Industrial - Market size and forecast 2025-2030 ($ billion)
Chart on Industrial - Year-over-year growth 2025-2030 (%)
Data Table on Industrial - Year-over-year growth 2025-2030 (%)

10.7 Others - Market size and forecast 2025-2030

Chart on Others - Market size and forecast 2025-2030 ($ billion)
Data Table on Others - Market size and forecast 2025-2030 ($ billion)
Chart on Others - Year-over-year growth 2025-2030 (%)
Data Table on Others - Year-over-year growth 2025-2030 (%)

10.8 Market opportunity by End-user

Market opportunity by End-user ($ billion)
Data Table on Market opportunity by End-user ($ billion)

11. Market Segmentation by Technology

11.1 Market segments

Chart on Technology - Market share 2025-2030 (%)
Data Table on Technology - Market share 2025-2030 (%)

11.2 Comparison by Technology

Chart on Comparison by Technology
Data Table on Comparison by Technology

11.3 CMOS - Market size and forecast 2025-2030

Chart on CMOS - Market size and forecast 2025-2030 ($ billion)
Data Table on CMOS - Market size and forecast 2025-2030 ($ billion)
Chart on CMOS - Year-over-year growth 2025-2030 (%)
Data Table on CMOS - Year-over-year growth 2025-2030 (%)

11.4 MEMS - Market size and forecast 2025-2030

Chart on MEMS - Market size and forecast 2025-2030 ($ billion)
Data Table on MEMS - Market size and forecast 2025-2030 ($ billion)
Chart on MEMS - Year-over-year growth 2025-2030 (%)
Data Table on MEMS - Year-over-year growth 2025-2030 (%)

11.5 NEMS - Market size and forecast 2025-2030

Chart on NEMS - Market size and forecast 2025-2030 ($ billion)
Data Table on NEMS - Market size and forecast 2025-2030 ($ billion)
Chart on NEMS - Year-over-year growth 2025-2030 (%)
Data Table on NEMS - Year-over-year growth 2025-2030 (%)

11.6 Others - Market size and forecast 2025-2030

Chart on Others - Market size and forecast 2025-2030 ($ billion)
Data Table on Others - Market size and forecast 2025-2030 ($ billion)
Chart on Others - Year-over-year growth 2025-2030 (%)
Data Table on Others - Year-over-year growth 2025-2030 (%)

11.7 Market opportunity by Technology

Market opportunity by Technology ($ billion)
Data Table on Market opportunity by Technology ($ billion)

12. Customer Landscape

12.1 Customer landscape overview

Analysis of price sensitivity, lifecycle, customer purchase basket, adoption rates, and purchase criteria

13. Geographic Landscape

13.1 Geographic segmentation

Chart on Market share by geography 2025-2030 (%)
Data Table on Market share by geography 2025-2030 (%)

13.2 Geographic comparison

Chart on Geographic comparison
Data Table on Geographic comparison

13.3 North America - Market size and forecast 2025-2030

Chart on North America - Market size and forecast 2025-2030 ($ billion)
Data Table on North America - Market size and forecast 2025-2030 ($ billion)
Chart on North America - Year-over-year growth 2025-2030 (%)
Data Table on North America - Year-over-year growth 2025-2030 (%)
Chart on Regional Comparison - North America
Data Table on Regional Comparison - North America

13.3.1 US - Market size and forecast 2025-2030

Chart on US - Market size and forecast 2025-2030 ($ billion)
Data Table on US - Market size and forecast 2025-2030 ($ billion)
Chart on US - Year-over-year growth 2025-2030 (%)
Data Table on US - Year-over-year growth 2025-2030 (%)

13.3.2 Canada - Market size and forecast 2025-2030

Chart on Canada - Market size and forecast 2025-2030 ($ billion)
Data Table on Canada - Market size and forecast 2025-2030 ($ billion)
Chart on Canada - Year-over-year growth 2025-2030 (%)
Data Table on Canada - Year-over-year growth 2025-2030 (%)

13.3.3 Mexico - Market size and forecast 2025-2030

Chart on Mexico - Market size and forecast 2025-2030 ($ billion)
Data Table on Mexico - Market size and forecast 2025-2030 ($ billion)
Chart on Mexico - Year-over-year growth 2025-2030 (%)
Data Table on Mexico - Year-over-year growth 2025-2030 (%)

13.4 APAC - Market size and forecast 2025-2030

Chart on APAC - Market size and forecast 2025-2030 ($ billion)
Data Table on APAC - Market size and forecast 2025-2030 ($ billion)
Chart on APAC - Year-over-year growth 2025-2030 (%)
Data Table on APAC - Year-over-year growth 2025-2030 (%)
Chart on Regional Comparison - APAC
Data Table on Regional Comparison - APAC

13.4.1 China - Market size and forecast 2025-2030

Chart on China - Market size and forecast 2025-2030 ($ billion)
Data Table on China - Market size and forecast 2025-2030 ($ billion)
Chart on China - Year-over-year growth 2025-2030 (%)
Data Table on China - Year-over-year growth 2025-2030 (%)

13.4.2 Japan - Market size and forecast 2025-2030

Chart on Japan - Market size and forecast 2025-2030 ($ billion)
Data Table on Japan - Market size and forecast 2025-2030 ($ billion)
Chart on Japan - Year-over-year growth 2025-2030 (%)
Data Table on Japan - Year-over-year growth 2025-2030 (%)

13.4.3 India - Market size and forecast 2025-2030

Chart on India - Market size and forecast 2025-2030 ($ billion)
Data Table on India - Market size and forecast 2025-2030 ($ billion)
Chart on India - Year-over-year growth 2025-2030 (%)
Data Table on India - Year-over-year growth 2025-2030 (%)

13.4.4 South Korea - Market size and forecast 2025-2030

Chart on South Korea - Market size and forecast 2025-2030 ($ billion)
Data Table on South Korea - Market size and forecast 2025-2030 ($ billion)
Chart on South Korea - Year-over-year growth 2025-2030 (%)
Data Table on South Korea - Year-over-year growth 2025-2030 (%)

13.4.5 Australia - Market size and forecast 2025-2030

Chart on Australia - Market size and forecast 2025-2030 ($ billion)
Data Table on Australia - Market size and forecast 2025-2030 ($ billion)
Chart on Australia - Year-over-year growth 2025-2030 (%)
Data Table on Australia - Year-over-year growth 2025-2030 (%)

13.4.6 Indonesia - Market size and forecast 2025-2030

Chart on Indonesia - Market size and forecast 2025-2030 ($ billion)
Data Table on Indonesia - Market size and forecast 2025-2030 ($ billion)
Chart on Indonesia - Year-over-year growth 2025-2030 (%)
Data Table on Indonesia - Year-over-year growth 2025-2030 (%)

13.5 Europe - Market size and forecast 2025-2030

Chart on Europe - Market size and forecast 2025-2030 ($ billion)
Data Table on Europe - Market size and forecast 2025-2030 ($ billion)
Chart on Europe - Year-over-year growth 2025-2030 (%)
Data Table on Europe - Year-over-year growth 2025-2030 (%)
Chart on Regional Comparison - Europe
Data Table on Regional Comparison - Europe

13.5.1 Germany - Market size and forecast 2025-2030

Chart on Germany - Market size and forecast 2025-2030 ($ billion)
Data Table on Germany - Market size and forecast 2025-2030 ($ billion)
Chart on Germany - Year-over-year growth 2025-2030 (%)
Data Table on Germany - Year-over-year growth 2025-2030 (%)

13.5.2 UK - Market size and forecast 2025-2030

Chart on UK - Market size and forecast 2025-2030 ($ billion)
Data Table on UK - Market size and forecast 2025-2030 ($ billion)
Chart on UK - Year-over-year growth 2025-2030 (%)
Data Table on UK - Year-over-year growth 2025-2030 (%)

13.5.3 France - Market size and forecast 2025-2030

Chart on France - Market size and forecast 2025-2030 ($ billion)
Data Table on France - Market size and forecast 2025-2030 ($ billion)
Chart on France - Year-over-year growth 2025-2030 (%)
Data Table on France - Year-over-year growth 2025-2030 (%)

13.5.4 Italy - Market size and forecast 2025-2030

Chart on Italy - Market size and forecast 2025-2030 ($ billion)
Data Table on Italy - Market size and forecast 2025-2030 ($ billion)
Chart on Italy - Year-over-year growth 2025-2030 (%)
Data Table on Italy - Year-over-year growth 2025-2030 (%)

13.5.5 Spain - Market size and forecast 2025-2030

Chart on Spain - Market size and forecast 2025-2030 ($ billion)
Data Table on Spain - Market size and forecast 2025-2030 ($ billion)
Chart on Spain - Year-over-year growth 2025-2030 (%)
Data Table on Spain - Year-over-year growth 2025-2030 (%)

13.5.6 The Netherlands - Market size and forecast 2025-2030

Chart on The Netherlands - Market size and forecast 2025-2030 ($ billion)
Data Table on The Netherlands - Market size and forecast 2025-2030 ($ billion)
Chart on The Netherlands - Year-over-year growth 2025-2030 (%)
Data Table on The Netherlands - Year-over-year growth 2025-2030 (%)

13.6 Middle East and Africa - Market size and forecast 2025-2030

Chart on Middle East and Africa - Market size and forecast 2025-2030 ($ billion)
Data Table on Middle East and Africa - Market size and forecast 2025-2030 ($ billion)
Chart on Middle East and Africa - Year-over-year growth 2025-2030 (%)
Data Table on Middle East and Africa - Year-over-year growth 2025-2030 (%)
Chart on Regional Comparison - Middle East and Africa
Data Table on Regional Comparison - Middle East and Africa

13.6.1 Saudi Arabia - Market size and forecast 2025-2030

Chart on Saudi Arabia - Market size and forecast 2025-2030 ($ billion)
Data Table on Saudi Arabia - Market size and forecast 2025-2030 ($ billion)
Chart on Saudi Arabia - Year-over-year growth 2025-2030 (%)
Data Table on Saudi Arabia - Year-over-year growth 2025-2030 (%)

13.6.2 UAE - Market size and forecast 2025-2030

Chart on UAE - Market size and forecast 2025-2030 ($ billion)
Data Table on UAE - Market size and forecast 2025-2030 ($ billion)
Chart on UAE - Year-over-year growth 2025-2030 (%)
Data Table on UAE - Year-over-year growth 2025-2030 (%)

13.6.3 South Africa - Market size and forecast 2025-2030

Chart on South Africa - Market size and forecast 2025-2030 ($ billion)
Data Table on South Africa - Market size and forecast 2025-2030 ($ billion)
Chart on South Africa - Year-over-year growth 2025-2030 (%)
Data Table on South Africa - Year-over-year growth 2025-2030 (%)

13.6.4 Israel - Market size and forecast 2025-2030

Chart on Israel - Market size and forecast 2025-2030 ($ billion)
Data Table on Israel - Market size and forecast 2025-2030 ($ billion)
Chart on Israel - Year-over-year growth 2025-2030 (%)
Data Table on Israel - Year-over-year growth 2025-2030 (%)

13.6.5 Turkey - Market size and forecast 2025-2030

Chart on Turkey - Market size and forecast 2025-2030 ($ billion)
Data Table on Turkey - Market size and forecast 2025-2030 ($ billion)
Chart on Turkey - Year-over-year growth 2025-2030 (%)
Data Table on Turkey - Year-over-year growth 2025-2030 (%)

13.7 South America - Market size and forecast 2025-2030

Chart on South America - Market size and forecast 2025-2030 ($ billion)
Data Table on South America - Market size and forecast 2025-2030 ($ billion)
Chart on South America - Year-over-year growth 2025-2030 (%)
Data Table on South America - Year-over-year growth 2025-2030 (%)
Chart on Regional Comparison - South America
Data Table on Regional Comparison - South America

13.7.1 Brazil - Market size and forecast 2025-2030

Chart on Brazil - Market size and forecast 2025-2030 ($ billion)
Data Table on Brazil - Market size and forecast 2025-2030 ($ billion)
Chart on Brazil - Year-over-year growth 2025-2030 (%)
Data Table on Brazil - Year-over-year growth 2025-2030 (%)

13.7.2 Argentina - Market size and forecast 2025-2030

Chart on Argentina - Market size and forecast 2025-2030 ($ billion)
Data Table on Argentina - Market size and forecast 2025-2030 ($ billion)
Chart on Argentina - Year-over-year growth 2025-2030 (%)
Data Table on Argentina - Year-over-year growth 2025-2030 (%)

13.7.3 Colombia - Market size and forecast 2025-2030

Chart on Colombia - Market size and forecast 2025-2030 ($ billion)
Data Table on Colombia - Market size and forecast 2025-2030 ($ billion)
Chart on Colombia - Year-over-year growth 2025-2030 (%)
Data Table on Colombia - Year-over-year growth 2025-2030 (%)

13.8 Market opportunity by geography

Market opportunity by geography ($ billion)
Data Tables on Market opportunity by geography ($ billion)

14. Drivers, Challenges, and Opportunity

14.1 Market drivers

Rise in demand for IoT technology-based devices
Surge in demand for sensors in development of smart cities
Increase in usage of smartphones

14.2 Market challenges

Increase in cybersecurity risks due to utilization of network embedded devices
High production cost of sensors
High complexity of integration and calibration of sensors into complicated systems

14.3 Impact of drivers and challenges

Impact of drivers and challenges in 2025 and 2030

14.4 Market opportunities

Rise in adoption of wearable devices
Increasing implementation of automation in industrial sectors
Rising applications in remote sensing

15. Competitive Landscape

15.1 Overview

15.2

Overview on criticality of inputs and factors of differentiation

15.3 Landscape disruption

Overview on factors of disruption

15.4 Industry risks

Impact of key risks on business

16. Competitive Analysis

16.1 Companies profiled

Companies covered

16.2 Company ranking index

16.3 Market positioning of companies

Matrix on companies position and classification

16.4 ABB Ltd.

ABB Ltd. - Overview
ABB Ltd. - Business segments
ABB Ltd. - Key news
ABB Ltd. - Key offerings
ABB Ltd. - Segment focus
SWOT

16.5 DENSO Corp.

DENSO Corp. - Overview
DENSO Corp. - Business segments
DENSO Corp. - Key news
DENSO Corp. - Key offerings
DENSO Corp. - Segment focus
SWOT

16.6 Honeywell International Inc.

Honeywell International Inc. - Overview
Honeywell International Inc. - Business segments
Honeywell International Inc. - Key news
Honeywell International Inc. - Key offerings
Honeywell International Inc. - Segment focus
SWOT

16.7 Infineon Technologies AG

Infineon Technologies AG - Overview
Infineon Technologies AG - Business segments
Infineon Technologies AG - Key news
Infineon Technologies AG - Key offerings
Infineon Technologies AG - Segment focus
SWOT

16.8 NXP Semiconductors NV

NXP Semiconductors NV - Overview
NXP Semiconductors NV - Product / Service
NXP Semiconductors NV - Key offerings
SWOT

16.9 OMRON Corp.

OMRON Corp. - Overview
OMRON Corp. - Business segments
OMRON Corp. - Key news
OMRON Corp. - Key offerings
OMRON Corp. - Segment focus
SWOT

16.10 Panasonic Holdings Corp.

Panasonic Holdings Corp. - Overview
Panasonic Holdings Corp. - Business segments
Panasonic Holdings Corp. - Key news
Panasonic Holdings Corp. - Key offerings
Panasonic Holdings Corp. - Segment focus
SWOT

16.11 Robert Bosch GmbH

Robert Bosch GmbH - Overview
Robert Bosch GmbH - Product / Service
Robert Bosch GmbH - Key news
Robert Bosch GmbH - Key offerings
SWOT

16.12 Rockwell Automation Inc.

Rockwell Automation Inc. - Overview
Rockwell Automation Inc. - Business segments
Rockwell Automation Inc. - Key news
Rockwell Automation Inc. - Key offerings
Rockwell Automation Inc. - Segment focus
SWOT

16.13 Samsung Electronics Co. Ltd.

Samsung Electronics Co. Ltd. - Overview
Samsung Electronics Co. Ltd. - Business segments
Samsung Electronics Co. Ltd. - Key news
Samsung Electronics Co. Ltd. - Key offerings
Samsung Electronics Co. Ltd. - Segment focus
SWOT

16.14 Schneider Electric SE

Schneider Electric SE - Overview
Schneider Electric SE - Business segments
Schneider Electric SE - Key news
Schneider Electric SE - Key offerings
Schneider Electric SE - Segment focus
SWOT

16.15 Sony Group Corp.

Sony Group Corp. - Overview
Sony Group Corp. - Business segments
Sony Group Corp. - Key offerings
Sony Group Corp. - Segment focus
SWOT

16.16 STMicroelectronics NV

STMicroelectronics NV - Overview
STMicroelectronics NV - Business segments
STMicroelectronics NV - Key news
STMicroelectronics NV - Key offerings
STMicroelectronics NV - Segment focus
SWOT

16.17 TE Connectivity plc

TE Connectivity plc - Overview
TE Connectivity plc - Business segments
TE Connectivity plc - Key news
TE Connectivity plc - Key offerings
TE Connectivity plc - Segment focus
SWOT

16.18 Texas Instruments Inc.

Texas Instruments Inc. - Overview
Texas Instruments Inc. - Business segments
Texas Instruments Inc. - Key offerings
Texas Instruments Inc. - Segment focus
SWOT

17. Appendix

17.1 Scope of the report

Market definition
Objectives
Notes and caveats

17.2 Inclusions and exclusions checklist

Inclusions checklist
Exclusions checklist

17.3 Currency conversion rates for US$

17.4 Research methodology

17.5 Data procurement

Information sources

17.6 Data validation

17.7 Validation techniques employed for market sizing

17.8 Data synthesis

17.9 360 degree market analysis

17.10 List of abbreviations

Research Methodology

Technavio presents a detailed picture of the market by way of study, synthesis, and summation of data from multiple sources. The analysts have presented the various facets of the market with a particular focus on identifying the key industry influencers. The data thus presented is comprehensive, reliable, and the result of extensive research, both primary and secondary.

INFORMATION SOURCES

Primary sources

  • Manufacturers and suppliers
  • Channel partners
  • Industry experts
  • Strategic decision makers

Secondary sources

  • Industry journals and periodicals
  • Government data
  • Financial reports of key industry players
  • Historical data
  • Press releases

DATA ANALYSIS

Data Synthesis

  • Collation of data
  • Estimation of key figures
  • Analysis of derived insights

Data Validation

  • Triangulation with data models
  • Reference against proprietary databases
  • Corroboration with industry experts

REPORT WRITING

Qualitative

  • Market drivers
  • Market challenges
  • Market trends
  • Five forces analysis

Quantitative

  • Market size and forecast
  • Market segmentation
  • Geographical insights
  • Competitive landscape

Interested in this report?

Get your sample now to see our research methodology and insights!

Download Now

Frequently Asked Questions

Sensor market growth will increase by USD 794.3 billion during 2026-2030.

The Sensor market is expected to grow at a CAGR of 26.7% during 2026-2030.

Sensor market is segmented by Type (Temperature sensor, Pressure sensor, Image sensor, Proximity sensor, Others) Connectivity (Wired sensor, Wireless sensor) End-user (Electronics, IT and telecom, Automotive, Industrial, Others) Technology (CMOS, MEMS, NEMS, Others)

ABB Ltd., DENSO Corp., Honeywell International Inc., Infineon Technologies AG, Keyence Corp., NXP Semiconductors NV, OMRON Corp., Panasonic Holdings Corp., Robert Bosch GmbH, Rockwell Automation Inc., Samsung Electronics Co. Ltd., Schneider Electric SE, Sensata Technologies Inc., SICK AG, Sony Group Corp., STMicroelectronics NV, TE Connectivity plc, Texas Instruments Inc. are a few of the key vendors in the Sensor market.

North America will register the highest growth rate of 42.8% among the other regions. Therefore, the Sensor market in North America is expected to garner significant business opportunities for the vendors during the forecast period.

US, Canada, Mexico, China, Japan, India, South Korea, Australia, Indonesia, Germany, UK, France, Italy, Spain, The Netherlands, Saudi Arabia, UAE, South Africa, Israel, Turkey, Brazil, Argentina, Colombia

  • Rise in demand for IoT technology-based devices is the driving factor this market.

The Sensor market vendors should focus on grabbing business opportunities from the Type segment as it accounted for the largest market share in the base year.
RIA - Research AI Assistant
Ask RIA