
Intelligent Traffic Management Market Size 2025-2029
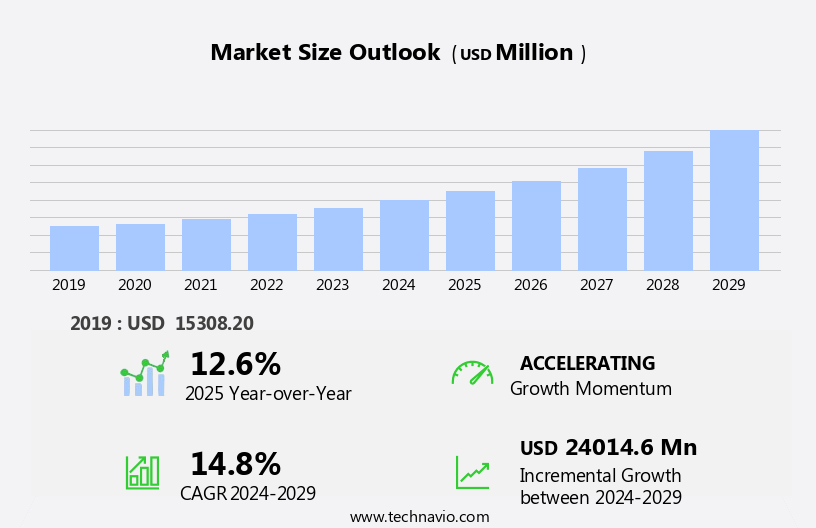
The intelligent traffic management market size is forecast to increase by USD 24.01 billion at a CAGR of 14.8% between 2024 and 2029.
- The market is experiencing significant growth due to the increasing demand for advanced, AI-based traffic solutions. This demand is driven by the escalating number of vehicles on the road and the resulting need for more efficient and effective traffic management systems. However, the market faces challenges as well. The lack of skilled professionals in government traffic organizations poses a significant barrier to the implementation and maintenance of these complex systems. Despite these challenges, the market presents numerous opportunities for companies seeking to capitalize on the growing demand for intelligent traffic management solutions.
- Green traffic lights, on-demand transportation, and shared mobility services are also gaining popularity, contributing to the evolution of the traffic management infrastructure. Strategic partnerships, collaborations, and investments in research and development are key strategies for companies looking to stay competitive in this dynamic market. By addressing the skills gap and continuing to innovate, companies can help ensure the successful implementation and adoption of intelligent traffic management systems, ultimately improving traffic flow, reducing congestion, and enhancing public safety.
What will be the Size of the Intelligent Traffic Management Market during the forecast period?
- The market in the United States is experiencing significant growth, driven by the increasing demand for next-generation traffic management solutions. Traffic safety technologies, such as real-time traffic information, dynamic traffic routing, and pedestrian detection systems, are becoming essential components of the smart mobility ecosystem. The integration of traffic data acquisition and data-driven traffic management is revolutionizing urban traffic management, leading to road safety improvement and sustainable transportation. Traffic management innovation continues to shape the industry, with a focus on transportation network analysis, traffic data visualization, and traffic congestion mitigation.
- Intelligent parking management and traffic incident detection are essential components of the market, ensuring efficient and safe traffic flow. The market is also witnessing the emergence of mobility-as-a-service (MaaS) platforms, which are transforming the way people move around cities. The market's growth is further fueled by the development of traffic management standards and the increasing adoption of data-driven approaches. The trend towards sustainable traffic management is also influencing the market, with a focus on reducing carbon emissions and improving overall transportation efficiency. In summary, the market in the United States is a dynamic and rapidly evolving industry, driven by the demand for next-generation traffic management solutions and the integration of data-driven approaches. The market's growth is underpinned by the need for improved traffic operations management, sustainable transportation, and the development of a smart mobility ecosystem.
How is the Intelligent Traffic Management Industry segmented?
The intelligent traffic management industry research report provides comprehensive data (region-wise segment analysis), with forecasts and estimates in "USD million" for the period 2025-2029, as well as historical data from 2019-2023 for the following segments.
- Solution
- Traffic monitoring system
- Traffic signal control system
- Traffic enforcement camera
- Integrated corridor management
- Others
- Component
- Surveillance cameras
- Video walls
- Traffic controllers and signals
- Others
- End-user
- Government authorities
- Transport agencies
- Commercial
- Geography
- North America
- US
- Canada
- Europe
- France
- Germany
- Italy
- UK
- APAC
- China
- India
- Japan
- South Korea
- South America
- Middle East and Africa
- North America
By Solution Insights
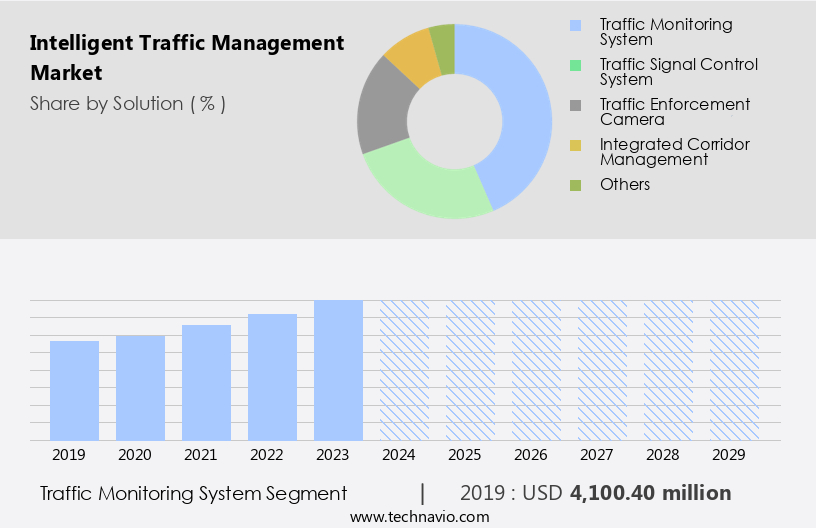
The traffic monitoring system segment is estimated to witness significant growth during the forecast period. The market is witnessing significant advancements, particularly in the Traffic Monitoring Systems segment. By 2029, this segment is expected to evolve substantially, integrating advanced sensor technologies, video analytics, and real-time data processing frameworks. These systems will shift from reactive to proactive approaches, utilizing predictive analytics algorithms to anticipate congestion patterns and optimize signal timings dynamically. IoT-enabled devices and edge computing architectures will facilitate faster data transmission and localized decision-making, minimizing latency in traffic management operations. Furthermore, multimodal transportation data, including public transit schedules, ride-sharing platforms, and pedestrian flow metrics, will be incorporated to create comprehensive traffic management ecosystems. Artificial Intelligence (AI) and Machine Learning will play a pivotal role in analyzing traffic data and providing data-driven decision-making capabilities.
Cloud-based platforms and Smart City Initiatives will further enhance the efficiency of traffic management services. The adoption of Vehicle-to-Infrastructure (V2I) communication and Connected Vehicle Technology will enable real-time traffic data sharing, improving traffic flow optimization and congestion management. Public-Private Partnerships (PPPs) will also contribute to the growth of the market, fostering infrastructure investment and innovation in traffic management technology. The integration of Smart Traffic Lights, Dynamic Route Guidance, and Urban Mobility Solutions will ensure smoother traffic operations and promote environmental sustainability. Traffic Safety and Pedestrian Safety will remain key priorities, with the deployment of advanced traffic monitoring systems and adaptive traffic control mechanisms. Overall, the market is poised for substantial growth, driven by the integration of advanced technologies, data analytics, and multimodal transportation data.
Get a glance at the market report of share of various segments Request Free Sample
The Traffic monitoring system segment was valued at USD 4.1 billion in 2019 and showed a gradual increase during the forecast period.
Regional Analysis
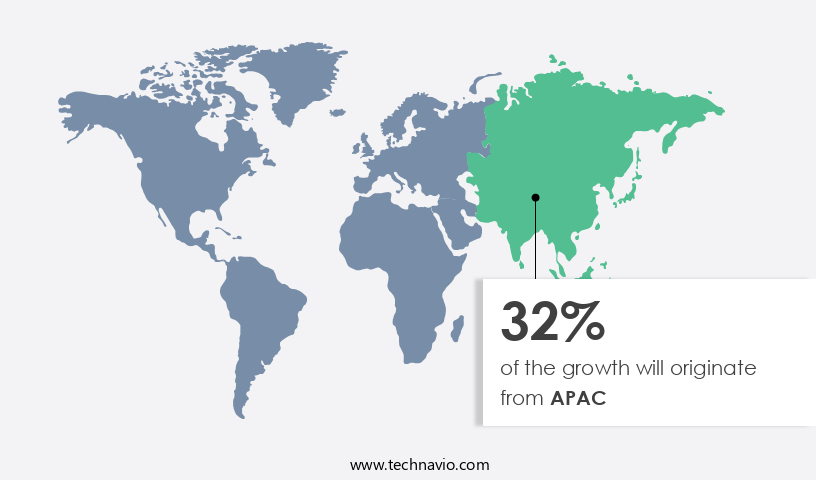
APAC is estimated to contribute 32% to the growth of the global market during the forecast period. Technavio's analysts have elaborately explained the regional trends and drivers that shape the market during the forecast period.
For more insights on the market size of various regions, Request Free Sample
The market in North America is experiencing significant growth due to the increasing number of traffic jams, high infrastructure development costs, and the imperative to enhance road safety. In the US alone, annual losses from traffic congestion amount to approximately USD 74 billion, including indirect expenses such as increased fuel prices and delayed product deliveries. To mitigate these issues, various solutions are being adopted, including Data Visualization for real-time traffic monitoring, AI and Machine Learning for predictive traffic forecasting, and Edge Computing for processing large amounts of data at the source. Green Transportation initiatives, such as Shared Mobility and Ride-sharing Services, are also gaining popularity to reduce the number of vehicles on the road.
Furthermore, the implementation of Smart Infrastructure, including Smart Traffic Lights and Adaptive Traffic Control, is improving traffic flow optimization and congestion management. Public-Private Partnerships (PPPs) and Cloud-based Platforms are essential for the integration of various Traffic Management Technologies, such as Vehicle-to-Infrastructure (V2I), Real-time Traffic Data, and Traffic Monitoring Systems. Urban Design and Transportation Engineering are also crucial in creating sustainable transportation solutions and ensuring Pedestrian Safety. The market trends also include the adoption of Automated Enforcement Systems, Connected Vehicle Technology, and Traffic Management Consulting to enhance overall traffic management services and promote Road Safety.
Market Dynamics
Our researchers analyzed the data with 2024 as the base year, along with the key drivers, trends, and challenges. A holistic analysis of drivers will help companies refine their marketing strategies to gain a competitive advantage.
What are the key market drivers leading to the rise in the adoption of Intelligent Traffic Management Industry?
- Increasing demand for AI-based smart traffic solutions is the key driver of the market. AI-driven traffic management solutions have revolutionized the way traffic authorities monitor and manage traffic junctions and railway crossings. By implementing technologies such as vehicle detection and number plate identification, traffic violators can be identified and penalized through mailed penalty receipts, thereby reducing administrative workload and costs. Additionally, AI's ability to collect and analyze traffic data on specific roads aids authorities in formulating effective policies and assessing infrastructure requirements.
- Furthermore, AI-based unmanned railway crossings prevent accidents by monitoring and controlling railway crossings, ensuring public safety. These advanced solutions offer significant benefits, including increased efficiency, reduced costs, and enhanced safety.
What are the market trends shaping the Intelligent Traffic Management Industry?
- An increasing number of vehicles on the road is the upcoming market trend. The market is experiencing significant growth due to the increasing number of vehicles on roads worldwide. With expanding urban populations and rising middle-class incomes, particularly in developing economies, vehicle ownership is on the rise. This trend contributes to severe traffic congestion, longer commute times, increased fuel consumption, and elevated air pollution levels, which traditional traffic management methods struggle to effectively address. Intelligent traffic management systems offer a comprehensive solution to these challenges by utilizing advanced technologies such as real-time traffic monitoring, predictive analytics, AI, IoT, and adaptive signal control. These systems help optimize traffic flow, reduce delays, and improve road safety by dynamically adjusting traffic signals, managing incidents, and rerouting traffic based on real-time conditions.
- The integration of these technologies enables efficient management of traffic and enhances overall transportation infrastructure. Intelligent traffic management systems contribute to reducing fuel consumption and decreasing emissions, making them an essential component of sustainable transportation solutions. The market's growth is further driven by the increasing demand for smart cities and the integration of transportation systems into urban infrastructure. The adoption of these systems is expected to continue as governments and private organizations invest in advanced transportation solutions to address the challenges of urbanization and population growth.
What challenges does the Intelligent Traffic Management Industry face during its growth?
- Lack of skilled professionals in government traffic organizations is a key challenge affecting the industry's growth. Intelligent traffic management systems, which incorporate IT and artificial intelligence (AI) technologies, are increasingly being adopted by government authorities to improve traffic flow and enhance road safety. However, the effective utilization of these advanced systems hinges on the expertise of traffic controllers. A lack of awareness among controllers regarding the capabilities of intelligent traffic management systems can lead to underutilization of features such as real-time analytics, automated signal optimization, and predictive traffic modeling. Furthermore, integrating and maintaining technologies like IoT sensors, adaptive traffic lights, and centralized data platforms requires specialized skills. Public sector agencies often encounter bureaucratic challenges and limited training budgets, making it difficult to upskill existing staff.
- As intelligent traffic management systems continue to evolve, the demand for IT and AI-related knowledge will only grow, placing additional pressure on governments with limited digital infrastructure experience. It is essential for government agencies to invest in training programs and collaborate with technology companies to ensure the successful implementation and management of intelligent traffic management systems.
Exclusive Customer Landscape
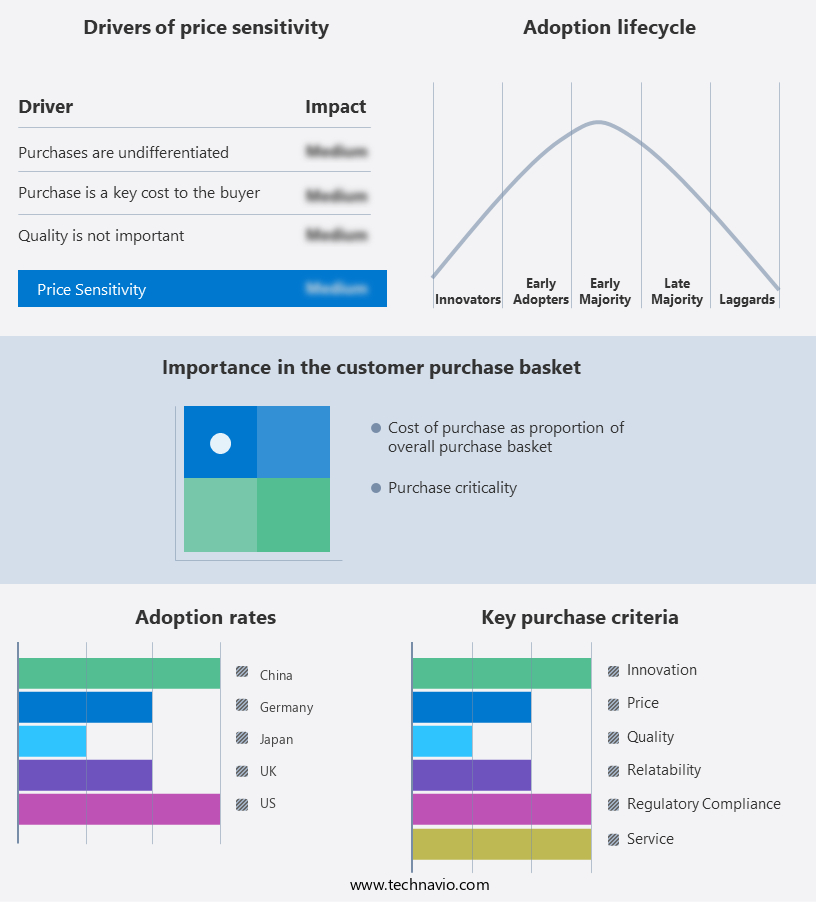
The intelligent traffic management market forecasting report includes the adoption lifecycle of the market, covering from the innovator's stage to the laggard's stage. It focuses on adoption rates in different regions based on penetration. Furthermore, the intelligent traffic management market report also includes key purchase criteria and drivers of price sensitivity to help companies evaluate and develop their market growth analysis strategies.
Customer Landscape
Key Companies & Market Insights
Companies are implementing various strategies, such as strategic alliances, intelligent traffic management market forecast, partnerships, mergers and acquisitions, geographical expansion, and product/service launches, to enhance their presence in the industry.
Chevron Traffic Management - The company offers intelligent traffic management system such as Intellicone incursion prevention and warning system, Intellitag, Intellicone smart taper and Intellicam.
The industry research and growth report includes detailed analyses of the competitive landscape of the market and information about key companies, including:
- Chevron Traffic Management
- Cisco Systems Inc.
- Cubic Corp.
- Huawei Technologies Co. Ltd.
- INRIX Inc.
- International Business Machines Corp.
- Kapsch TrafficCom AG
- Light Crossing Technology Corp.
- PTV Planung Transport Verkehr AG
- Q Free ASA
- Rekor Systems Inc.
- Siemens AG
- SNC Lavalin Group Inc.
- SWARCO AG
- TagMaster AB
- Teledyne Technologies Inc.
- Telegra d.o.o.
- Thales Group
- TomTom NV
- TransCore
Qualitative and quantitative analysis of companies has been conducted to help clients understand the wider business environment as well as the strengths and weaknesses of key industry players. Data is qualitatively analyzed to categorize companies as pure play, category-focused, industry-focused, and diversified; it is quantitatively analyzed to categorize companies as dominant, leading, strong, tentative, and weak.
Research Analyst Overview
The market is witnessing significant growth as transportation systems evolve to become more efficient, sustainable, and connected. Green transportation initiatives are gaining momentum, driving the demand for traffic planning solutions that prioritize the reduction of carbon emissions and promote the use of alternative modes of transport. Ride-sharing services and ride-hailing platforms are revolutionizing urban mobility, leading to an increased need for real-time traffic data and dynamic route guidance. Edge computing and artificial intelligence (AI) are being integrated into traffic management systems to process and analyze data in real-time, enabling quicker response times and adaptive traffic control. Incident management and congestion management are critical aspects of traffic flow optimization, with big data analytics and machine learning algorithms playing a crucial role in predicting and mitigating traffic disruptions.
Sustainable transportation solutions, such as public transportation management and shared mobility services, are also being integrated into traffic management systems to reduce the number of vehicles on the road and promote environmental sustainability. Smart infrastructure, including traffic monitoring systems and adaptive traffic signal control, is becoming increasingly important in managing traffic flow and improving urban mobility. Cloud-based platforms and video analytics are being used to collect and analyze data from various sources, enabling data-driven decision making and improving traffic operations. Multimodal transportation and fleet management are also key areas of focus in the traffic management market. Real-time traffic data and dynamic route guidance are essential for optimizing fleet operations and reducing fuel consumption.
Automated enforcement systems and machine learning algorithms are being used to improve traffic safety and reduce congestion. Smart city initiatives are driving the development of urban mobility solutions, including smart traffic lights, parking management, and pedestrian safety systems. Public-private partnerships (PPPs) are being used to fund infrastructure investment and develop innovative traffic management technologies, such as vehicle-to-infrastructure (V2I) communication and connected vehicle technology. The traffic management market is also seeing significant growth in the areas of transportation demand management, traffic simulation, and transportation engineering. Adaptive traffic control and traffic signal control are being used to optimize traffic flow and reduce congestion, while traffic monitoring systems and traffic data analytics are being used to improve traffic operations and promote urban design that prioritizes pedestrian safety and accessibility.
The market is experiencing significant growth as transportation systems become more connected, efficient, and sustainable. Green transportation initiatives, ride-sharing services, edge computing, and AI are driving innovation in traffic planning and management, while smart infrastructure, data analytics, and urban mobility solutions are improving traffic flow and promoting environmental sustainability. The market is expected to continue growing as cities invest in traffic management technology and initiatives to address the challenges of urban mobility.
|
Market Scope |
|
|
Report Coverage |
Details |
|
Page number |
233 |
|
Base year |
2024 |
|
Historic period |
2019-2023 |
|
Forecast period |
2025-2029 |
|
Growth momentum & CAGR |
Accelerate at a CAGR of 14.8% |
|
Market growth 2025-2029 |
USD 24.01 billion |
|
Market structure |
Fragmented |
|
YoY growth 2024-2025(%) |
12.6 |
|
Key countries |
US, China, UK, Canada, Japan, Germany, France, India, Italy, and South Korea |
|
Competitive landscape |
Leading Companies, Market Positioning of Companies, Competitive Strategies, and Industry Risks |
What are the Key Data Covered in this Intelligent Traffic Management Market Research and Growth Report?
- CAGR of the Intelligent Traffic Management industry during the forecast period
- Detailed information on factors that will drive the growth and forecasting between 2025 and 2029
- Precise estimation of the size of the market and its contribution of the industry in focus to the parent market
- Accurate predictions about upcoming growth and trends and changes in consumer behaviour
- Growth of the market across North America, Europe, APAC, South America, and Middle East and Africa
- Thorough analysis of the market's competitive landscape and detailed information about companies
- Comprehensive analysis of factors that will challenge the intelligent traffic management market growth and forecasting
We can help! Our analysts can customize this intelligent traffic management market research report to meet your requirements.
 RIA -
RIA - 
