Spare Parts Logistics Market Analysis, Size, and Forecast 2026-2030: APAC (China, Japan, and India), Europe (Germany, UK, and France), North America (US, Canada, and Mexico), South America (Brazil and Argentina), Middle East and Africa (Saudi Arabia, UAE, and South Africa), and Rest of World (ROW)

Spare Parts Logistics Market Analysis, Size, and Forecast 2026-2030:
APAC (China, Japan, and India), Europe (Germany, UK, and France), North America (US, Canada, and Mexico), South America (Brazil and Argentina), Middle East and Africa (Saudi Arabia, UAE, and South Africa), and Rest of World (ROW)

Published: Mar 2026 297 Pages SKU: IRTNTR40971

Market Overview at a Glance

$28.4 B
Market Opportunity
5.9%
CAGR 2025 - 2030
41.5%
APAC Growth
$27.4 B
Automotive segment 2024

Spare Parts Logistics Market Size 2026-2030

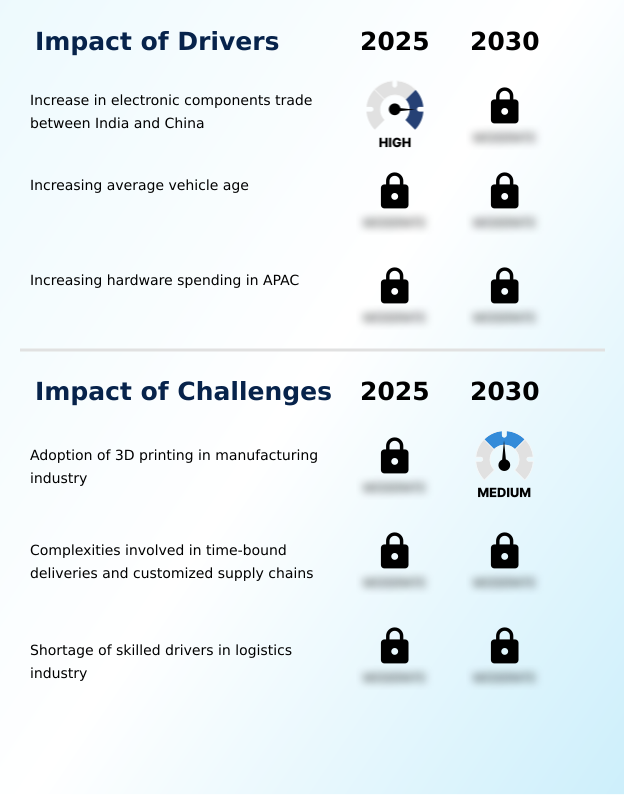
The spare parts logistics market size is valued to increase by USD 28.4 billion, at a CAGR of 5.9% from 2025 to 2030. Increase in electronic components trade between India and China will drive the spare parts logistics market.

Major Market Trends & Insights

  • APAC dominated the market and accounted for a 41.5% growth during the forecast period.
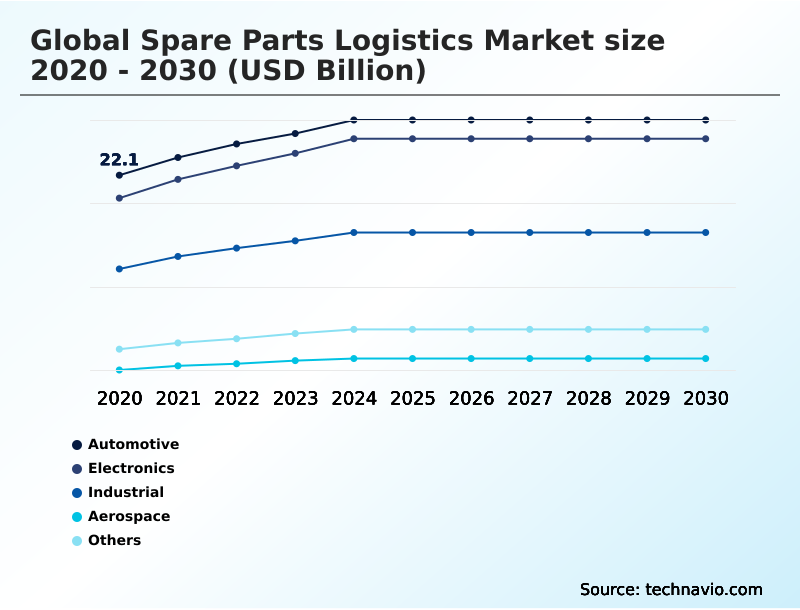
  • By End-user - Automotive segment was valued at USD 27.4 billion in 2024
  • By Type - Forward segment accounted for the largest market revenue share in 2024

Market Size & Forecast

  • Market Opportunities: USD 50.3 billion
  • Market Future Opportunities: USD 28.4 billion
  • CAGR from 2025 to 2030 : 5.9%

Market Summary

  • The spare parts logistics market is defined by its critical role in ensuring operational continuity across industries like automotive, aerospace, and electronics. Key drivers include the increasing average age of vehicles, which fuels demand for aftermarket parts, and rising hardware spending in APAC, which expands the installed base of equipment requiring maintenance.
  • A central trend is the digitalization of the supply chain, where technologies such as real-time tracking with iot sensors and blockchain provide unprecedented visibility and security.
  • For instance, a global manufacturer can use a predictive logistics network to anticipate component failure in its machinery, automatically dispatching a replacement part from a decentralized warehousing location before a breakdown occurs, thus minimizing costly downtime.
  • However, the industry faces challenges from the rise of additive manufacturing, which alters traditional stocking strategies, and the complexities of executing time-bound deliveries across customized, multi-speed supply chains. The ongoing shortage of skilled labor further complicates network reliability and cost structures, pushing firms toward greater automation and logistics network resilience.

What will be the Size of the Spare Parts Logistics Market during the forecast period?

Get Key Insights on Market Forecast (PDF) Request Free Sample

How is the Spare Parts Logistics Market Segmented?

The spare parts logistics industry research report provides comprehensive data (region-wise segment analysis), with forecasts and estimates in "USD billion" for the period 2026-2030, as well as historical data from 2020-2024 for the following segments.

  • End-user
    • Automotive
    • Electronics
    • Industrial
    • Aerospace
    • Others
  • Type
    • Forward
    • Reverse
  • Source
    • OEM channel
    • Independent aftermarket
  • Geography
    • APAC
      • China
      • Japan
      • India
    • Europe
      • Germany
      • UK
      • France
    • North America
      • US
      • Canada
      • Mexico
    • South America
      • Brazil
      • Argentina
    • Middle East and Africa
      • Saudi Arabia
      • UAE
      • South Africa
    • Rest of World (ROW)

By End-user Insights

The automotive segment is estimated to witness significant growth during the forecast period.

The automotive aftermarket segment is adapting to a dual-inventory reality, managing both traditional and electric vehicle components. This necessitates a resilient supply chain design focused on inventory optimization and forward logistics.

Advanced warehouse automation is becoming standard for handling the growing complexity of aftermarket spare parts. To ensure service continuity, strategies such as parts pooling and kitting are employed for time-critical delivery.

Some operators are exploring 3d printing for non-critical components to achieve lead time reduction, while IoT sensors enhance tracking, reducing errors in just-in-time delivery models by over 15%.

This strategic pivot ensures the automotive aftermarket remains responsive to evolving vehicle technologies and maintenance requirements.

Request Free Sample

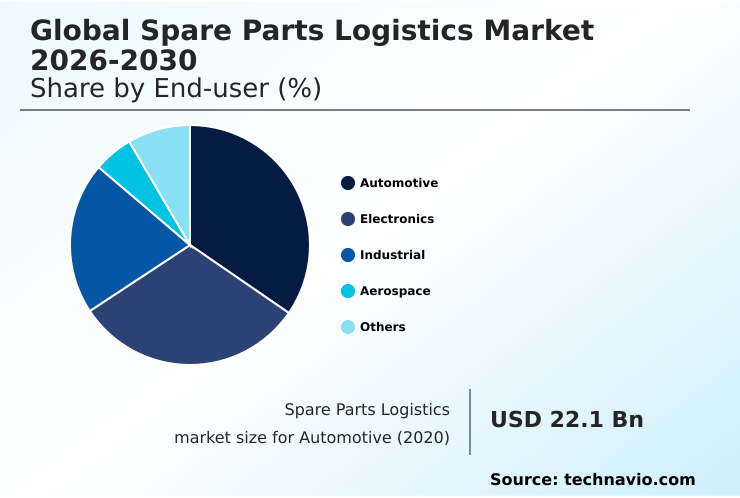
The Automotive segment was valued at USD 27.4 billion in 2024 and showed a gradual increase during the forecast period.

Request Free Sample

Regional Analysis

APAC is estimated to contribute 41.5% to the growth of the global market during the forecast period.Technavio’s analysts have elaborately explained the regional trends and drivers that shape the market during the forecast period.

See How Spare Parts Logistics Market Demand is Rising in APAC Request Free Sample

The APAC region, contributing 41.5% of incremental growth, leads the spare parts logistics market, driven by its expansive manufacturing base. In countries like China and India, effective demand forecasting and real-time tracking are critical for managing complex cross-border logistics.

Europe emphasizes circular economy logistics, using advanced reverse logistics and robotics to process returns, while North America leverages a mature transportation management system for logistics network resilience.

Innovations such as a predictive logistics network enable firms to meet service level agreements, while digital twin technology aids in network optimization. For example, some firms have improved delivery precision by 25% by integrating these technologies.

Specialized services, like a cold-chain solution for medical parts, are expanding globally.

Market Dynamics

Our researchers analyzed the data with 2025 as the base year, along with the key drivers, trends, and challenges. A holistic analysis of drivers will help companies refine their marketing strategies to gain a competitive advantage.

  • The evolution of the global spare parts logistics market is evident in how different sectors approach supply chain challenges. For the spare parts logistics for automotive industry, the focus is on managing a vast network for aftermarket distribution.
  • The impact of 3d printing on spare parts supply is a transformative factor, enabling on-demand production that challenges traditional freight forwarding for heavy machinery spare parts. Concurrently, the use of iot in spare parts warehouse management is becoming standard, enhancing supply chain visibility for service parts and enabling real-time tracking solutions for high-value parts.
  • This technology is crucial for optimizing last-mile delivery for industrial parts. In specialized sectors, blockchain for aerospace spare parts traceability ensures authenticity, while cold chain logistics for medical equipment parts guarantees integrity. The complexities of reverse logistics for electronic components highlight the growing importance of circular economy models in automotive spare parts.
  • To manage these diverse needs, firms employ ai-powered demand forecasting for aftermarket parts and sophisticated cost-to-serve models for aftermarket distribution. Strategies like decentralized warehousing strategies for spare parts and contract logistics for medical device spare parts are tailored to specific industry requirements.
  • Automating inventory for aircraft on ground support demonstrates a high level of sophistication, directly tied to service level agreement management in logistics, where response times are twice as fast as manual systems.
  • The role of digital twins in spare parts logistics is expanding, offering simulation capabilities to overcome the challenges of cross-border spare parts logistics and managing obsolescence in high-tech spare parts.

What are the key market drivers leading to the rise in the adoption of Spare Parts Logistics Industry?

  • The increasing trade of electronic components between India and China serves as a key driver for the spare parts logistics market by expanding the volume and complexity of cross-border component movements.

  • Increasing hardware spending, particularly in APAC, is a major driver, expanding the installed base of equipment requiring industrial machinery maintenance and aftermarket spare parts. This fuels demand for effective aftermarket distribution and procurement logistics to ensure operational uptime.
  • The rising average age of vehicles globally, with older models needing 20% more repairs, also boosts demand. Furthermore, growing trade between nations necessitates sophisticated cross-border logistics and improved customs clearance efficiency.
  • This has led to investment in decentralized warehousing and field stocking locations to support predictive maintenance strategies and time-definite routing. These localized hubs are crucial for complex sectors like medical device logistics and for optimizing last-mile delivery.

What are the market trends shaping the Spare Parts Logistics Industry?

  • The adoption of real-time tracking, enabled by the Internet of Things (IoT), is an influential trend. This technology is reshaping supply chain visibility and operational efficiency across logistics networks.

  • The adoption of digital technologies is a primary trend reshaping the market. A supply chain control tower provides enhanced supply chain visibility, critical for managing high-tech service parts and providing aircraft on ground (aog) support. The use of blockchain traceability and smart contracts ensures end-to-end traceability, reducing disputes by up to 40%.
  • Concurrently, mergers are enabling consolidation, allowing for integrated freight forwarding and advanced supply chain orchestration. Technology is also pivotal, with ai-driven inventory management optimizing multi-echelon inventory across global networks. Firms are increasingly using automated storage and retrieval systems and digital freight matching platforms, leading to a 25% improvement in warehouse throughput and logistics efficiency.

What challenges does the Spare Parts Logistics Industry face during its growth?

  • The adoption of 3D printing in the manufacturing industry is a primary challenge, disrupting established inventory models and supply chain dynamics for spare parts.

  • The rise of additive manufacturing and on-demand production presents a significant challenge, disrupting the traditional service supply chain and necessitating new approaches to component lifecycle management and obsolescence management. A detailed cost-to-serve analysis becomes critical as firms weigh printing versus shipping. The complexities of time-critical delivery and customized supply chains require dynamic inventory substitution and robust contract logistics.
  • A shortage of skilled drivers further strains the system, with spot market rates increasing by over 30% in some regions. An integrated logistics provider must now manage intricate returns management and asset recovery processes, often requiring specialized value-added warehousing capabilities to handle unpredictable flows.

Exclusive Technavio Analysis on Customer Landscape

The spare parts logistics market forecasting report includes the adoption lifecycle of the market, covering from the innovator’s stage to the laggard’s stage. It focuses on adoption rates in different regions based on penetration. Furthermore, the spare parts logistics market report also includes key purchase criteria and drivers of price sensitivity to help companies evaluate and develop their market growth analysis strategies.

Customer Landscape of Spare Parts Logistics Industry

Competitive Landscape

Companies are implementing various strategies, such as strategic alliances, spare parts logistics market forecast, partnerships, mergers and acquisitions, geographical expansion, and product/service launches, to enhance their presence in the industry.

CEVA Logistics SA - Specialized solutions integrate technology and regulatory compliance with time-critical order management, ensuring operational uptime and supply chain resilience for essential components.

The industry research and growth report includes detailed analyses of the competitive landscape of the market and information about key companies, including:

  • CEVA Logistics SA
  • Dachser SE
  • DB Cargo AG
  • DHL International GmbH
  • DSV AS
  • Expeditors International Inc.
  • FedEx Corp.
  • GEODIS
  • KLN Logistics Group Ltd.
  • Kuehne Nagel Management AG
  • Lufthansa Cargo AG
  • Nippon Express Holdings Inc.
  • Ryder System Inc.
  • Scan Global Logistics
  • SEKO Logistics
  • Toyota Motor Corp.
  • TVS Supply Chain Solutions
  • United Parcel Service Inc.
  • XPO Inc.

Qualitative and quantitative analysis of companies has been conducted to help clients understand the wider business environment as well as the strengths and weaknesses of key industry players. Data is qualitatively analyzed to categorize companies as pure play, category-focused, industry-focused, and diversified; it is quantitatively analyzed to categorize companies as dominant, leading, strong, tentative, and weak.

Recent Development and News in Spare parts logistics market

  • In August 2025, Caterpillar Incorporated finalized a strategic partnership with a software provider to integrate blockchain technology into its global parts tracking system, aiming to verify component authenticity and mitigate counterfeit risks.
  • In May 2025, FedEx Express launched an enhanced cold-chain solution in Europe, tailored for the high-speed transit of sensitive spare parts for medical diagnostic imaging equipment.
  • In March 2025, FedEx Corp. advanced its digital transformation by integrating artificial intelligence to predict customer demand and optimize delivery routes for its spare parts services.
  • In February 2025, the logistics division of BMW Group operationalized a new regional distribution center in Hungary, featuring hydrogen-powered material handling equipment to support the growing demand for electric vehicle components.

Dive into Technavio’s robust research methodology, blending expert interviews, extensive data synthesis, and validated models for unparalleled Spare Parts Logistics Market insights. See full methodology.

Market Scope
Page number 297
Base year 2025
Historic period 2020-2024
Forecast period 2026-2030
Growth momentum & CAGR Accelerate at a CAGR of 5.9%
Market growth 2026-2030 USD 28.4 billion
Market structure Fragmented
YoY growth 2025-2026(%) 5.6%
Key countries China, Japan, India, South Korea, Australia, Indonesia, Germany, UK, France, Italy, Spain, The Netherlands, US, Canada, Mexico, Brazil, Chile, Argentina, Saudi Arabia, UAE, South Africa, Israel and Turkey
Competitive landscape Leading Companies, Market Positioning of Companies, Competitive Strategies, and Industry Risks

Request Free Sample

Research Analyst Overview

  • The spare parts logistics market is undergoing a significant transformation driven by the need for enhanced supply chain visibility and efficiency. Core operations like forward logistics and reverse logistics are being redefined by technologies such as iot sensors and blockchain traceability, enabling real-time tracking from origin to end-use.
  • Companies are leveraging predictive maintenance and sophisticated demand forecasting to optimize multi-echelon inventory and reduce holding costs. The integration of warehouse automation, including robotics and automated storage and retrieval systems, is crucial for managing complex kitting and in-night delivery services, with some firms reporting a 30% reduction in order processing times.
  • This pivot towards technology directly influences boardroom decisions on capital expenditure for digital twin and smart contracts implementation. The market's evolution also addresses challenges in last-mile delivery and cross-border logistics through decentralized warehousing and field stocking locations.
  • As firms manage component lifecycle management and asset recovery, on-demand production via 3d printing and additive manufacturing offers a new paradigm for parts pooling and aftermarket distribution. This service supply chain requires robust freight forwarding and contract logistics to maintain service levels.

What are the Key Data Covered in this Spare Parts Logistics Market Research and Growth Report?

  • What is the expected growth of the Spare Parts Logistics Market between 2026 and 2030?

    • USD 28.4 billion, at a CAGR of 5.9%

  • What segmentation does the market report cover?

    • The report is segmented by End-user (Automotive, Electronics, Industrial, Aerospace, and Others), Type (Forward, and Reverse), Source (OEM channel, and Independent aftermarket) and Geography (APAC, Europe, North America, South America, Middle East and Africa)

  • Which regions are analyzed in the report?

    • APAC, Europe, North America, South America and Middle East and Africa

  • What are the key growth drivers and market challenges?

    • Increase in electronic components trade between India and China, Adoption of 3D printing in manufacturing industry

  • Who are the major players in the Spare Parts Logistics Market?

    • CEVA Logistics SA, Dachser SE, DB Cargo AG, DHL International GmbH, DSV AS, Expeditors International Inc., FedEx Corp., GEODIS, KLN Logistics Group Ltd., Kuehne Nagel Management AG, Lufthansa Cargo AG, Nippon Express Holdings Inc., Ryder System Inc., Scan Global Logistics, SEKO Logistics, Toyota Motor Corp., TVS Supply Chain Solutions, United Parcel Service Inc. and XPO Inc.

Market Research Insights

  • The spare parts logistics market is shaped by the imperative for operational uptime and resilient supply chain design. The shift toward a predictive logistics network allows companies to meet stringent service level agreements, reducing equipment downtime by up to 30%. Through advanced network optimization and cost-to-serve analysis, firms achieve greater efficiency, with some improving forecast accuracy by over 20%.
  • The management of aftermarket spare parts is increasingly complex, demanding localized inventory management and end-to-end traceability to ensure component authenticity and timely delivery. This strategic focus on integrated logistics providers and supply chain orchestration is essential for maintaining a competitive edge in a demanding global environment.

We can help! Our analysts can customize this spare parts logistics market research report to meet your requirements.

Get in touch

1. Executive Summary

1.1 Market overview

Executive Summary - Chart on Market Overview
Executive Summary - Data Table on Market Overview
Executive Summary - Chart on Global Market Characteristics
Executive Summary - Chart on Market by Geography
Executive Summary - Chart on Market Segmentation by End-user
Executive Summary - Chart on Market Segmentation by Type
Executive Summary - Chart on Market Segmentation by Source
Executive Summary - Chart on Incremental Growth
Executive Summary - Data Table on Incremental Growth
Executive Summary - Chart on Company Market Positioning

2. Technavio Analysis

2.1 Analysis of price sensitivity, lifecycle, customer purchase basket, adoption rates, and purchase criteria

2.2 Criticality of inputs and Factors of differentiation

Chart on Overview on criticality of inputs and factors of differentiation

2.3 Factors of disruption

Chart on Overview on factors of disruption

2.4 Impact of drivers and challenges

Chart on Impact of drivers and challenges in 2025 and 2030

3. Market Landscape

3.1 Market ecosystem

Chart on Parent Market
Data Table on - Parent Market

3.2 Market characteristics

Chart on Market characteristics analysis

3.3 Value chain analysis

Chart on Value chain analysis

4. Market Sizing

4.1 Market definition

Data Table on Offerings of companies included in the market definition

4.2 Market segment analysis

Market segments

4.3 Market size 2025

4.4 Market outlook: Forecast for 2025-2030

Chart on Global - Market size and forecast 2025-2030 ($ billion)
Data Table on Global - Market size and forecast 2025-2030 ($ billion)
Chart on Global Market: Year-over-year growth 2025-2030 (%)
Data Table on Global Market: Year-over-year growth 2025-2030 (%)

5. Historic Market Size

5.1 Global Spare Parts Logistics Market 2020 - 2024

Historic Market Size - Data Table on Global Spare Parts Logistics Market 2020 - 2024 ($ billion)

5.2 End-user segment analysis 2020 - 2024

Historic Market Size - End-user Segment 2020 - 2024 ($ billion)

5.3 Type segment analysis 2020 - 2024

Historic Market Size - Type Segment 2020 - 2024 ($ billion)

5.4 Source segment analysis 2020 - 2024

Historic Market Size - Source Segment 2020 - 2024 ($ billion)

5.5 Geography segment analysis 2020 - 2024

Historic Market Size - Geography Segment 2020 - 2024 ($ billion)

5.6 Country segment analysis 2020 - 2024

Historic Market Size - Country Segment 2020 - 2024 ($ billion)

6. Qualitative Analysis

6.1 The AI Impact on Spare Parts Logistics Market

7. Five Forces Analysis

7.1 Five forces summary

Five forces analysis - Comparison between 2025 and 2030

7.2 Bargaining power of buyers

Bargaining power of buyers - Impact of key factors 2025 and 2030

7.3 Bargaining power of suppliers

Bargaining power of suppliers - Impact of key factors in 2025 and 2030

7.4 Threat of new entrants

Threat of new entrants - Impact of key factors in 2025 and 2030

7.5 Threat of substitutes

Threat of substitutes - Impact of key factors in 2025 and 2030

7.6 Threat of rivalry

Threat of rivalry - Impact of key factors in 2025 and 2030

7.7 Market condition

Chart on Market condition - Five forces 2025 and 2030

8. Market Segmentation by End-user

8.1 Market segments

Chart on End-user - Market share 2025-2030 (%)
Data Table on End-user - Market share 2025-2030 (%)

8.2 Comparison by End-user

Chart on Comparison by End-user
Data Table on Comparison by End-user

8.3 Automotive - Market size and forecast 2025-2030

Chart on Automotive - Market size and forecast 2025-2030 ($ billion)
Data Table on Automotive - Market size and forecast 2025-2030 ($ billion)
Chart on Automotive - Year-over-year growth 2025-2030 (%)
Data Table on Automotive - Year-over-year growth 2025-2030 (%)

8.4 Electronics - Market size and forecast 2025-2030

Chart on Electronics - Market size and forecast 2025-2030 ($ billion)
Data Table on Electronics - Market size and forecast 2025-2030 ($ billion)
Chart on Electronics - Year-over-year growth 2025-2030 (%)
Data Table on Electronics - Year-over-year growth 2025-2030 (%)

8.5 Industrial - Market size and forecast 2025-2030

Chart on Industrial - Market size and forecast 2025-2030 ($ billion)
Data Table on Industrial - Market size and forecast 2025-2030 ($ billion)
Chart on Industrial - Year-over-year growth 2025-2030 (%)
Data Table on Industrial - Year-over-year growth 2025-2030 (%)

8.6 Aerospace - Market size and forecast 2025-2030

Chart on Aerospace - Market size and forecast 2025-2030 ($ billion)
Data Table on Aerospace - Market size and forecast 2025-2030 ($ billion)
Chart on Aerospace - Year-over-year growth 2025-2030 (%)
Data Table on Aerospace - Year-over-year growth 2025-2030 (%)

8.7 Others - Market size and forecast 2025-2030

Chart on Others - Market size and forecast 2025-2030 ($ billion)
Data Table on Others - Market size and forecast 2025-2030 ($ billion)
Chart on Others - Year-over-year growth 2025-2030 (%)
Data Table on Others - Year-over-year growth 2025-2030 (%)

8.8 Market opportunity by End-user

Market opportunity by End-user ($ billion)
Data Table on Market opportunity by End-user ($ billion)

9. Market Segmentation by Type

9.1 Market segments

Chart on Type - Market share 2025-2030 (%)
Data Table on Type - Market share 2025-2030 (%)

9.2 Comparison by Type

Chart on Comparison by Type
Data Table on Comparison by Type

9.3 Forward - Market size and forecast 2025-2030

Chart on Forward - Market size and forecast 2025-2030 ($ billion)
Data Table on Forward - Market size and forecast 2025-2030 ($ billion)
Chart on Forward - Year-over-year growth 2025-2030 (%)
Data Table on Forward - Year-over-year growth 2025-2030 (%)

9.4 Reverse - Market size and forecast 2025-2030

Chart on Reverse - Market size and forecast 2025-2030 ($ billion)
Data Table on Reverse - Market size and forecast 2025-2030 ($ billion)
Chart on Reverse - Year-over-year growth 2025-2030 (%)
Data Table on Reverse - Year-over-year growth 2025-2030 (%)

9.5 Market opportunity by Type

Market opportunity by Type ($ billion)
Data Table on Market opportunity by Type ($ billion)

10. Market Segmentation by Source

10.1 Market segments

Chart on Source - Market share 2025-2030 (%)
Data Table on Source - Market share 2025-2030 (%)

10.2 Comparison by Source

Chart on Comparison by Source
Data Table on Comparison by Source

10.3 OEM channel - Market size and forecast 2025-2030

Chart on OEM channel - Market size and forecast 2025-2030 ($ billion)
Data Table on OEM channel - Market size and forecast 2025-2030 ($ billion)
Chart on OEM channel - Year-over-year growth 2025-2030 (%)
Data Table on OEM channel - Year-over-year growth 2025-2030 (%)

10.4 Independent aftermarket - Market size and forecast 2025-2030

Chart on Independent aftermarket - Market size and forecast 2025-2030 ($ billion)
Data Table on Independent aftermarket - Market size and forecast 2025-2030 ($ billion)
Chart on Independent aftermarket - Year-over-year growth 2025-2030 (%)
Data Table on Independent aftermarket - Year-over-year growth 2025-2030 (%)

10.5 Market opportunity by Source

Market opportunity by Source ($ billion)
Data Table on Market opportunity by Source ($ billion)

11. Customer Landscape

11.1 Customer landscape overview

Analysis of price sensitivity, lifecycle, customer purchase basket, adoption rates, and purchase criteria

12. Geographic Landscape

12.1 Geographic segmentation

Chart on Market share by geography 2025-2030 (%)
Data Table on Market share by geography 2025-2030 (%)

12.2 Geographic comparison

Chart on Geographic comparison
Data Table on Geographic comparison

12.3 APAC - Market size and forecast 2025-2030

Chart on APAC - Market size and forecast 2025-2030 ($ billion)
Data Table on APAC - Market size and forecast 2025-2030 ($ billion)
Chart on APAC - Year-over-year growth 2025-2030 (%)
Data Table on APAC - Year-over-year growth 2025-2030 (%)
Chart on Regional Comparison - APAC
Data Table on Regional Comparison - APAC

12.3.1 China - Market size and forecast 2025-2030

Chart on China - Market size and forecast 2025-2030 ($ billion)
Data Table on China - Market size and forecast 2025-2030 ($ billion)
Chart on China - Year-over-year growth 2025-2030 (%)
Data Table on China - Year-over-year growth 2025-2030 (%)

12.3.2 Japan - Market size and forecast 2025-2030

Chart on Japan - Market size and forecast 2025-2030 ($ billion)
Data Table on Japan - Market size and forecast 2025-2030 ($ billion)
Chart on Japan - Year-over-year growth 2025-2030 (%)
Data Table on Japan - Year-over-year growth 2025-2030 (%)

12.3.3 India - Market size and forecast 2025-2030

Chart on India - Market size and forecast 2025-2030 ($ billion)
Data Table on India - Market size and forecast 2025-2030 ($ billion)
Chart on India - Year-over-year growth 2025-2030 (%)
Data Table on India - Year-over-year growth 2025-2030 (%)

12.3.4 South Korea - Market size and forecast 2025-2030

Chart on South Korea - Market size and forecast 2025-2030 ($ billion)
Data Table on South Korea - Market size and forecast 2025-2030 ($ billion)
Chart on South Korea - Year-over-year growth 2025-2030 (%)
Data Table on South Korea - Year-over-year growth 2025-2030 (%)

12.3.5 Australia - Market size and forecast 2025-2030

Chart on Australia - Market size and forecast 2025-2030 ($ billion)
Data Table on Australia - Market size and forecast 2025-2030 ($ billion)
Chart on Australia - Year-over-year growth 2025-2030 (%)
Data Table on Australia - Year-over-year growth 2025-2030 (%)

12.3.6 Indonesia - Market size and forecast 2025-2030

Chart on Indonesia - Market size and forecast 2025-2030 ($ billion)
Data Table on Indonesia - Market size and forecast 2025-2030 ($ billion)
Chart on Indonesia - Year-over-year growth 2025-2030 (%)
Data Table on Indonesia - Year-over-year growth 2025-2030 (%)

12.4 Europe - Market size and forecast 2025-2030

Chart on Europe - Market size and forecast 2025-2030 ($ billion)
Data Table on Europe - Market size and forecast 2025-2030 ($ billion)
Chart on Europe - Year-over-year growth 2025-2030 (%)
Data Table on Europe - Year-over-year growth 2025-2030 (%)
Chart on Regional Comparison - Europe
Data Table on Regional Comparison - Europe

12.4.1 Germany - Market size and forecast 2025-2030

Chart on Germany - Market size and forecast 2025-2030 ($ billion)
Data Table on Germany - Market size and forecast 2025-2030 ($ billion)
Chart on Germany - Year-over-year growth 2025-2030 (%)
Data Table on Germany - Year-over-year growth 2025-2030 (%)

12.4.2 UK - Market size and forecast 2025-2030

Chart on UK - Market size and forecast 2025-2030 ($ billion)
Data Table on UK - Market size and forecast 2025-2030 ($ billion)
Chart on UK - Year-over-year growth 2025-2030 (%)
Data Table on UK - Year-over-year growth 2025-2030 (%)

12.4.3 France - Market size and forecast 2025-2030

Chart on France - Market size and forecast 2025-2030 ($ billion)
Data Table on France - Market size and forecast 2025-2030 ($ billion)
Chart on France - Year-over-year growth 2025-2030 (%)
Data Table on France - Year-over-year growth 2025-2030 (%)

12.4.4 Italy - Market size and forecast 2025-2030

Chart on Italy - Market size and forecast 2025-2030 ($ billion)
Data Table on Italy - Market size and forecast 2025-2030 ($ billion)
Chart on Italy - Year-over-year growth 2025-2030 (%)
Data Table on Italy - Year-over-year growth 2025-2030 (%)

12.4.5 Spain - Market size and forecast 2025-2030

Chart on Spain - Market size and forecast 2025-2030 ($ billion)
Data Table on Spain - Market size and forecast 2025-2030 ($ billion)
Chart on Spain - Year-over-year growth 2025-2030 (%)
Data Table on Spain - Year-over-year growth 2025-2030 (%)

12.4.6 The Netherlands - Market size and forecast 2025-2030

Chart on The Netherlands - Market size and forecast 2025-2030 ($ billion)
Data Table on The Netherlands - Market size and forecast 2025-2030 ($ billion)
Chart on The Netherlands - Year-over-year growth 2025-2030 (%)
Data Table on The Netherlands - Year-over-year growth 2025-2030 (%)

12.5 North America - Market size and forecast 2025-2030

Chart on North America - Market size and forecast 2025-2030 ($ billion)
Data Table on North America - Market size and forecast 2025-2030 ($ billion)
Chart on North America - Year-over-year growth 2025-2030 (%)
Data Table on North America - Year-over-year growth 2025-2030 (%)
Chart on Regional Comparison - North America
Data Table on Regional Comparison - North America

12.5.1 US - Market size and forecast 2025-2030

Chart on US - Market size and forecast 2025-2030 ($ billion)
Data Table on US - Market size and forecast 2025-2030 ($ billion)
Chart on US - Year-over-year growth 2025-2030 (%)
Data Table on US - Year-over-year growth 2025-2030 (%)

12.5.2 Canada - Market size and forecast 2025-2030

Chart on Canada - Market size and forecast 2025-2030 ($ billion)
Data Table on Canada - Market size and forecast 2025-2030 ($ billion)
Chart on Canada - Year-over-year growth 2025-2030 (%)
Data Table on Canada - Year-over-year growth 2025-2030 (%)

12.5.3 Mexico - Market size and forecast 2025-2030

Chart on Mexico - Market size and forecast 2025-2030 ($ billion)
Data Table on Mexico - Market size and forecast 2025-2030 ($ billion)
Chart on Mexico - Year-over-year growth 2025-2030 (%)
Data Table on Mexico - Year-over-year growth 2025-2030 (%)

12.6 South America - Market size and forecast 2025-2030

Chart on South America - Market size and forecast 2025-2030 ($ billion)
Data Table on South America - Market size and forecast 2025-2030 ($ billion)
Chart on South America - Year-over-year growth 2025-2030 (%)
Data Table on South America - Year-over-year growth 2025-2030 (%)
Chart on Regional Comparison - South America
Data Table on Regional Comparison - South America

12.6.1 Brazil - Market size and forecast 2025-2030

Chart on Brazil - Market size and forecast 2025-2030 ($ billion)
Data Table on Brazil - Market size and forecast 2025-2030 ($ billion)
Chart on Brazil - Year-over-year growth 2025-2030 (%)
Data Table on Brazil - Year-over-year growth 2025-2030 (%)

12.6.2 Chile - Market size and forecast 2025-2030

Chart on Chile - Market size and forecast 2025-2030 ($ billion)
Data Table on Chile - Market size and forecast 2025-2030 ($ billion)
Chart on Chile - Year-over-year growth 2025-2030 (%)
Data Table on Chile - Year-over-year growth 2025-2030 (%)

12.6.3 Argentina - Market size and forecast 2025-2030

Chart on Argentina - Market size and forecast 2025-2030 ($ billion)
Data Table on Argentina - Market size and forecast 2025-2030 ($ billion)
Chart on Argentina - Year-over-year growth 2025-2030 (%)
Data Table on Argentina - Year-over-year growth 2025-2030 (%)

12.7 Middle East and Africa - Market size and forecast 2025-2030

Chart on Middle East and Africa - Market size and forecast 2025-2030 ($ billion)
Data Table on Middle East and Africa - Market size and forecast 2025-2030 ($ billion)
Chart on Middle East and Africa - Year-over-year growth 2025-2030 (%)
Data Table on Middle East and Africa - Year-over-year growth 2025-2030 (%)
Chart on Regional Comparison - Middle East and Africa
Data Table on Regional Comparison - Middle East and Africa

12.7.1 Saudi Arabia - Market size and forecast 2025-2030

Chart on Saudi Arabia - Market size and forecast 2025-2030 ($ billion)
Data Table on Saudi Arabia - Market size and forecast 2025-2030 ($ billion)
Chart on Saudi Arabia - Year-over-year growth 2025-2030 (%)
Data Table on Saudi Arabia - Year-over-year growth 2025-2030 (%)

12.7.2 UAE - Market size and forecast 2025-2030

Chart on UAE - Market size and forecast 2025-2030 ($ billion)
Data Table on UAE - Market size and forecast 2025-2030 ($ billion)
Chart on UAE - Year-over-year growth 2025-2030 (%)
Data Table on UAE - Year-over-year growth 2025-2030 (%)

12.7.3 South Africa - Market size and forecast 2025-2030

Chart on South Africa - Market size and forecast 2025-2030 ($ billion)
Data Table on South Africa - Market size and forecast 2025-2030 ($ billion)
Chart on South Africa - Year-over-year growth 2025-2030 (%)
Data Table on South Africa - Year-over-year growth 2025-2030 (%)

12.7.4 Israel - Market size and forecast 2025-2030

Chart on Israel - Market size and forecast 2025-2030 ($ billion)
Data Table on Israel - Market size and forecast 2025-2030 ($ billion)
Chart on Israel - Year-over-year growth 2025-2030 (%)
Data Table on Israel - Year-over-year growth 2025-2030 (%)

12.7.5 Turkey - Market size and forecast 2025-2030

Chart on Turkey - Market size and forecast 2025-2030 ($ billion)
Data Table on Turkey - Market size and forecast 2025-2030 ($ billion)
Chart on Turkey - Year-over-year growth 2025-2030 (%)
Data Table on Turkey - Year-over-year growth 2025-2030 (%)

12.8 Market opportunity by geography

Market opportunity by geography ($ billion)
Data Tables on Market opportunity by geography ($ billion)

13. Drivers, Challenges, and Opportunity

13.1 Market drivers

Increase in electronic components trade between India and China
Increasing average vehicle age
Increasing hardware spending in APAC

13.2 Market challenges

Adoption of 3D printing in manufacturing industry
Complexities involved in time-bound deliveries and customized supply chains
Shortage of skilled drivers in logistics industry

13.3 Impact of drivers and challenges

Impact of drivers and challenges in 2025 and 2030

13.4 Market opportunities

Adoption of real time tracking with IoT sensors
Penetration of blockchain in logistics industry
Increase in mergers and acquisitions activities

14. Competitive Landscape

14.1 Overview

14.2

Overview on criticality of inputs and factors of differentiation

14.3 Landscape disruption

Overview on factors of disruption

14.4 Industry risks

Impact of key risks on business

15. Competitive Analysis

15.1 Companies profiled

Companies covered

15.2 Company ranking index

15.3 Market positioning of companies

Matrix on companies position and classification

15.4 CEVA Logistics SA

CEVA Logistics SA - Overview
CEVA Logistics SA - Product / Service
CEVA Logistics SA - Key news
CEVA Logistics SA - Key offerings
SWOT

15.5 DB Cargo AG

DB Cargo AG - Overview
DB Cargo AG - Product / Service
DB Cargo AG - Key offerings
SWOT

15.6 DHL International GmbH

DHL International GmbH - Overview
DHL International GmbH - Business segments
DHL International GmbH - Key news
DHL International GmbH - Key offerings
DHL International GmbH - Segment focus
SWOT

15.7 DSV AS

DSV AS - Overview
DSV AS - Business segments
DSV AS - Key offerings
DSV AS - Segment focus
SWOT

15.8 Expeditors International Inc.

Expeditors International Inc. - Overview
Expeditors International Inc. - Business segments
Expeditors International Inc. - Key offerings
Expeditors International Inc. - Segment focus
SWOT

15.9 FedEx Corp.

FedEx Corp. - Overview
FedEx Corp. - Business segments
FedEx Corp. - Key news
FedEx Corp. - Key offerings
FedEx Corp. - Segment focus
SWOT

15.10 GEODIS

GEODIS - Overview
GEODIS - Product / Service
GEODIS - Key offerings
SWOT

15.11 Kuehne Nagel Management AG

Kuehne Nagel Management AG - Overview
Kuehne Nagel Management AG - Business segments
Kuehne Nagel Management AG - Key news
Kuehne Nagel Management AG - Key offerings
Kuehne Nagel Management AG - Segment focus
SWOT

15.12 Nippon Express Holdings Inc.

Nippon Express Holdings Inc. - Overview
Nippon Express Holdings Inc. - Business segments
Nippon Express Holdings Inc. - Key news
Nippon Express Holdings Inc. - Key offerings
Nippon Express Holdings Inc. - Segment focus
SWOT

15.13 Scan Global Logistics

Scan Global Logistics - Overview
Scan Global Logistics - Product / Service
Scan Global Logistics - Key offerings
SWOT

15.14 SEKO Logistics

SEKO Logistics - Overview
SEKO Logistics - Product / Service
SEKO Logistics - Key offerings
SWOT

15.15 Toyota Motor Corp.

Toyota Motor Corp. - Overview
Toyota Motor Corp. - Business segments
Toyota Motor Corp. - Key news
Toyota Motor Corp. - Key offerings
Toyota Motor Corp. - Segment focus
SWOT

15.16 TVS Supply Chain Solutions

TVS Supply Chain Solutions - Overview
TVS Supply Chain Solutions - Business segments
TVS Supply Chain Solutions - Key offerings
TVS Supply Chain Solutions - Segment focus
SWOT

15.17 United Parcel Service Inc.

United Parcel Service Inc. - Overview
United Parcel Service Inc. - Business segments
United Parcel Service Inc. - Key news
United Parcel Service Inc. - Key offerings
United Parcel Service Inc. - Segment focus
SWOT

15.18 XPO Inc.

XPO Inc. - Overview
XPO Inc. - Business segments
XPO Inc. - Key news
XPO Inc. - Key offerings
XPO Inc. - Segment focus
SWOT

16. Appendix

16.1 Scope of the report

Market definition
Objectives
Notes and caveats

16.2 Inclusions and exclusions checklist

Inclusions checklist
Exclusions checklist

16.3 Currency conversion rates for US$

16.4 Research methodology

16.5 Data procurement

Information sources

16.6 Data validation

16.7 Validation techniques employed for market sizing

16.8 Data synthesis

16.9 360 degree market analysis

16.10 List of abbreviations

Research Methodology

Technavio presents a detailed picture of the market by way of study, synthesis, and summation of data from multiple sources. The analysts have presented the various facets of the market with a particular focus on identifying the key industry influencers. The data thus presented is comprehensive, reliable, and the result of extensive research, both primary and secondary.

INFORMATION SOURCES

Primary sources

  • Manufacturers and suppliers
  • Channel partners
  • Industry experts
  • Strategic decision makers

Secondary sources

  • Industry journals and periodicals
  • Government data
  • Financial reports of key industry players
  • Historical data
  • Press releases

DATA ANALYSIS

Data Synthesis

  • Collation of data
  • Estimation of key figures
  • Analysis of derived insights

Data Validation

  • Triangulation with data models
  • Reference against proprietary databases
  • Corroboration with industry experts

REPORT WRITING

Qualitative

  • Market drivers
  • Market challenges
  • Market trends
  • Five forces analysis

Quantitative

  • Market size and forecast
  • Market segmentation
  • Geographical insights
  • Competitive landscape

Interested in this report?

Get your sample now to see our research methodology and insights!

Download Now

Frequently Asked Questions

Spare Parts Logistics market growth will increase by USD 28.4 billion during 2026-2030.

The Spare Parts Logistics market is expected to grow at a CAGR of 5.9% during 2026-2030.

Spare Parts Logistics market is segmented by End-user (Automotive, Electronics, Industrial, Aerospace, Others) Type (Forward, Reverse) Source (OEM channel, Independent aftermarket)

CEVA Logistics SA, Dachser SE, DB Cargo AG, DHL International GmbH, DSV AS, Expeditors International Inc., FedEx Corp., GEODIS, KLN Logistics Group Ltd., Kuehne Nagel Management AG, Lufthansa Cargo AG, Nippon Express Holdings Inc., Ryder System Inc., Scan Global Logistics, SEKO Logistics, Toyota Motor Corp., TVS Supply Chain Solutions, United Parcel Service Inc., XPO Inc. are a few of the key vendors in the Spare Parts Logistics market.

APAC will register the highest growth rate of 41.5% among the other regions. Therefore, the Spare Parts Logistics market in APAC is expected to garner significant business opportunities for the vendors during the forecast period.

China, Japan, India, South Korea, Australia, Indonesia, Germany, UK, France, Italy, Spain, The Netherlands, US, Canada, Mexico, Brazil, Chile, Argentina, Saudi Arabia, UAE, South Africa, Israel, Turkey

  • Increase in electronic components trade between India and China is the driving factor this market.

The Spare Parts Logistics market vendors should focus on grabbing business opportunities from the End-user segment as it accounted for the largest market share in the base year.
RIA - Research AI Assistant
Ask RIA