Automotive Aftermarket Market Size 2026-2030
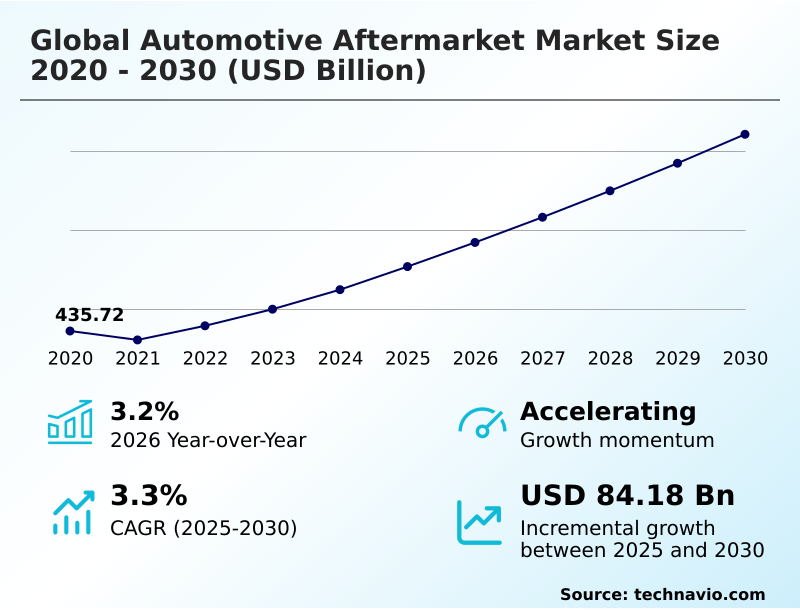
The automotive aftermarket market size is valued to increase by USD 84.18 billion, at a CAGR of 3.3% from 2025 to 2030. Expansion of vehicle aging and proliferation of high-mileage maintenance cycles will drive the automotive aftermarket market.
Major Market Trends & Insights
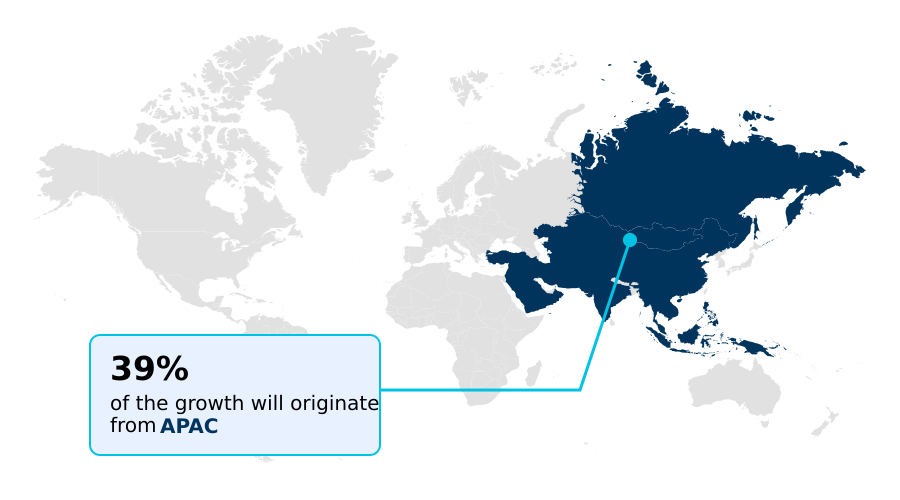
- APAC dominated the market and accounted for a 38.9% growth during the forecast period.
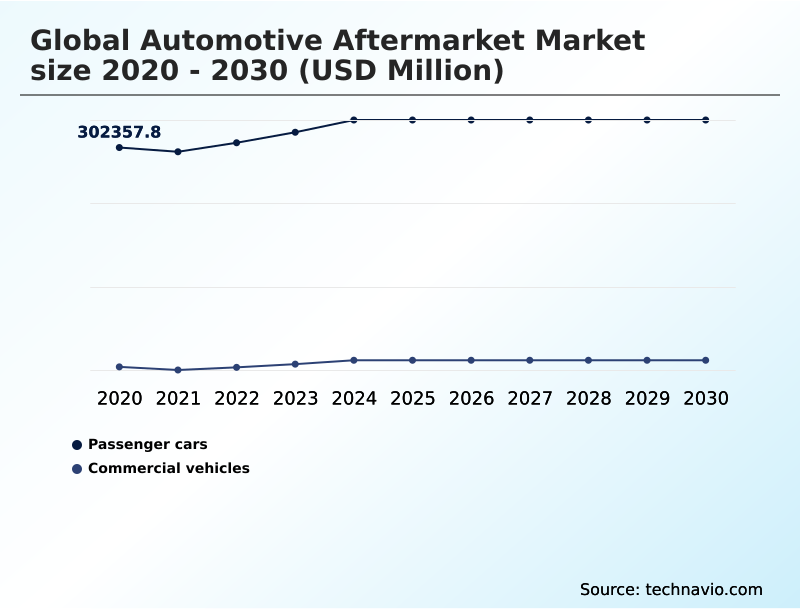
- By Vehicle Type - Passenger cars segment was valued at USD 323.57 billion in 2024
- By Distribution Channel - Retailer segment accounted for the largest market revenue share in 2024
Market Size & Forecast
- Market Opportunities: USD 125.18 billion
- Market Future Opportunities: USD 84.18 billion
- CAGR from 2025 to 2030 : 3.3%
Market Summary
- The automotive aftermarket market is navigating a period of significant transformation, driven by the dual forces of a consistently aging vehicle fleet and rapid technological advancement. The increasing average age of vehicles sustains demand for traditional wear-and-tear components, while the proliferation of e-commerce platforms has democratized parts access for both professionals and consumers.
- However, the growing complexity of modern vehicles presents both opportunities and challenges. The integration of advanced driver assistance systems necessitates specialized adas calibration services, creating a high-value service segment. Conversely, the rise of software-defined architectures controlled by OEMs creates access barriers for independent shops, fueling the right-to-repair debate.
- A parts distribution firm, for instance, must now manage a dual inventory catering to both legacy mechanical parts and sophisticated electronic modules, all while contending with a persistent talent deficit of technicians qualified to service these evolving systems. This dynamic requires market participants to invest heavily in training and advanced diagnostic tools to remain competitive.
What will be the Size of the Automotive Aftermarket Market during the forecast period?
Get Key Insights on Market Forecast (PDF) Get Free Sample
How is the Automotive Aftermarket Market Segmented?
The automotive aftermarket industry research report provides comprehensive data (region-wise segment analysis), with forecasts and estimates in "USD million" for the period 2026-2030, as well as historical data from 2020-2024 for the following segments.
- Vehicle type
- Passenger cars
- Commercial vehicles
- Distribution channel
- Retailer
- Wholesale and distribution
- Product
- Tires
- Batteries
- Brake parts and pads
- Filters
- Others
- Geography
- APAC
- China
- India
- Japan
- North America
- US
- Canada
- Mexico
- Europe
- Germany
- UK
- France
- Middle East and Africa
- UAE
- Saudi Arabia
- South Africa
- South America
- Brazil
- Argentina
- Colombia
- Rest of World (ROW)
- APAC
By Vehicle Type Insights
The passenger cars segment is estimated to witness significant growth during the forecast period.
The passenger cars segment is sustained by the aging vehicle fleet, where increased vehicle longevity drives consistent demand for maintenance. As vehicles remain in service longer, the need for replacing wear-and-tear components, including brake parts and filtration systems, intensifies.
A significant shift is occurring toward high-value services related to advanced driver assistance systems (ADAS), which require specialized ADAS calibration services after routine repairs. The integration of connected vehicle technology is further enhancing the customer experience, enabling proactive service alerts.
Retailers are adopting omnichannel strategies to improve price transparency and accessibility.
This allows owners to upgrade their vehicles with modern aftermarket accessories, supporting a growing trend in vehicle customization and technological enhancement, with B2B digital interfaces improving inventory tracking by 15%.
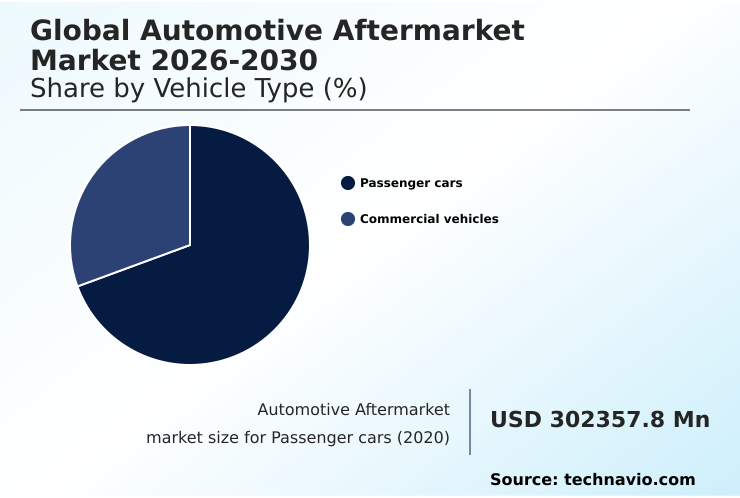
The Passenger cars segment was valued at USD 323.57 billion in 2024 and showed a gradual increase during the forecast period.
Regional Analysis
APAC is estimated to contribute 38.9% to the growth of the global market during the forecast period.Technavio’s analysts have elaborately explained the regional trends and drivers that shape the market during the forecast period.
See How Automotive Aftermarket Market Demand is Rising in APAC Get Free Sample
The geographic landscape is led by APAC, which accounts for nearly 39% of the market's incremental growth, driven by significant vehicle parc expansion.
This region is seeing major capital investments exceeding nine figures to localize the production of components like exhaust components and thermal management systems. In mature markets like North America and Europe, the focus is on advanced services.
Specialized repair networks are leveraging vehicle telematics data and AI-driven diagnostics to offer sophisticated collision repair solutions and manage total cost of ownership. Fleet management software is becoming integral for optimizing maintenance of ride control products.
Meanwhile, demand from do-it-yourself (DIY) consumers for infotainment systems and unified communications is growing through digital channels that offer greater price transparency.
Market Dynamics
Our researchers analyzed the data with 2025 as the base year, along with the key drivers, trends, and challenges. A holistic analysis of drivers will help companies refine their marketing strategies to gain a competitive advantage.
- A comprehensive analysis of automotive aftermarket trends for passenger cars reveals a market deeply influenced by the aging vehicle fleet impact on repairs and a structural shift toward electrification. The impact of EVs on aftermarket services is profound, creating demand for technician training for high-voltage systems and aftermarket solutions for thermal management in EVs.
- The commercial vehicle aftermarket parts distribution model is simultaneously evolving, driven by the role of e-commerce in parts procurement, which is a key pillar of automotive aftermarket digital transformation strategies. This shift presents both opportunities and challenges.
- For instance, ADAS calibration requirements for independent shops are becoming more stringent, while the right to repair legislation impact on aftermarket access remains a critical issue. The benefits of 3d printing for spare parts are increasingly recognized as a solution to supply chain challenges in automotive aftermarket, especially for sourcing electronic control units.
- This technology supports the demand for remanufactured powertrain components and enables the growth of private label parts brands. The wholesale and distribution channel evolution is characterized by the use of predictive maintenance using vehicle telematics.
- This focus on data is central to aftermarket opportunities in connected cars and allows for a clearer OEM vs aftermarket parts quality comparison, which ultimately shapes the automotive aftermarket market segmentation by product and its future direction.
- This data-driven approach is critical for operational planning, as predictive systems have shown the ability to reduce unscheduled vehicle downtime by over 10% compared to traditional reactive maintenance schedules.
What are the key market drivers leading to the rise in the adoption of Automotive Aftermarket Industry?
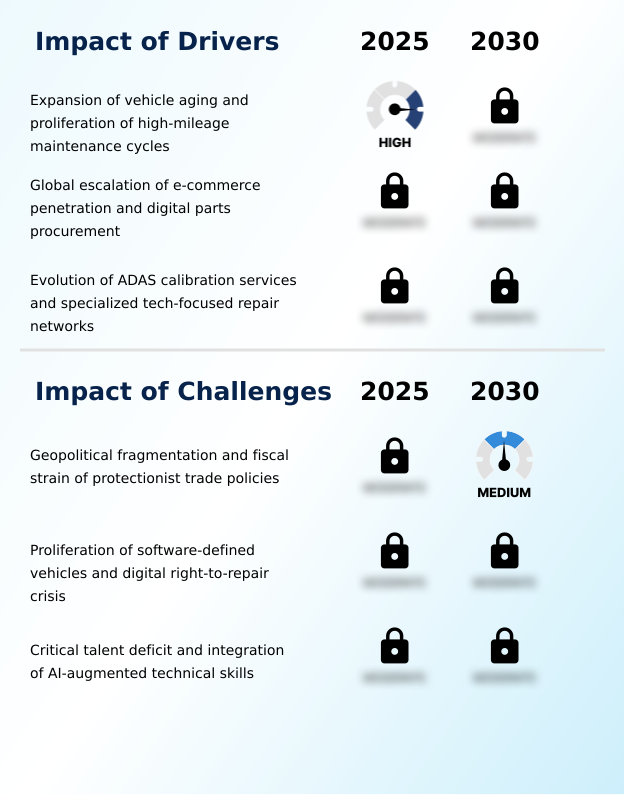
- The expansion of vehicle aging, coupled with the proliferation of high-mileage maintenance cycles, serves as a key driver for the market.
- The market's expansion is significantly driven by the increasing average vehicle age, which now exceeds 12 years in several key regions.
- This trend fuels steady demand for the replacement of powertrain systems, chassis components, and suspension parts within the independent aftermarket (IAM). Simultaneously, the rapid growth of digital sales channels and e-commerce platforms is revolutionizing digital parts procurement.
- These platforms offer an expanded product assortment and facilitate direct-to-consumer (DTC) and online-to-offline (O2O) models, benefiting independent repair shops.
- This digital shift, with online retail channels growing over 15% annually, provides enhanced mobility solutions and access to advanced diagnostic tools, reshaping how the industry operates.
What are the market trends shaping the Automotive Aftermarket Industry?
- A structural shift toward electrification is creating a prominent market trend. This is giving rise to a new segment focused on specialized aftermarket components for electric vehicles.
- The market is undergoing a structural shift with the rise of electric vehicle (EV) components, creating demand for new service delivery models focused on high-voltage battery services and e-axle units. This transition requires investment in specialized tooling. Concurrently, additive manufacturing is revolutionizing supply chain logistics, with 3D printing technology enabling the creation of on-demand spare parts.
- This practice, reducing lead times for certain components by up to 40%, supports circular economy practices and solves challenges in last-mile delivery. Digital marketplaces are facilitating this trend by connecting workshops with suppliers for niche components, enhancing preventative maintenance strategies and overall market responsiveness.
What challenges does the Automotive Aftermarket Industry face during its growth?
- Geopolitical fragmentation and the fiscal strain resulting from protectionist trade policies present a key challenge affecting industry growth.
- Key challenges stem from geopolitical fragmentation and protectionist trade policies, which disrupt the global supply of essential drivetrain components and brake parts and pads. This complicates inventory management for businesses reliant on international sourcing. Concurrently, the rise of software-defined architectures and over-the-air (OTA) updates introduces new complexities.
- These software-enabled solutions create hurdles for the independent sector, intensifying the digital right-to-repair debate and requiring robust automotive cybersecurity protocols. The industry also faces a critical talent deficit, with a technical skills gap that hinders the servicing of advanced systems, including complex emission control products.
- This shortfall, exceeding 25% of the needed workforce in some areas, impacts the adoption of both new and remanufactured parts.
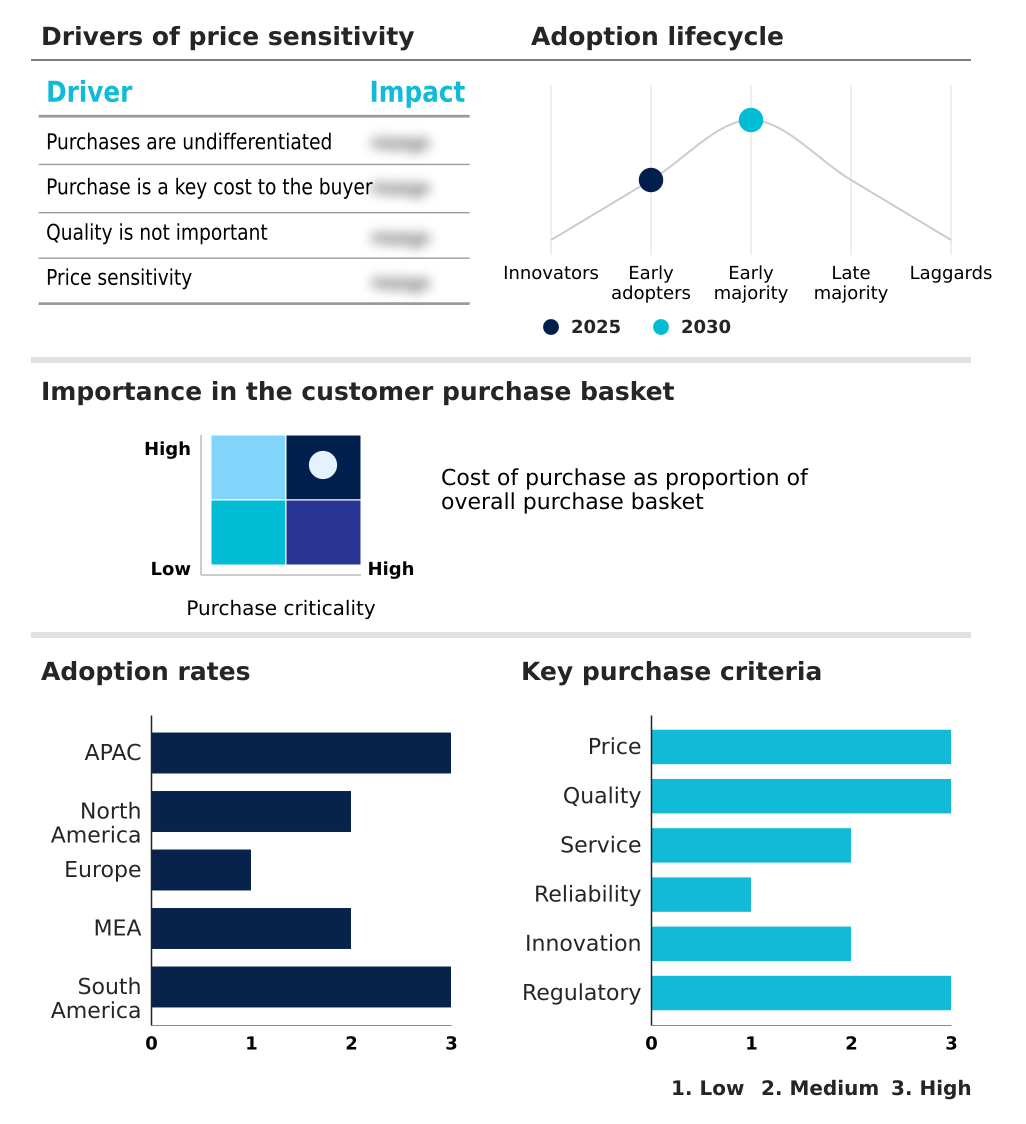
Exclusive Technavio Analysis on Customer Landscape
The automotive aftermarket market forecasting report includes the adoption lifecycle of the market, covering from the innovator’s stage to the laggard’s stage. It focuses on adoption rates in different regions based on penetration. Furthermore, the automotive aftermarket market report also includes key purchase criteria and drivers of price sensitivity to help companies evaluate and develop their market growth analysis strategies.
Customer Landscape of Automotive Aftermarket Industry
Competitive Landscape
Companies are implementing various strategies, such as strategic alliances, automotive aftermarket market forecast, partnerships, mergers and acquisitions, geographical expansion, and product/service launches, to enhance their presence in the industry.
3M Co. - Specializes in advanced materials including abrasives, adhesives, and films, providing repair solutions for collision and vehicle maintenance.
The industry research and growth report includes detailed analyses of the competitive landscape of the market and information about key companies, including:
- 3M Co.
- AISIN Corp.
- BASF SE
- BorgWarner Inc.
- Bridgestone Corp.
- Continental AG
- DENSO Corp.
- HELLA GmbH and Co. KGaA
- Hitachi Ltd.
- LC Industries Inc.
- Lear Corp.
- Magna International Inc.
- MAHLE GmbH
- Pioneer Corp.
- Robert Bosch GmbH
- Samsung Electronics Co. Ltd.
- Schaeffler AG
- TE Connectivity plc
- Tenneco Inc.
- Valeo SA
Qualitative and quantitative analysis of companies has been conducted to help clients understand the wider business environment as well as the strengths and weaknesses of key industry players. Data is qualitatively analyzed to categorize companies as pure play, category-focused, industry-focused, and diversified; it is quantitatively analyzed to categorize companies as dominant, leading, strong, tentative, and weak.
Recent Development and News in Automotive aftermarket market
- In May 2025, Transport Canada reported a rise in motor vehicle fatalities, prompting renewed regulatory focus on the quality and certification of aftermarket safety components.
- In April 2025, prominent US distributors reported a record 15% increase in the utilization of B2B digital interfaces for real-time inventory tracking, highlighting the industry's shift toward integrated digital supply chains.
- In March 2025, AISIN Corporation commenced production of eAxle units in India as part of its manufacturing expansion to meet the growing demand for EV components.
- In January 2025, General Motors and Ford initiated a significant expansion in the use of 3D-printed parts for end-use functional components in production vehicles, signaling a shift from prototyping to large-scale additive manufacturing.
Dive into Technavio’s robust research methodology, blending expert interviews, extensive data synthesis, and validated models for unparalleled Automotive Aftermarket Market insights. See full methodology.
| Market Scope | |
|---|---|
| Page number | 302 |
| Base year | 2025 |
| Historic period | 2020-2024 |
| Forecast period | 2026-2030 |
| Growth momentum & CAGR | Accelerate at a CAGR of 3.3% |
| Market growth 2026-2030 | USD 84177.1 million |
| Market structure | Fragmented |
| YoY growth 2025-2026(%) | 3.2% |
| Key countries | China, India, Japan, South Korea, Indonesia, Australia, US, Canada, Mexico, Germany, UK, France, Italy, Spain, The Netherlands, UAE, Saudi Arabia, South Africa, Egypt, Turkey, Brazil, Argentina and Colombia |
| Competitive landscape | Leading Companies, Market Positioning of Companies, Competitive Strategies, and Industry Risks |
Research Analyst Overview
- The automotive aftermarket is a complex ecosystem defined by the need to service both legacy and emerging technologies. The proliferation of software-defined architectures and connected vehicle technology necessitates advanced diagnostic tools and robust automotive cybersecurity protocols to manage over-the-air (OTA) updates and access vehicle telematics data.
- This technological shift, a key boardroom consideration, directly impacts budgeting for technician training, as the demand for specialized tooling for high-voltage battery services grows. For instance, the integration of additive manufacturing and 3D printing technology for on-demand spare parts has reduced lead times for certain components by over 50%.
- The market supports a vast range of products, from powertrain systems, drivetrain components, and chassis components to wear-and-tear components like brake parts and pads, filtration systems, and suspension parts. The independent aftermarket (IAM) plays a crucial role in providing collision repair solutions and mobility solutions, including ride control products and emission control products.
- As vehicles integrate advanced driver assistance systems (ADAS), the need for precise ADAS calibration services is paramount.
- This creates opportunities beyond traditional infotainment systems and aftermarket accessories, extending to specialized EV components like e-axle units and thermal management systems, challenging the dominance of original equipment manufacturer (OEM) parts with remanufactured parts and unified communications platforms, while also intensifying the digital right-to-repair debate.
What are the Key Data Covered in this Automotive Aftermarket Market Research and Growth Report?
-
What is the expected growth of the Automotive Aftermarket Market between 2026 and 2030?
-
USD 84.18 billion, at a CAGR of 3.3%
-
-
What segmentation does the market report cover?
-
The report is segmented by Vehicle Type (Passenger cars, and Commercial vehicles), Distribution Channel (Retailer, and Wholesale and distribution), Product (Tires, Batteries, Brake parts and pads, Filters, and Others) and Geography (APAC, North America, Europe, Middle East and Africa, South America)
-
-
Which regions are analyzed in the report?
-
APAC, North America, Europe, Middle East and Africa and South America
-
-
What are the key growth drivers and market challenges?
-
Expansion of vehicle aging and proliferation of high-mileage maintenance cycles, Geopolitical fragmentation and fiscal strain of protectionist trade policies
-
-
Who are the major players in the Automotive Aftermarket Market?
-
3M Co., AISIN Corp., BASF SE, BorgWarner Inc., Bridgestone Corp., Continental AG, DENSO Corp., HELLA GmbH and Co. KGaA, Hitachi Ltd., LC Industries Inc., Lear Corp., Magna International Inc., MAHLE GmbH, Pioneer Corp., Robert Bosch GmbH, Samsung Electronics Co. Ltd., Schaeffler AG, TE Connectivity plc, Tenneco Inc. and Valeo SA
-
Market Research Insights
- The market is shaped by dynamic consumer and operational shifts. The expansion of digital sales channels is transforming procurement, with e-retailing demonstrating growth rates exceeding 15% annually as both DIY consumers and independent repair shops embrace e-commerce platforms. This move toward direct-to-consumer (DTC) models enhances price transparency and expands product assortment.
- Concurrently, the industry faces a significant talent deficit, with the technician shortfall exceeding 25% of the required workforce in some regions, creating a bottleneck for specialized repair networks. As a result, firms are investing in AI-driven diagnostics and advanced inventory management to improve service delivery models and mitigate the impact of the technical skills gap on operational uptime.
We can help! Our analysts can customize this automotive aftermarket market research report to meet your requirements.
 RIA -
RIA - 
