Additive Manufacturing Market Analysis, Size, and Forecast 2025-2029: North America (US and Canada), Europe (France, Germany, Spain, UK), APAC (China, India, Japan), South America (Brazil), and Middle East and Africa

Additive Manufacturing Market Analysis, Size, and Forecast 2025-2029:
North America (US and Canada), Europe (France, Germany, Spain, UK), APAC (China, India, Japan), South America (Brazil), and Middle East and Africa

Published: Mar 2025 242 Pages SKU: IRTNTR77469

Market Overview at a Glance

$46.76 B
Market Opportunity
23.9%
CAGR
21.4
YoY growth 2024-2025(%)

Additive Manufacturing Market Size 2025-2029

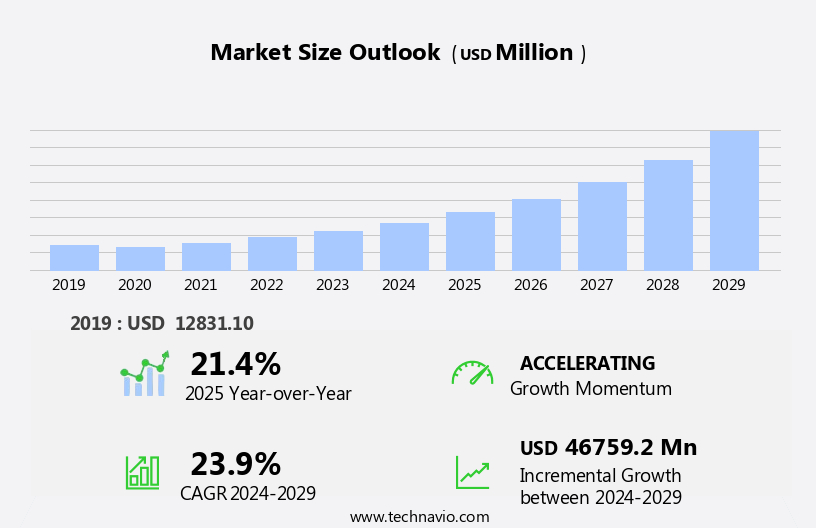
The additive manufacturing market size is forecast to increase by USD 46.76 billion at a CAGR of 23.9% between 2024 and 2029.

  • The market is experiencing significant growth, driven primarily by the high demand in the medical device sector for customized and complex components. This trend is further fueled by increasing consumer interest in personalized, 3D-printed products across various industries. However, the market growth is not without challenges. The high initial cost of setting up additive manufacturing facilities remains a significant barrier for entry, limiting the number of players and potentially hindering market penetration. Moreover, the technology's limited material options and the need for specialized expertise pose additional challenges.
  • To capitalize on the market opportunities and navigate these challenges effectively, companies must focus on collaborations, strategic partnerships, and continuous innovation to reduce costs, expand material offerings, and improve production efficiency. By staying abreast of the latest industry developments and trends, businesses can position themselves to succeed in this dynamic and evolving market.

What will be the Size of the Additive Manufacturing Market during the forecast period?

Additive Manufacturing Market Size

 Request Free Sample

  • The market continues to experience significant growth and innovation, driven by the increasing adoption of industrial 3d printing technologies in various industries. The market's size is projected to expand at a robust rate, with the automotive and industrial segments leading the charge. Technologies such as fuse deposition modeling, stereolithography, and selective laser sintering are gaining popularity due to their ability to produce complex geometries and reduce production expenses. The market is also witnessing increased regulatory scrutiny, leading to the development of certification standards and quality assurance protocols. The integration of advanced scanning software and design software capabilities is enabling more precise and efficient manufacturing processes.
  • Mergers & acquisitions and collaboration agreements are common as companies seek to expand their offerings and enhance their competitive positions. Despite the advancements, challenges remain, including the need for installation services, addressing the skills gap, and ensuring compatibility with traditional manufacturing methods. Desktop additive manufacturing and desktop 3d printers are also gaining traction for prototyping and educational purposes. The market's future direction lies in the continued development of more advanced technologies, improved design software, and the expansion of applications beyond prototyping to production. The shift from subtractive manufacturing methods to additive manufacturing is transforming industries, offering new opportunities for innovation and cost savings.
  • The market's dynamics are shaped by ongoing technological advancements, regulatory developments, and industry 4.0 trends.

How is this Additive Manufacturing Industry segmented?

The additive manufacturing industry research report provides comprehensive data (region-wise segment analysis), with forecasts and estimates in "USD million" for the period 2025-2029, as well as historical data from 2019-2023 for the following segments.

  • Component
    • Hardware
    • Software
    • Services
  • End-user
    • Automotive
    • Aerospace
    • Industrial
    • Healthcare
    • Defense
    • Consumer Goods
    • Education/Research
    • Others
  • Material
    • Plastics
    • Metals
    • Ceramics
    • Others
  • Technology
    • Stereolithography
    • Polyjet printing
    • Binder jetting
    • Laser sintering
    • Fused Deposition Modeling (FDM)
    • Direct Metal Laser Sintering (DMLS)
    • Electron Beam Melting (EBM)
    • Directed Energy Deposition (DED)
    • Others
    • Binder jetting
  • Geography
    • North America
      • US
      • Canada
    • Europe
      • France
      • Germany
      • Spain
      • UK
    • APAC
      • China
      • India
      • Japan
    • South America
      • Brazil
    • Middle East and Africa
      • UAE
    • Rest of World

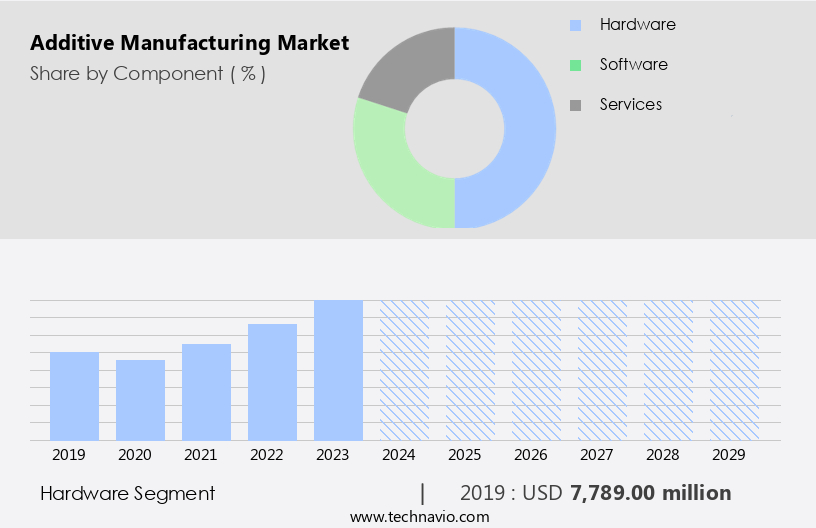
By Component Insights

The hardware segment is estimated to witness significant growth during the forecast period.

Additive manufacturing, also known as 3D printing, is revolutionizing industrial production by enabling the creation of complex parts layer-by-layer. The market for this technology is in a high-growth stage, driven by the increasing adoption in industries such as aerospace, automotive, healthcare, and manufacturing. Industrial 3D printers, which use technologies like Fused Deposition Modeling (FDM), Stereolithography, Selective Laser Sintering (SLS), and Digital Light Processing (DLP), are at the heart of this process. These printers offer advantages such as enhanced material usage, functional parts precision, and reduced production expenses. The dental industry and education sector are witnessing significant growth in the utilization of additive manufacturing for patient-specific healthcare products and educational purposes, respectively.

Material optimization and design software utilization are also crucial components, enabling the creation of cost-effective manufacturing solutions. The rapid prototyping benefits and sustainability advantages of additive manufacturing further contribute to its popularity. The market for additive manufacturing is witnessing significant software growth potential, with demand for scanning software, design software, and consultation solutions increasing. The automotive industry is a significant segment, with automotive prototyping being a major application. The proliferation of additive manufacturing technology is transforming traditional manufacturing methods, making it an essential tool for businesses seeking to remain competitive. Installation services are also becoming increasingly important to ensure the smooth implementation of additive manufacturing solutions.

Additive manufacturing, through its various components, is transforming the manufacturing landscape by offering rapid manufacturing processes, improved material usage, and cost savings. The technology's continued growth is expected to bring about significant advancements in various industries.

Additive Manufacturing Market Size

Get a glance at the market report of share of various segments Request Free Sample

The Hardware segment was valued at USD 7.79 billion in 2019 and showed a gradual increase during the forecast period.

Regional Analysis

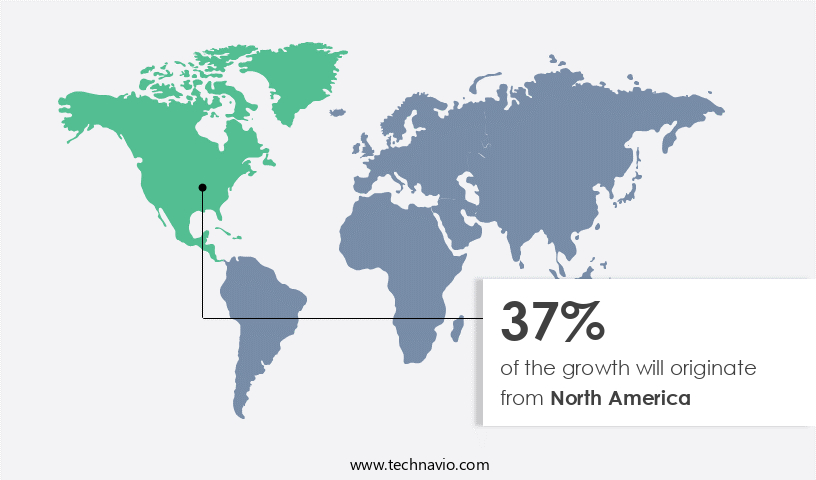
North America is estimated to contribute 37% to the growth of the global market during the forecast period.Technavio's analysts have elaborately explained the regional trends and drivers that shape the market during the forecast period.

Additive Manufacturing Market Share by Geography

For more insights on the market size of various regions, Request Free Sample

Additive manufacturing, also known as 3D printing, is revolutionizing industrial production by enabling the creation of complex, functional parts through layer-by-layer addition. This technology offers several advantages over traditional manufacturing methods, including enhanced material usage, reduced production expenses, and increased precision. Industrial 3D printers, such as Fuse Deposition Modeling and Stereolithography, are increasingly being adopted for manufacturing functional parts, particularly in industries like automotive and dental. The automotive industry's growing demand for lightweight components and customized designs is driving the adoption of additive manufacturing. Companies like General Motors (GM) and Ford Motor Company are investing in this technology to improve fuel efficiency, reduce emissions, and cater to evolving consumer preferences and regulatory standards.

The dental industry is also experiencing significant growth due to the production of patient-specific healthcare products. Additive manufacturing also offers sustainability advantages, as it minimizes material waste and reduces the need for transportation and inventory. The technology's proliferation is further fueled by the growth potential of design software and scanning software, which enable efficient production and optimization of materials. Despite the advantages, the market is still in its high growth stage, with significant potential for further expansion. The technology's capabilities continue to evolve, with advancements in metal material dominance, rapid manufacturing processes, and consultation solutions. The education sector is also utilizing additive manufacturing for educational purposes, further expanding its reach and impact.

Market Dynamics

Our researchers analyzed the data with 2024 as the base year, along with the key drivers, trends, and challenges. A holistic analysis of drivers will help companies refine their marketing strategies to gain a competitive advantage.

What are the key market drivers leading to the rise in the adoption of Additive Manufacturing Industry?

  • High demand in medical device sector is the key driver of the market. 
  • 3D printing is revolutionizing the medical field by enabling the creation of customized implants and prosthetics, tailored to the unique requirements of individual patients. This customization leads to improved fit and functionality, resulting in better patient outcomes. Medical professionals utilize 3D printing technology to create anatomical models, offering a hands-on understanding of complex surgeries and techniques. These models reduce operation time and risks by providing a more comprehensive visualization of patient anatomy and pathology, aiding in the planning of intricate medical and surgical procedures.
  • The adoption of 3D printing in the medical sector is on the rise due to its numerous advantages, making it an essential tool for medical professionals in clinical and research applications.

What are the market trends shaping the Additive Manufacturing Industry?

  • Increase in consumer interest in 3D customized products is the upcoming market trend. 
  • Customization in additive manufacturing, or 3D printing, is gaining popularity among consumers due to the ability to create unique, tailor-made products. This trend is driven by the increasing affordability of desktop 3D printers, enabling individuals to produce customized items at home. However, the high cost of these printers limits their accessibility to a select group of consumers with a significant disposable income. As a result, many consumers opt for online services that offer customized 3D-printed products. The market for customized 3D-printed goods is expanding, with various industries, such as healthcare, automotive, and aerospace, adopting this technology to create complex and intricate parts.
  • Despite the high cost, consumers are willing to invest in customized 3D-printed products due to their unique value proposition. This trend is expected to continue, with advancements in technology and increasing affordability leading to wider adoption.

What challenges does the Additive Manufacturing Industry face during its growth?

  • High initial cost incurred in setting up additive manufacturing facilities is a key challenge affecting the industry growth. 
  • Additive manufacturing, a revolutionary technology in the manufacturing industry, is characterized by its layer-by-layer production process. While the market for this technology is growing, the high costs associated with it remain a significant challenge. The primary drivers of these costs are the specialized equipment and advanced software required for additive manufacturing. The cost of entry-level FDM or SLA machines is relatively low, ranging from under USD5,000. However, high-end additive manufacturing printers, such as SLS, material jetting, and metal printing, can cost anywhere from USD200,000 to USD850,000, and even several millions of dollars. Moreover, the need for proprietary raw materials sold by 3D printer manufacturers at high profit margins further contributes to the high costs.
  • End-users also face the additional expense of training or hiring skilled personnel to ensure the production of high-quality devices. Despite these challenges, the benefits of additive manufacturing, including reduced material waste, increased design freedom, and faster production times, make it an attractive option for various industries.

Exclusive Customer Landscape

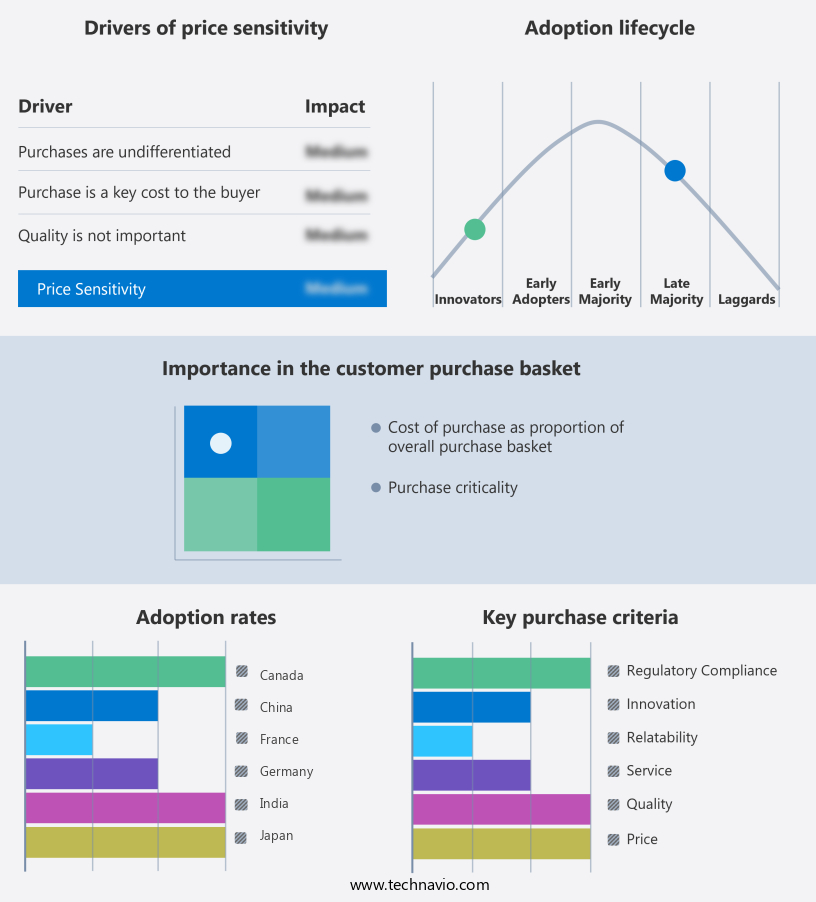
The additive manufacturing market forecasting report includes the adoption lifecycle of the market, covering from the innovator's stage to the laggard's stage. It focuses on adoption rates in different regions based on penetration. Furthermore, the additive manufacturing market report also includes key purchase criteria and drivers of price sensitivity to help companies evaluate and develop their market growth analysis strategies.

Additive Manufacturing Market Share by Geography

 Customer Landscape

Key Companies & Market Insights

Companies are implementing various strategies, such as strategic alliances, additive manufacturing market forecast, partnerships, mergers and acquisitions, geographical expansion, and product/service launches, to enhance their presence in the industry.

3D Systems Corp. - The company specializes in additive manufacturing solutions, providing advanced 3D printers, print materials, and accompanying software. Our offerings cater to various industries, enabling efficient production and innovation through cutting-edge technology.

The industry research and growth report includes detailed analyses of the competitive landscape of the market and information about key companies, including:

  • 3D Systems Corp.
  • 3DEO Inc.
  • Additive Industries BV
  • Autodesk Inc.
  • BICO Group AB
  • Canon Inc.
  • Carbon Inc.
  • CINCINNATI Inc.
  • ColVisTec AG
  • DMG MORI Co. Ltd.
  • dsm-firmenich
  • ENVISIONTEC US LLC
  • EOS GmbH
  • Formlabs Inc.
  • General Electric Co.
  • HP Inc.
  • Markforged Holding Corp.
  • MATERIALISE NV
  • Stratasys Ltd.
  • voxeljet AG

Qualitative and quantitative analysis of companies has been conducted to help clients understand the wider business environment as well as the strengths and weaknesses of key industry players. Data is qualitatively analyzed to categorize companies as pure play, category-focused, industry-focused, and diversified; it is quantitatively analyzed to categorize companies as dominant, leading, strong, tentative, and weak.

Research Analyst Overview

Additive manufacturing, also known as 3D printing, is a revolutionary technology that enables the creation of three-dimensional objects by adding material layer-by-layer. This process offers several advantages over traditional manufacturing methods, making it an increasingly popular choice for various industries. One significant benefit of additive manufacturing is the enhanced material usage it provides. By building objects from the ground up, only the necessary material is used, reducing waste and production expenses. This feature is particularly appealing to industries that deal with complex geometries and intricate designs. Industrial 3D printers, which are designed for large-scale production, have gained traction in recent years.

These printers use various techniques such as Fuse Deposition Modeling (FDM) and Stereolithography (SLA) to create functional parts with high precision. The ability to produce precise parts is crucial for industries that require high-quality components, such as the aerospace and medical sectors. Desktop 3D printers, on the other hand, are more suitable for prototyping and educational purposes. These printers offer a cost-effective solution for individuals and small businesses, allowing them to create their designs quickly and easily. The growth of additive manufacturing has led to an increased demand for scanning software, which is essential for converting traditional designs into 3D models.

The software market is expected to grow significantly as more companies adopt additive manufacturing processes. Functional parts produced through additive manufacturing offer several advantages over those made using subtractive methods. These advantages include reduced material waste, faster production times, and the ability to create complex geometries that are difficult or impossible to achieve using traditional methods. The dental industry has seen significant growth in the adoption of additive manufacturing technology. Patient-specific healthcare products, such as dental implants and bridges, can be produced using 3D printing, leading to improved patient outcomes and reduced production costs. The education sector is also utilizing additive manufacturing for various purposes, including research and development, curriculum development, and student training.

The technology's ability to create complex models and prototypes makes it an invaluable tool for educational institutions. Material optimization is another area where additive manufacturing excels. By using advanced design software and material properties, manufacturers can optimize their designs for improved performance and reduced production costs. Stereolithography, a popular additive manufacturing technique, offers several advantages over traditional manufacturing methods. It allows for the production of parts with high resolution and intricate details, making it ideal for industries that require high-precision components. The automotive industry is another sector that has embraced additive manufacturing, particularly for prototyping and automotive design.

The technology's ability to create complex geometries and functional parts quickly and cost-effectively makes it an attractive option for automotive manufacturers. The growth potential of additive manufacturing software is significant, with the market expected to expand rapidly as more companies adopt the technology. The software market includes design software, scanning software, and consultation solutions, all of which are essential for optimizing the additive manufacturing process. Rapid prototyping is another area where additive manufacturing excels, offering significant benefits over traditional manufacturing methods. The technology's ability to produce functional parts quickly and cost-effectively makes it an attractive option for companies looking to bring their products to market faster.

Additive manufacturing also offers sustainability advantages, as it reduces material waste and production emissions compared to traditional manufacturing methods. The technology's high growth stage and continued technology proliferation make it an exciting area for innovation and development. Metal materials dominate the additive manufacturing landscape, with companies investing heavily in research and development to expand their offerings. Rapid manufacturing processes, such as metal 3D printing, are becoming increasingly common, offering significant benefits over traditional manufacturing methods. Installation services are also an essential part of the additive manufacturing ecosystem, ensuring that companies can effectively integrate the technology into their production processes.

These services include installation, training, and ongoing support, ensuring that companies can maximize the benefits of their additive manufacturing investments.

Market Scope

Report Coverage

Details

Page number

242

Base year

2024

Historic period

2019-2023

Forecast period

2025-2029

Growth momentum & CAGR

Accelerate at a CAGR of 23.9%

Market growth 2025-2029

USD 46759.2 million

Market structure

Fragmented

YoY growth 2024-2025(%)

21.4

Key countries

US, Germany, China, Canada, Japan, UK, France, India, Spain, South KoreaUAE, and Brazil

Competitive landscape

Leading Companies, Market Positioning of Companies, Competitive Strategies, and Industry Risks

Request Free Sample

What are the Key Data Covered in this Additive Manufacturing Market Research and Growth Report?

  • CAGR of the Additive Manufacturing industry during the forecast period
  • Detailed information on factors that will drive the growth and forecasting between 2025 and 2029
  • Precise estimation of the size of the market and its contribution of the industry in focus to the parent market
  • Accurate predictions about upcoming growth and trends and changes in consumer behaviour
  • Growth of the market across North America, Europe, APAC, South America, and Middle East and Africa
  • Thorough analysis of the market's competitive landscape and detailed information about companies
  • Comprehensive analysis of factors that will challenge the additive manufacturing market growth of industry companies

We can help! Our analysts can customize this additive manufacturing market research report to meet your requirements.

Get in touch

1 Executive Summary

  • 1.1 Market overview
    • Executive Summary - Chart on Market Overview
    • Executive Summary - Data Table on Market Overview
    • Executive Summary - Chart on Global Market Characteristics
    • Executive Summary - Chart on Market by Geography
    • Executive Summary - Chart on Market Segmentation by Component
    • Executive Summary - Chart on Market Segmentation by End-user
    • Executive Summary - Chart on Market Segmentation by Material
    • Executive Summary - Chart on Market Segmentation by Technology
    • Executive Summary - Chart on Incremental Growth
    • Executive Summary - Data Table on Incremental Growth
    • Executive Summary - Chart on Company Market Positioning

2 Technavio Analysis

  • 2.1 Analysis of price sensitivity, lifecycle, customer purchase basket, adoption rates, and purchase criteria
    • Analysis of price sensitivity, lifecycle, customer purchase basket, adoption rates, and purchase criteria
  • 2.2 Criticality of inputs and Factors of differentiation
    • Overview on criticality of inputs and factors of differentiation
  • 2.3 Factors of disruption
    • Overview on factors of disruption
  • 2.4 Impact of drivers and challenges
    • Impact of drivers and challenges in 2024 and 2029

3 Market Landscape

  • 3.1 Market ecosystem
    • Parent Market
    • Data Table on - Parent Market
  • 3.2 Market characteristics
    • Market characteristics analysis
  • 3.3 Value chain analysis
    • Value chain analysis

4 Market Sizing

  • 4.1 Market definition
    • Offerings of companies included in the market definition
  • 4.2 Market segment analysis
    • Market segments
  • 4.3 Market size 2024
    • 4.4 Market outlook: Forecast for 2024-2029
      • Chart on Global - Market size and forecast 2024-2029 ($ million)
      • Data Table on Global - Market size and forecast 2024-2029 ($ million)
      • Chart on Global Market: Year-over-year growth 2024-2029 (%)
      • Data Table on Global Market: Year-over-year growth 2024-2029 (%)

    5 Historic Market Size

    • 5.1 Global Additive Manufacturing Market 2019 - 2023
      • Historic Market Size - Data Table on Global Additive Manufacturing Market 2019 - 2023 ($ million)
    • 5.2 Component segment analysis 2019 - 2023
      • Historic Market Size - Component Segment 2019 - 2023 ($ million)
    • 5.3 End-user segment analysis 2019 - 2023
      • Historic Market Size - End-user Segment 2019 - 2023 ($ million)
    • 5.4 Material segment analysis 2019 - 2023
      • Historic Market Size - Material Segment 2019 - 2023 ($ million)
    • 5.5 Technology segment analysis 2019 - 2023
      • Historic Market Size - Technology Segment 2019 - 2023 ($ million)
    • 5.6 Geography segment analysis 2019 - 2023
      • Historic Market Size - Geography Segment 2019 - 2023 ($ million)
    • 5.7 Country segment analysis 2019 - 2023
      • Historic Market Size - Country Segment 2019 - 2023 ($ million)

    6 Qualitative Analysis

    • 6.1 Impact of AI on Global Additive Manufacturing Market

      7 Five Forces Analysis

      • 7.1 Five forces summary
        • Five forces analysis - Comparison between 2024 and 2029
      • 7.2 Bargaining power of buyers
        • Bargaining power of buyers - Impact of key factors 2024 and 2029
      • 7.3 Bargaining power of suppliers
        • Bargaining power of suppliers - Impact of key factors in 2024 and 2029
      • 7.4 Threat of new entrants
        • Threat of new entrants - Impact of key factors in 2024 and 2029
      • 7.5 Threat of substitutes
        • Threat of substitutes - Impact of key factors in 2024 and 2029
      • 7.6 Threat of rivalry
        • Threat of rivalry - Impact of key factors in 2024 and 2029
      • 7.7 Market condition
        • Chart on Market condition - Five forces 2024 and 2029

      8 Market Segmentation by Component

      • 8.1 Market segments
        • Chart on Component - Market share (2024-2029) (%)
        • Data Table on Component - Market share (2024-2029) (%)
      • 8.2 Comparison by Component
        • Chart on Comparison by Component
        • Data Table on Comparison by Component
      • 8.3 Hardware - Market size and forecast (2024-2029)
        • Chart on Hardware - Market size and forecast (2024-2029) ($ million)
        • Data Table on Hardware - Market size and forecast (2024-2029) ($ million)
        • Chart on Hardware - Year-over-year growth (2024-2029) (%)
        • Data Table on Hardware - Year-over-year growth (2024-2029) (%)
      • 8.4 Software - Market size and forecast (2024-2029)
        • Chart on Software - Market size and forecast (2024-2029) ($ million)
        • Data Table on Software - Market size and forecast (2024-2029) ($ million)
        • Chart on Software - Year-over-year growth (2024-2029) (%)
        • Data Table on Software - Year-over-year growth (2024-2029) (%)
      • 8.5 Services - Market size and forecast (2024-2029)
        • Chart on Services - Market size and forecast (2024-2029) ($ million)
        • Data Table on Services - Market size and forecast (2024-2029) ($ million)
        • Chart on Services - Year-over-year growth (2024-2029) (%)
        • Data Table on Services - Year-over-year growth (2024-2029) (%)
      • 8.6 Market opportunity by Component
        • Market opportunity by Component ($ million)
        • Data Table on Market opportunity by Component ($ million)

      9 Market Segmentation by End-user

      • 9.1 Market segments
        • Chart on End-user - Market share (2024-2029) (%)
        • Data Table on End-user - Market share (2024-2029) (%)
        • Chart on Others - Market size and forecast (2024-2029) ($ million)
        • Data Table on Others - Market size and forecast (2024-2029) ($ million)
        • Chart on Others - Year-over-year growth (2024-2029) (%)
        • Data Table on Others - Year-over-year growth (2024-2029) (%)
      • 9.2 Comparison by End-user
        • Chart on Comparison by End-user
        • Data Table on Comparison by End-user
        • Market opportunity by End-user ($ million)
        • Data Table on Market opportunity by End-user ($ million)
      • 9.3 Automotive - Market size and forecast (2024-2029)
        • Chart on Automotive - Market size and forecast (2024-2029) ($ million)
        • Data Table on Automotive - Market size and forecast (2024-2029) ($ million)
        • Chart on Automotive - Year-over-year growth (2024-2029) (%)
        • Data Table on Automotive - Year-over-year growth (2024-2029) (%)
      • 9.4 Aerospace - Market size and forecast (2024-2029)
        • Chart on Aerospace - Market size and forecast (2024-2029) ($ million)
        • Data Table on Aerospace - Market size and forecast (2024-2029) ($ million)
        • Chart on Aerospace - Year-over-year growth (2024-2029) (%)
        • Data Table on Aerospace - Year-over-year growth (2024-2029) (%)
      • 9.5 Industrial - Market size and forecast (2024-2029)
        • Chart on Industrial - Market size and forecast (2024-2029) ($ million)
        • Data Table on Industrial - Market size and forecast (2024-2029) ($ million)
        • Chart on Industrial - Year-over-year growth (2024-2029) (%)
        • Data Table on Industrial - Year-over-year growth (2024-2029) (%)
      • 9.6 Healthcare - Market size and forecast (2024-2029)
        • Chart on Healthcare - Market size and forecast (2024-2029) ($ million)
        • Data Table on Healthcare - Market size and forecast (2024-2029) ($ million)
        • Chart on Healthcare - Year-over-year growth (2024-2029) (%)
        • Data Table on Healthcare - Year-over-year growth (2024-2029) (%)
      • 9.7 Defense - Market size and forecast (2024-2029)
        • Chart on Defense - Market size and forecast (2024-2029) ($ million)
        • Data Table on Defense - Market size and forecast (2024-2029) ($ million)
        • Chart on Defense - Year-over-year growth (2024-2029) (%)
        • Data Table on Defense - Year-over-year growth (2024-2029) (%)
      • 9.8 Consumer Goods - Market size and forecast (2024-2029)
        • Chart on Consumer Goods - Market size and forecast (2024-2029) ($ million)
        • Data Table on Consumer Goods - Market size and forecast (2024-2029) ($ million)
        • Chart on Consumer Goods - Year-over-year growth (2024-2029) (%)
        • Data Table on Consumer Goods - Year-over-year growth (2024-2029) (%)
      • 9.9 Education/Research - Market size and forecast (2024-2029)
        • Chart on Education/Research - Market size and forecast (2024-2029) ($ million)
        • Data Table on Education/Research - Market size and forecast (2024-2029) ($ million)
        • Chart on Education/Research - Year-over-year growth (2024-2029) (%)
        • Data Table on Education/Research - Year-over-year growth (2024-2029) (%)

      10 Market Segmentation by Material

      • 10.1 Market segments
        • Chart on Material - Market share (2024-2029) (%)
        • Data Table on Material - Market share (2024-2029) (%)
      • 10.2 Comparison by Material
        • Chart on Comparison by Material
        • Data Table on Comparison by Material
      • 10.3 Plastics - Market size and forecast (2024-2029)
        • Chart on Plastics - Market size and forecast (2024-2029) ($ million)
        • Data Table on Plastics - Market size and forecast (2024-2029) ($ million)
        • Chart on Plastics - Year-over-year growth (2024-2029) (%)
        • Data Table on Plastics - Year-over-year growth (2024-2029) (%)
      • 10.4 Metals - Market size and forecast (2024-2029)
        • Chart on Metals - Market size and forecast (2024-2029) ($ million)
        • Data Table on Metals - Market size and forecast (2024-2029) ($ million)
        • Chart on Metals - Year-over-year growth (2024-2029) (%)
        • Data Table on Metals - Year-over-year growth (2024-2029) (%)
      • 10.5 Ceramics - Market size and forecast (2024-2029)
        • Chart on Ceramics - Market size and forecast (2024-2029) ($ million)
        • Data Table on Ceramics - Market size and forecast (2024-2029) ($ million)
        • Chart on Ceramics - Year-over-year growth (2024-2029) (%)
        • Data Table on Ceramics - Year-over-year growth (2024-2029) (%)
      • 10.6 Others - Market size and forecast (2024-2029)
        • Chart on Others - Market size and forecast (2024-2029) ($ million)
        • Data Table on Others - Market size and forecast (2024-2029) ($ million)
        • Chart on Others - Year-over-year growth (2024-2029) (%)
        • Data Table on Others - Year-over-year growth (2024-2029) (%)
      • 10.7 Market opportunity by Material
        • Market opportunity by Material ($ million)
        • Data Table on Market opportunity by Material ($ million)

      11 Market Segmentation by Technology

      • 11.1 Market segments
        • Chart on Technology - Market share (2024-2029) (%)
        • Data Table on Technology - Market share (2024-2029) (%)
        • Chart on Directed Energy Deposition (DED) - Market size and forecast (2024-2029) ($ million)
        • Data Table on Directed Energy Deposition (DED) - Market size and forecast (2024-2029) ($ million)
        • Chart on Directed Energy Deposition (DED) - Year-over-year growth (2024-2029) (%)
        • Data Table on Directed Energy Deposition (DED) - Year-over-year growth (2024-2029) (%)
      • 11.2 Comparison by Technology
        • Chart on Comparison by Technology
        • Data Table on Comparison by Technology
        • Chart on Others - Market size and forecast (2024-2029) ($ million)
        • Data Table on Others - Market size and forecast (2024-2029) ($ million)
        • Chart on Others - Year-over-year growth (2024-2029) (%)
        • Data Table on Others - Year-over-year growth (2024-2029) (%)
      • 11.3 Stereolithography - Market size and forecast (2024-2029)
        • Chart on Stereolithography - Market size and forecast (2024-2029) ($ million)
        • Data Table on Stereolithography - Market size and forecast (2024-2029) ($ million)
        • Chart on Stereolithography - Year-over-year growth (2024-2029) (%)
        • Data Table on Stereolithography - Year-over-year growth (2024-2029) (%)
        • Market opportunity by Technology ($ million)
        • Data Table on Market opportunity by Technology ($ million)
      • 11.4 Polyjet printing - Market size and forecast (2024-2029)
        • Chart on Polyjet printing - Market size and forecast (2024-2029) ($ million)
        • Data Table on Polyjet printing - Market size and forecast (2024-2029) ($ million)
        • Chart on Polyjet printing - Year-over-year growth (2024-2029) (%)
        • Data Table on Polyjet printing - Year-over-year growth (2024-2029) (%)
      • 11.5 Binder jetting - Market size and forecast (2024-2029)
        • Chart on Binder jetting - Market size and forecast (2024-2029) ($ million)
        • Data Table on Binder jetting - Market size and forecast (2024-2029) ($ million)
        • Chart on Binder jetting - Year-over-year growth (2024-2029) (%)
        • Data Table on Binder jetting - Year-over-year growth (2024-2029) (%)
      • 11.6 Laser sintering - Market size and forecast (2024-2029)
        • Chart on Laser sintering - Market size and forecast (2024-2029) ($ million)
        • Data Table on Laser sintering - Market size and forecast (2024-2029) ($ million)
        • Chart on Laser sintering - Year-over-year growth (2024-2029) (%)
        • Data Table on Laser sintering - Year-over-year growth (2024-2029) (%)
      • 11.7 Fused Deposition Modeling (FDM) - Market size and forecast (2024-2029)
        • Chart on Fused Deposition Modeling (FDM) - Market size and forecast (2024-2029) ($ million)
        • Data Table on Fused Deposition Modeling (FDM) - Market size and forecast (2024-2029) ($ million)
        • Chart on Fused Deposition Modeling (FDM) - Year-over-year growth (2024-2029) (%)
        • Data Table on Fused Deposition Modeling (FDM) - Year-over-year growth (2024-2029) (%)
      • 11.8 Direct Metal Laser Sintering (DMLS) - Market size and forecast (2024-2029)
        • Chart on Direct Metal Laser Sintering (DMLS) - Market size and forecast (2024-2029) ($ million)
        • Data Table on Direct Metal Laser Sintering (DMLS) - Market size and forecast (2024-2029) ($ million)
        • Chart on Direct Metal Laser Sintering (DMLS) - Year-over-year growth (2024-2029) (%)
        • Data Table on Direct Metal Laser Sintering (DMLS) - Year-over-year growth (2024-2029) (%)
      • 11.9 Electron Beam Melting (EBM) - Market size and forecast (2024-2029)
        • Chart on Electron Beam Melting (EBM) - Market size and forecast (2024-2029) ($ million)
        • Data Table on Electron Beam Melting (EBM) - Market size and forecast (2024-2029) ($ million)
        • Chart on Electron Beam Melting (EBM) - Year-over-year growth (2024-2029) (%)
        • Data Table on Electron Beam Melting (EBM) - Year-over-year growth (2024-2029) (%)

      12 Customer Landscape

      • 12.1 Customer landscape overview
        • Analysis of price sensitivity, lifecycle, customer purchase basket, adoption rates, and purchase criteria

      13 Geographic Landscape

      • 13.1 Geographic segmentation
        • Chart on Market share by geography 2024-2029 (%)
        • Data Table on Market share by geography 2024-2029 (%)
      • 13.2 Geographic comparison
        • Chart on Geographic comparison
        • Data Table on Geographic comparison
      • 13.3 North America - Market size and forecast 2024-2029
        • Chart on North America - Market size and forecast 2024-2029 ($ million)
        • Data Table on North America - Market size and forecast 2024-2029 ($ million)
        • Chart on North America - Year-over-year growth 2024-2029 (%)
        • Data Table on North America - Year-over-year growth 2024-2029 (%)
      • 13.4 Europe - Market size and forecast 2024-2029
        • Chart on Europe - Market size and forecast 2024-2029 ($ million)
        • Data Table on Europe - Market size and forecast 2024-2029 ($ million)
        • Chart on Europe - Year-over-year growth 2024-2029 (%)
        • Data Table on Europe - Year-over-year growth 2024-2029 (%)
      • 13.5 APAC - Market size and forecast 2024-2029
        • Chart on APAC - Market size and forecast 2024-2029 ($ million)
        • Data Table on APAC - Market size and forecast 2024-2029 ($ million)
        • Chart on APAC - Year-over-year growth 2024-2029 (%)
        • Data Table on APAC - Year-over-year growth 2024-2029 (%)
      • 13.6 South America - Market size and forecast 2024-2029
        • Chart on South America - Market size and forecast 2024-2029 ($ million)
        • Data Table on South America - Market size and forecast 2024-2029 ($ million)
        • Chart on South America - Year-over-year growth 2024-2029 (%)
        • Data Table on South America - Year-over-year growth 2024-2029 (%)
      • 13.7 Middle East and Africa - Market size and forecast 2024-2029
        • Chart on Middle East and Africa - Market size and forecast 2024-2029 ($ million)
        • Data Table on Middle East and Africa - Market size and forecast 2024-2029 ($ million)
        • Chart on Middle East and Africa - Year-over-year growth 2024-2029 (%)
        • Data Table on Middle East and Africa - Year-over-year growth 2024-2029 (%)
      • 13.8 US - Market size and forecast 2024-2029
        • Chart on US - Market size and forecast 2024-2029 ($ million)
        • Data Table on US - Market size and forecast 2024-2029 ($ million)
        • Chart on US - Year-over-year growth 2024-2029 (%)
        • Data Table on US - Year-over-year growth 2024-2029 (%)
      • 13.9 Germany - Market size and forecast 2024-2029
        • Chart on Germany - Market size and forecast 2024-2029 ($ million)
        • Data Table on Germany - Market size and forecast 2024-2029 ($ million)
        • Chart on Germany - Year-over-year growth 2024-2029 (%)
        • Data Table on Germany - Year-over-year growth 2024-2029 (%)
      • 13.10 Canada - Market size and forecast 2024-2029
        • Chart on Canada - Market size and forecast 2024-2029 ($ million)
        • Data Table on Canada - Market size and forecast 2024-2029 ($ million)
        • Chart on Canada - Year-over-year growth 2024-2029 (%)
        • Data Table on Canada - Year-over-year growth 2024-2029 (%)
      • 13.11 China - Market size and forecast 2024-2029
        • Chart on China - Market size and forecast 2024-2029 ($ million)
        • Data Table on China - Market size and forecast 2024-2029 ($ million)
        • Chart on China - Year-over-year growth 2024-2029 (%)
        • Data Table on China - Year-over-year growth 2024-2029 (%)
      • 13.12 Japan - Market size and forecast 2024-2029
        • Chart on Japan - Market size and forecast 2024-2029 ($ million)
        • Data Table on Japan - Market size and forecast 2024-2029 ($ million)
        • Chart on Japan - Year-over-year growth 2024-2029 (%)
        • Data Table on Japan - Year-over-year growth 2024-2029 (%)
      • 13.13 UK - Market size and forecast 2024-2029
        • Chart on UK - Market size and forecast 2024-2029 ($ million)
        • Data Table on UK - Market size and forecast 2024-2029 ($ million)
        • Chart on UK - Year-over-year growth 2024-2029 (%)
        • Data Table on UK - Year-over-year growth 2024-2029 (%)
      • 13.14 France - Market size and forecast 2024-2029
        • Chart on France - Market size and forecast 2024-2029 ($ million)
        • Data Table on France - Market size and forecast 2024-2029 ($ million)
        • Chart on France - Year-over-year growth 2024-2029 (%)
        • Data Table on France - Year-over-year growth 2024-2029 (%)
      • 13.15 India - Market size and forecast 2024-2029
        • Chart on India - Market size and forecast 2024-2029 ($ million)
        • Data Table on India - Market size and forecast 2024-2029 ($ million)
        • Chart on India - Year-over-year growth 2024-2029 (%)
        • Data Table on India - Year-over-year growth 2024-2029 (%)
      • 13.16 Spain - Market size and forecast 2024-2029
        • Chart on Spain - Market size and forecast 2024-2029 ($ million)
        • Data Table on Spain - Market size and forecast 2024-2029 ($ million)
        • Chart on Spain - Year-over-year growth 2024-2029 (%)
        • Data Table on Spain - Year-over-year growth 2024-2029 (%)
      • 13.17 South Korea - Market size and forecast 2024-2029
        • Chart on South Korea - Market size and forecast 2024-2029 ($ million)
        • Data Table on South Korea - Market size and forecast 2024-2029 ($ million)
        • Chart on South Korea - Year-over-year growth 2024-2029 (%)
        • Data Table on South Korea - Year-over-year growth 2024-2029 (%)
      • 13.18 Market opportunity by geography
        • Market opportunity by geography ($ million)
        • Data Tables on Market opportunity by geography ($ million)
      • 13.19 South KoreaUAE - Market size and forecast (2024-2029)
        • Chart on South KoreaUAE - Market size and forecast (2024-2029) ($ million)
        • Data Table on South KoreaUAE - Market size and forecast (2024-2029) ($ million)
        • Chart on South KoreaUAE - Year-over-year growth (2024-2029) (%)
        • Data Table on South KoreaUAE - Year-over-year growth (2024-2029) (%)
      • 13.20 Brazil - Market size and forecast (2024-2029)
        • Chart on Brazil - Market size and forecast (2024-2029) ($ million)
        • Data Table on Brazil - Market size and forecast (2024-2029) ($ million)
        • Chart on Brazil - Year-over-year growth (2024-2029) (%)
        • Data Table on Brazil - Year-over-year growth (2024-2029) (%)
      • 13.21 Rest of World (ROW) - Market size and forecast (2024-2029)
        • Chart on Rest of World (ROW) - Market size and forecast (2024-2029) ($ million)
        • Data Table on Rest of World (ROW) - Market size and forecast (2024-2029) ($ million)
        • Chart on Rest of World (ROW) - Year-over-year growth (2024-2029) (%)
        • Data Table on Rest of World (ROW) - Year-over-year growth (2024-2029) (%)

      14 Drivers, Challenges, and Opportunity/Restraints

      • 14.1 Market drivers
        • 14.2 Market challenges
          • 14.3 Impact of drivers and challenges
            • Impact of drivers and challenges in 2024 and 2029
          • 14.4 Market opportunities/restraints

            15 Competitive Landscape

            • 15.1 Overview
              • 15.2 Competitive Landscape
                • Overview on criticality of inputs and factors of differentiation
              • 15.3 Landscape disruption
                • Overview on factors of disruption
              • 15.4 Industry risks
                • Impact of key risks on business

              16 Competitive Analysis

              • 16.1 Companies profiled
                • Companies covered
              • 16.2 Company ranking index
                • Company ranking index
              • 16.3 Market positioning of companies
                • Matrix on companies position and classification
              • 3D Systems Corp.
                • 3D Systems Corp. - Overview
                • 3D Systems Corp. - Business segments
                • 3D Systems Corp. - Key news
                • 3D Systems Corp. - Key offerings
                • 3D Systems Corp. - Segment focus
                • SWOT
              • 3DEO Inc.
                • 3DEO Inc. - Overview
                • 3DEO Inc. - Product / Service
                • 3DEO Inc. - Key offerings
                • SWOT
              • 16.6 Additive Industries BV
                • Additive Industries BV - Overview
                • Additive Industries BV - Product / Service
                • Additive Industries BV - Key offerings
                • SWOT
              • 16.7 Autodesk Inc.
                • Autodesk Inc. - Overview
                • Autodesk Inc. - Business segments
                • Autodesk Inc. - Key news
                • Autodesk Inc. - Key offerings
                • Autodesk Inc. - Segment focus
                • SWOT
              • 16.8 Canon Inc.
                • Canon Inc. - Overview
                • Canon Inc. - Business segments
                • Canon Inc. - Key news
                • Canon Inc. - Key offerings
                • Canon Inc. - Segment focus
                • SWOT
              • 16.9 ColVisTec AG
                • ColVisTec AG - Overview
                • ColVisTec AG - Product / Service
                • ColVisTec AG - Key offerings
                • SWOT
              • 16.10 DMG MORI Co. Ltd.
                • DMG MORI Co. Ltd. - Overview
                • DMG MORI Co. Ltd. - Business segments
                • DMG MORI Co. Ltd. - Key offerings
                • DMG MORI Co. Ltd. - Segment focus
                • SWOT
              • 16.11 ENVISIONTEC US LLC
                • ENVISIONTEC US LLC - Overview
                • ENVISIONTEC US LLC - Product / Service
                • ENVISIONTEC US LLC - Key offerings
                • SWOT
              • 16.12 EOS GmbH
                • EOS GmbH - Overview
                • EOS GmbH - Product / Service
                • EOS GmbH - Key news
                • EOS GmbH - Key offerings
                • SWOT
              • 16.13 Formlabs Inc.
                • Formlabs Inc. - Overview
                • Formlabs Inc. - Product / Service
                • Formlabs Inc. - Key offerings
                • SWOT
              • 16.14 General Electric Co.
                • General Electric Co. - Overview
                • General Electric Co. - Business segments
                • General Electric Co. - Key news
                • General Electric Co. - Key offerings
                • General Electric Co. - Segment focus
                • SWOT
              • 16.15 HP Inc.
                • HP Inc. - Overview
                • HP Inc. - Business segments
                • HP Inc. - Key news
                • HP Inc. - Key offerings
                • HP Inc. - Segment focus
                • SWOT
              • 16.16 MATERIALISE NV
                • MATERIALISE NV - Overview
                • MATERIALISE NV - Business segments
                • MATERIALISE NV - Key news
                • MATERIALISE NV - Key offerings
                • MATERIALISE NV - Segment focus
                • SWOT
              • 16.17 Stratasys Ltd.
                • Stratasys Ltd. - Overview
                • Stratasys Ltd. - Product / Service
                • Stratasys Ltd. - Key news
                • Stratasys Ltd. - Key offerings
                • SWOT
              • 16.18 voxeljet AG
                • voxeljet AG - Overview
                • voxeljet AG - Business segments
                • voxeljet AG - Key news
                • voxeljet AG - Key offerings
                • voxeljet AG - Segment focus
                • SWOT

              17 Appendix

              • 17.1 Scope of the report
                • 17.2 Inclusions and exclusions checklist
                  • Inclusions checklist
                  • Exclusions checklist
                • 17.3 Currency conversion rates for US$
                  • Currency conversion rates for US$
                • 17.4 Research methodology
                  • Research methodology
                • 17.5 Data procurement
                  • Information sources
                • 17.6 Data validation
                  • Data validation
                • 17.7 Validation techniques employed for market sizing
                  • Validation techniques employed for market sizing
                • 17.8 Data synthesis
                  • Data synthesis
                • 17.9 360 degree market analysis
                  • 360 degree market analysis
                • 17.10 List of abbreviations
                  • List of abbreviations

                Research Methodology

                Technavio presents a detailed picture of the market by way of study, synthesis, and summation of data from multiple sources. The analysts have presented the various facets of the market with a particular focus on identifying the key industry influencers. The data thus presented is comprehensive, reliable, and the result of extensive research, both primary and secondary.

                INFORMATION SOURCES

                Primary sources

                • Manufacturers and suppliers
                • Channel partners
                • Industry experts
                • Strategic decision makers

                Secondary sources

                • Industry journals and periodicals
                • Government data
                • Financial reports of key industry players
                • Historical data
                • Press releases

                DATA ANALYSIS

                Data Synthesis

                • Collation of data
                • Estimation of key figures
                • Analysis of derived insights

                Data Validation

                • Triangulation with data models
                • Reference against proprietary databases
                • Corroboration with industry experts

                REPORT WRITING

                Qualitative

                • Market drivers
                • Market challenges
                • Market trends
                • Five forces analysis

                Quantitative

                • Market size and forecast
                • Market segmentation
                • Geographical insights
                • Competitive landscape

                Interested in this report?

                Get your sample now to see our research methodology and insights!

                Download Now

                Frequently Asked Questions

                Additive Manufacturing market growth will increase by $ 46759.2 mn during 2025-2029.

                The Additive Manufacturing market is expected to grow at a CAGR of 23.9% during 2025-2029.

                Additive Manufacturing market is segmented by Component( Hardware, Software, Services) End-user( Automotive, Aerospace, Industrial, Healthcare, Defense) Material( Plastics, Metals, Ceramics, Others, Middle East and Africa)

                3D Systems Corp., 3DEO Inc., Additive Industries BV, Autodesk Inc., BICO Group AB, Canon Inc., Carbon Inc., CINCINNATI Inc., ColVisTec AG, DMG MORI Co. Ltd., dsm-firmenich, ENVISIONTEC US LLC, EOS GmbH, Formlabs Inc., General Electric Co., HP Inc., Markforged Holding Corp., MATERIALISE NV, Stratasys Ltd., voxeljet AG are a few of the key vendors in the Additive Manufacturing market.

                North America will register the highest growth rate of 37% among the other regions. Therefore, the Additive Manufacturing market in North America is expected to garner significant business opportunities for the vendors during the forecast period.

                US, Germany, China, Canada, Japan, UK, France, India, Spain, South KoreaUAE, Brazil

                • High demand in medical device sector3D printing enables the creation of customized implants and prosthetics tailored to the needs of individual patients. This customization improves the fit and functionality of these devices is the driving factor this market.
                • leading to better patient outcomes. Medical professionals use 3D printing to create anatomical models that help in planning and training students on surgeries and techniques. These models provide a hands-on understanding of complex surgeries is the driving factor this market.
                • reducing the operation time and risks. 3D printing is a rapidly advancing technology that medical professionals are increasingly adopting for various clinical and research purposes. 3D-printed anatomical models allow surgical teams to have a better visual understanding of the complex anatomy and pathology of patients and anticipate operative challenges is the driving factor this market.
                • which will aid in planning complex medical/surgical procedures. 3D-printed anatomical models are extensively used in orthopedic is the driving factor this market.
                • cardiac is the driving factor this market.
                • dental is the driving factor this market.
                • and craniomaxillofacial surgeries with the potential to optimize patient treatment. They also allow clinicians to investigate solutions or possible complications that may not be seen while observing a two-dimensional (2D) representation. For instance is the driving factor this market.
                • pre-surgical planning of certain procedures is the driving factor this market.
                • such as shoulder arthroplasty is the driving factor this market.
                • can be performed much more effectively using 3D images than 2D images. Thus is the driving factor this market.
                • increasing demand for 3D printing in the manufacturing of medical devices and other healthcare applications will fuel the growth of the global additive manufacturing market during the forecast period. is the driving factor this market.

                The Additive Manufacturing market vendors should focus on grabbing business opportunities from the Hardware segment as it accounted for the largest market share in the base year.