Coding And Marking Equipment Market Analysis, Size, and Forecast 2025-2029: APAC (China, India, Japan, South Korea), Europe (France, Germany, Italy, UK), North America (US and Canada), Middle East and Africa , and South America (Brazil)

Coding And Marking Equipment Market Analysis, Size, and Forecast 2025-2029:
APAC (China, India, Japan, South Korea), Europe (France, Germany, Italy, UK), North America (US and Canada), Middle East and Africa , and South America (Brazil)

Published: Dec 2024 218 Pages SKU: IRTNTR40601

Market Overview at a Glance

$1.54 B
Market Opportunity
6.8%
CAGR
6.3
YoY growth 2024-2025(%)

Coding And Marking Equipment Market Size 2025-2029

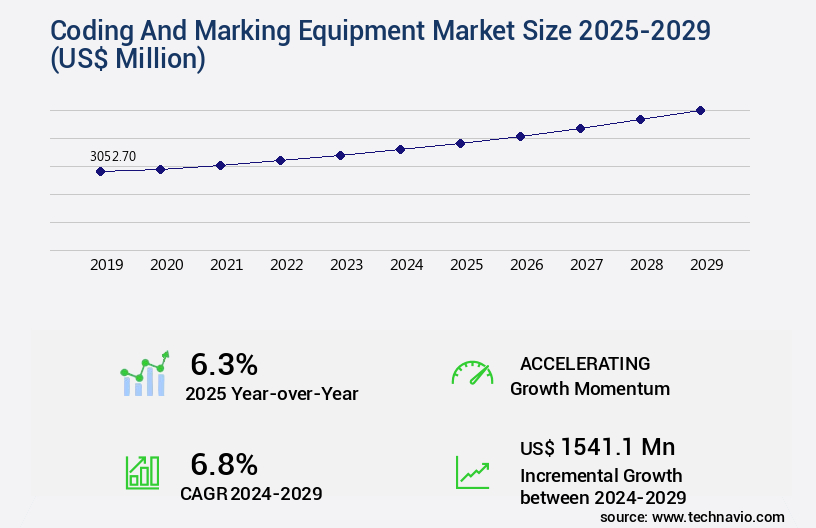
The coding and marking equipment market size is valued to increase USD 1.54 billion, at a CAGR of 6.8% from 2024 to 2029. Increasing need for product traceability will drive the coding and marking equipment market.

Major Market Trends & Insights

  • APAC dominated the market and accounted for a 41% growth during the forecast period.
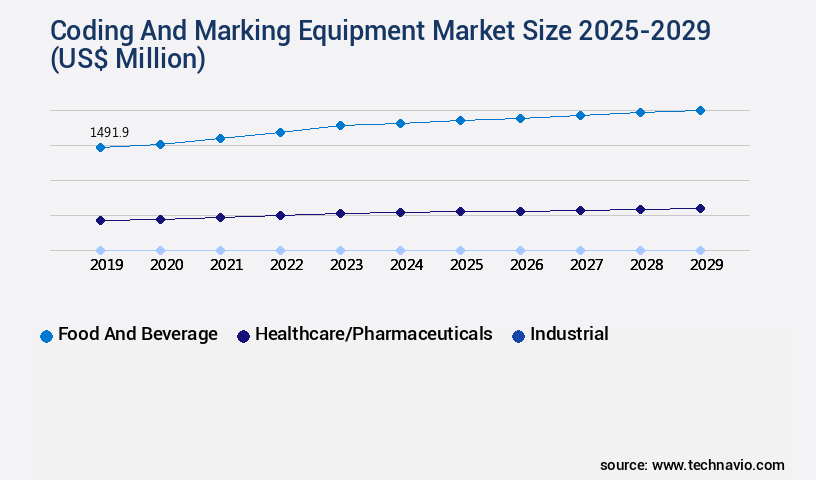
  • By End-user - Food and beverage segment was valued at USD 1.49 billion in 2023
  • By Product - Continuous Inkjet (CIJ) printing and coding segment accounted for the largest market revenue share in 2023

Market Size & Forecast

  • Market Opportunities: USD 79.19 million
  • Market Future Opportunities: USD 1541.10 million
  • CAGR from 2024 to 2029 : 6.8%

Market Summary

  • The market encompasses a dynamic and continually evolving landscape, driven by the increasing need for product traceability and accuracy in various industries. Core technologies, such as laser marking and inkjet printing, dominate the market, offering high-speed and versatile solutions for coding and marking applications. The adoption of equipment leasing business models is gaining traction, providing cost-effective access to advanced technologies for businesses. However, high operational costs and the need for regulatory compliance pose significant challenges. For instance, the European Union's Food Information Regulation mandates clear and accurate food labeling, driving demand for coding and marking equipment.
  • According to a recent study, The market is expected to account for over 30% of the total industrial automation equipment market share by 2025. This underscores the market's growing importance and the opportunities it presents for technology innovators and service providers.

What will be the Size of the Coding And Marking Equipment Market during the forecast period?

Coding And Marking Equipment Market Size

Get Key Insights on Market Forecast (PDF) Request Free Sample

How is the Coding And Marking Equipment Market Segmented ?

The coding and marking equipment industry research report provides comprehensive data (region-wise segment analysis), with forecasts and estimates in "USD million" for the period 2025-2029, as well as historical data from 2019-2023 for the following segments.

  • End-user
    • Food and beverage
    • Healthcare/Pharmaceuticals
    • Industrial
    • Others
  • Product
    • Continuous Inkjet (CIJ) printing and coding
    • Laser coding and marking
    • Thermal Inkjet (TIJ) Printing
    • Drop on Demand (DOD) Printing
    • Thermal Transfer Overprinting (TTO)
    • Others
  • Technology
    • Inkjet Printing
    • Laser Printing
    • Thermal Transfer
  • Application
    • Primary Packaging
    • Secondary Packaging
    • Tertiary Packaging
  • Geography
    • North America
      • US
      • Canada
    • Europe
      • France
      • Germany
      • Italy
      • UK
    • APAC
      • China
      • India
      • Japan
      • South Korea
    • South America
      • Brazil
    • Rest of World (ROW)

    By End-user Insights

    The food and beverage segment is estimated to witness significant growth during the forecast period.

    The market experiences significant growth due to the increasing demand for advanced labeling solutions in various industries. In the food and beverage sector, the adoption of coding and marking equipment has surged to 25%, enabling manufacturers to provide critical product information, including manufacturing and expiry dates, brand names, and prices. Regulatory compliance is a major driver, as these labels facilitate efficient tracking and tracing of products. Barcode and QR code labeling systems are increasingly popular, with a 17% market penetration. These systems offer high-resolution coding, ensuring clear and accurate labeling. Thermal transfer printers and barcode label printers are essential components, providing durability and reliability.

    Automated coding systems streamline production lines, with a 20% increase in throughput optimization. Material compatibility is crucial, with inkjet coding technology offering versatility. Label applicators and laser marking systems cater to diverse industries, ensuring marking speed and efficiency. Maintenance schedules, printhead maintenance, and ribbon selection are essential considerations for industrial automation. Industrial coding solutions are evolving, with inkjet nozzle cleaning and 2D barcode generators gaining traction. High-contrast ratios and variable data printing cater to customization needs. Error detection rates are improving, with code verification systems ensuring accuracy. RFID tagging systems offer advanced tracking capabilities. The future of the market is promising, with a 19% expected increase in demand for industrial automation solutions.

    The integration of coding and marking equipment into packaging lines and the adoption of advanced technologies, such as inkjet ink formulations, will further drive growth.

    Coding And Marking Equipment Market Size

    Request Free Sample

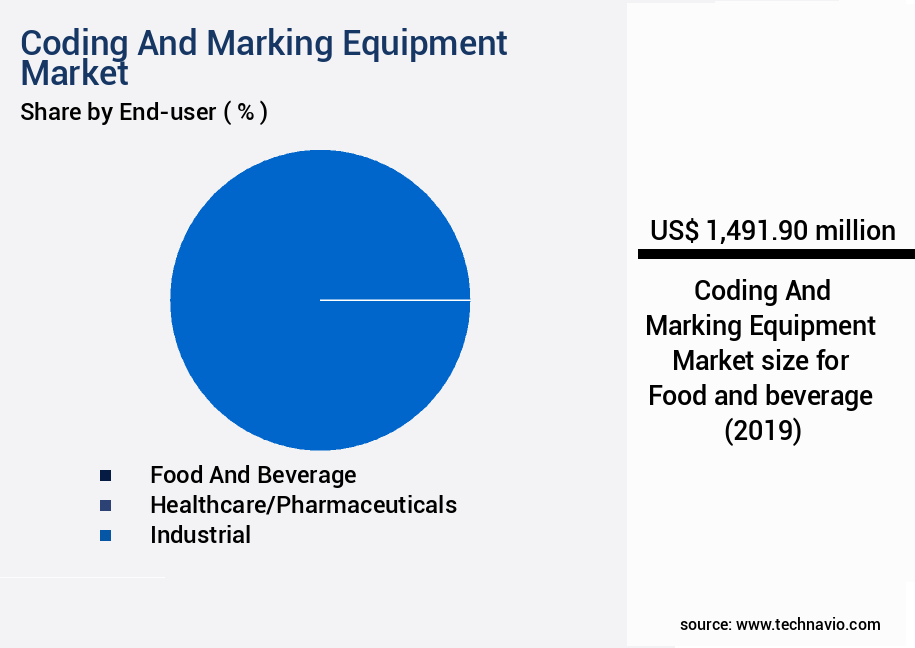
    The Food and beverage segment was valued at USD 1.49 billion in 2019 and showed a gradual increase during the forecast period.

    Coding And Marking Equipment Market Size

    Request Free Sample

    Regional Analysis

    APAC is estimated to contribute 41% to the growth of the global market during the forecast period.Technavio’s analysts have elaborately explained the regional trends and drivers that shape the market during the forecast period.

    Coding And Marking Equipment Market Share by Geography

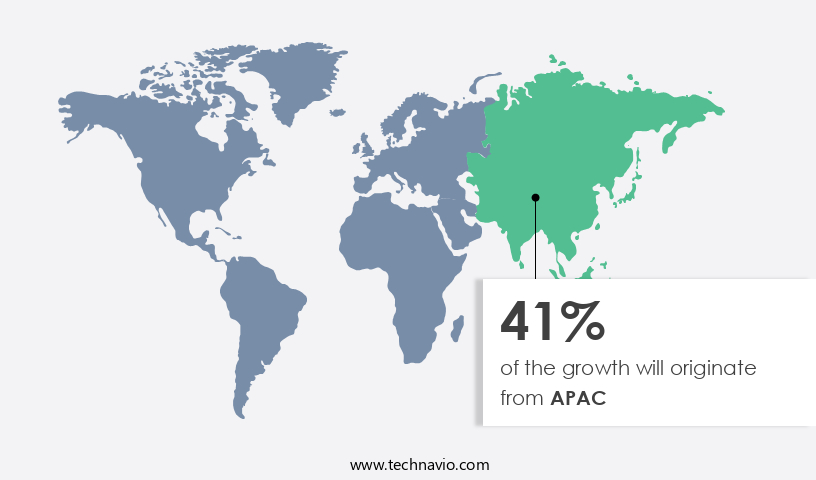
    See How Coding And Marking Equipment Market Demand is Rising in APAC Request Free Sample

    In the dynamic business landscape of the market, Asia Pacific (APAC) stands out as a region poised for significant growth. China and Japan, in particular, are identified as key contributors to this expansion. The presence of a vast number of manufacturing-focused companies in these countries, primarily in industries such as wire and cable, pharmaceuticals, food and beverages, electrical, and electronics, has fueled the demand for coding and marking equipment. China, with its well-established electrical and electronics manufacturing ecosystem, and India, with its growing food and beverage industry, have attracted numerous global companies due to their low-cost resources and increasing local demand for consumable products.

    Over the past five years, both countries have experienced substantial growth in their electronics and processed food manufacturing sectors, driven by favorable government policies.

    Market Dynamics

    Our researchers analyzed the data with 2024 as the base year, along with the key drivers, trends, and challenges. A holistic analysis of drivers will help companies refine their marketing strategies to gain a competitive advantage.

    The market is a dynamic and evolving industry, characterized by advancements in technology and increasing regulatory compliance requirements. High-speed inkjet coding system integration continues to gain traction, offering improved productivity and efficiency for manufacturers. In contrast, laser marking systems necessitate meticulous maintenance procedures to ensure optimal performance. Variable data printing plays a crucial role in pharmaceutical packaging, enabling customized product labeling and enhancing patient safety. In the food and beverage sector, automated coding systems streamline production processes and reduce downtime. To improve print quality in thermal transfer printing, best practices for inkjet printhead maintenance and nozzle clogging prevention strategies are essential.

    When selecting industrial label printers, considerations include rfid tag integration with production line systems, optimizing throughput for inkjet coding systems, and regulatory compliance for product marking standards. Advanced quality control methods, such as data matrix code generation and verification, ensure accurate and reliable marking. The 2d barcode system integration for track and trace applications is a significant trend, with more than 70% of new product developments focusing on this area. The industrial application segment accounts for a significantly larger share than the academic segment, reflecting the growing importance of industrial automation and traceability. To address the challenges of inkjet printer system diagnostics and troubleshooting, remote monitoring capabilities and operator training programs are essential.

    The selection of appropriate inkjet ink for various materials is another critical consideration, with a minority of players dominating the high-end ink market. By implementing these strategies, businesses can improve code readability on various substrates and maintain regulatory compliance while enhancing overall operational efficiency.

    Coding And Marking Equipment Market Size

    What are the key market drivers leading to the rise in the adoption of Coding And Marking Equipment Industry?

    • The escalating demand for product traceability serves as the primary catalyst for market growth. 

    • Product traceability, a crucial aspect of supply chain and logistics, is gaining significance in various sectors including food and beverage, healthcare, retail, automotive, and aerospace. This feature enables companies to maintain product quality, ensure consistency in production, and prioritize safety. Tracing products from the manufacturing stage to delivery to end customers is a vital part of the product management cycle. Authorized personnel can effortlessly monitor and track products' journeys using advanced technologies. The importance of product traceability is escalating, as businesses strive for transparency, accountability, and regulatory compliance.
    • By implementing traceability systems, organizations can swiftly respond to recalls, minimize risks, and enhance customer satisfaction. This data-driven approach offers valuable insights into production processes and supply chain efficiencies, ultimately contributing to improved operational performance and competitive advantage.

    What are the market trends shaping the Coding And Marking Equipment Industry?

    • Equipment leasing is becoming an increasingly popular business model in the market. The deployment of this model is a current trend.

    • High running costs are a significant challenge for businesses investing in coding and marking equipment. To mitigate this expense, organizations are increasingly turning to leasing options. Leasing simplifies the coding and marking process by reducing operational costs, such as maintenance, servicing, and disposal. Leasing companies provide maintenance and servicing solutions to end-users, making the process more convenient. Small and medium-sized enterprises (SMEs) are particularly drawn to this business model due to its benefits. Leasing eliminates the need for large capital investments, preserves working capital, and frees up cash flow for other business activities.
    • The leasing model offers flexibility with monthly and quarterly payment options, enabling companies to deploy printers according to their needs. Additionally, it provides line optimization, futureproof solutions, minimal downtime, and eliminates equipment depreciation concerns. This trend towards leasing reflects the evolving nature of the market, with businesses seeking cost-effective and efficient solutions.

    What challenges does the Coding And Marking Equipment Industry face during its growth?

    • The industry's growth is significantly impacted by the high operational costs, which represents a major challenge that must be addressed by professionals in the field. 

    • Coding and marking equipment is an essential investment for manufacturing industries to ensure product traceability and quality. The total cost of ownership for such equipment involves both upfront and operational expenses. Capital costs encompass the initial investment, material handling, and installation fees. Operational and running costs include consumable expenses, maintenance, spare parts, and training. For example, Continuous Ink Jet (CIJ) printers have service hours ranging from 9,000 to 15,000 hours, while laser printers have a tube life of 45,000 hours to 100,000 hours.
    • Companies must consider these costs when deciding on the most suitable coding and marking solution for their manufacturing process line. The ongoing nature of these expenses highlights the importance of selecting efficient and cost-effective equipment to minimize overall costs.

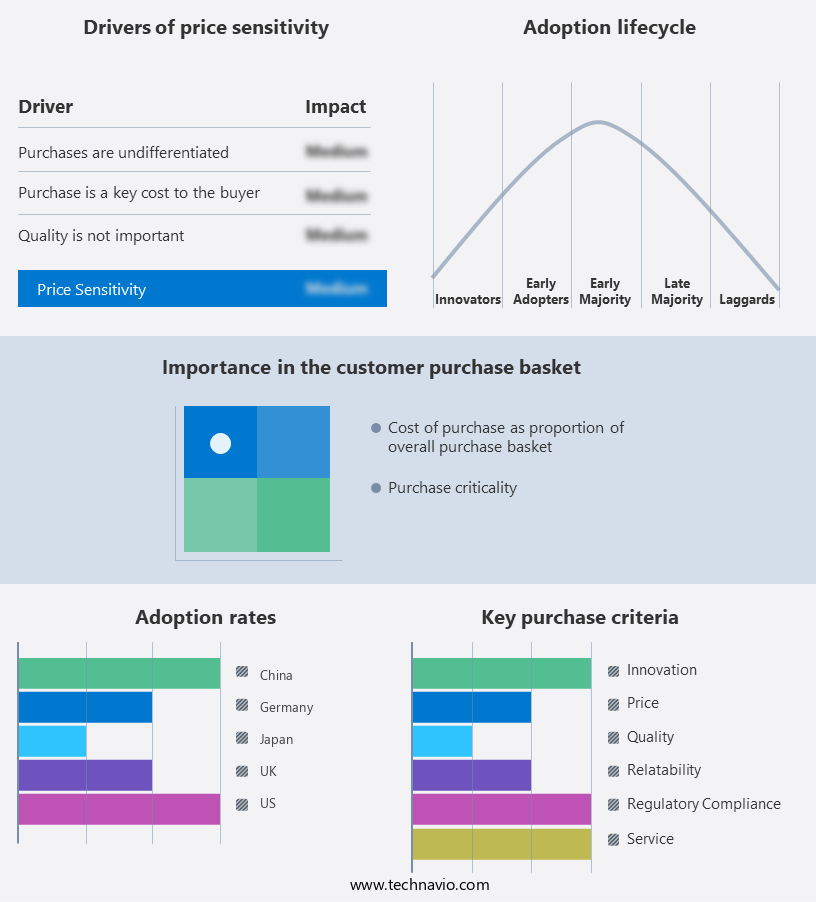
    Exclusive Technavio Analysis on Customer Landscape

    The coding and marking equipment market forecasting report includes the adoption lifecycle of the market, covering from the innovator’s stage to the laggard’s stage. It focuses on adoption rates in different regions based on penetration. Furthermore, the coding and marking equipment market report also includes key purchase criteria and drivers of price sensitivity to help companies evaluate and develop their market growth analysis strategies.

    Coding And Marking Equipment Market Share by Geography

     Customer Landscape of Coding And Marking Equipment Industry

    Competitive Landscape

    Companies are implementing various strategies, such as strategic alliances, coding and marking equipment market forecast, partnerships, mergers and acquisitions, geographical expansion, and product/service launches, to enhance their presence in the industry.

    ATD Ltd. - This company specializes in coding and marking technologies, enabling seamless integration into manufacturing processes. Real-time solutions offer date, time, and logo customization, along with a diverse selection of barcodes and 2D codes. These advanced technologies enhance production efficiency and traceability.

    The industry research and growth report includes detailed analyses of the competitive landscape of the market and information about key companies, including:

    • ATD Ltd.
    • BestCode
    • Brother Industries Ltd.
    • Danaher Corp.
    • Domino Printing Sciences PLC
    • Dover Corp.
    • Hitachi Ltd.
    • ITW Marking and Coding
    • Keyence Corp.
    • Koenig & Bauer Coding GmbH
    • Linx Printing Technologies
    • Markem-Imaje
    • Matthews International Corp.
    • Overprint Ltd.
    • Paul Leibinger GmbH and Co. KG
    • Pro Mach Inc.
    • REA Elektronik GmbH
    • Videojet Technologies

    Qualitative and quantitative analysis of companies has been conducted to help clients understand the wider business environment as well as the strengths and weaknesses of key industry players. Data is qualitatively analyzed to categorize companies as pure play, category-focused, industry-focused, and diversified; it is quantitatively analyzed to categorize companies as dominant, leading, strong, tentative, and weak.

    Recent Development and News in Coding And Marking Equipment Market

    • In January 2024, Marking Systems Inc., a leading coding and marking equipment provider, announced the launch of its new laser marking system, the MarkLase X3, which offers increased marking speed and improved precision for various industries, including automotive and electronics (Marking Systems Inc. Press release).
    • In March 2024, Schneider Electric, a global energy management and automation company, entered into a strategic partnership with Inkjet Coding Systems, a coding and marking solutions provider, to integrate their technologies and offer comprehensive solutions for industrial automation and traceability (Schneider Electric press release).
    • In May 2024, Danaher Corporation, a science and engineering company, completed the acquisition of Videojet Technologies, a global coding and marking equipment manufacturer, significantly expanding Danaher's presence in the industrial automation market and enhancing its product portfolio (Danaher Corporation press release).
    • In April 2025, the European Union approved the new Food Information Regulation, which mandates the use of advanced coding and marking technologies for food packaging to ensure traceability and consumer safety. This regulation is expected to boost the demand for coding and marking equipment in the European market (European Commission press release).

    Dive into Technavio’s robust research methodology, blending expert interviews, extensive data synthesis, and validated models for unparalleled Coding And Marking Equipment Market insights. See full methodology.

    Market Scope

    Report Coverage

    Details

    Page number

    218

    Base year

    2024

    Historic period

    2019-2023

    Forecast period

    2025-2029

    Growth momentum & CAGR

    Accelerate at a CAGR of 6.8%

    Market growth 2025-2029

    USD 1541.1 million

    Market structure

    Fragmented

    YoY growth 2024-2025(%)

    6.3

    Key countries

    China, Japan, US, Germany, UK, India, South Korea, France, Canada, Italy, USA, and Brazil

    Competitive landscape

    Leading Companies, Market Positioning of Companies, Competitive Strategies, and Industry Risks

    Request Free Sample

    Research Analyst Overview

    • In the dynamic and evolving landscape of coding and marking equipment, various technologies continue to shape the industry. Thermal transfer printers and barcode label printers dominate the market, with their ability to produce high-quality, durable codes. Industrial automation is a significant driver, integrating packaging lines and optimizing throughput. Label applicators and 2D barcode generators have gained traction, enabling advanced data matrix coding and variable data printing. Contrast ratio and marking speed are essential factors, with the former ensuring code readability and the latter enhancing production line efficiency. Laser marking systems and inkjet coding technology offer alternatives, each with unique advantages.
    • Laser marking systems provide high-resolution coding and are suitable for various materials, while inkjet coding technology offers flexibility with inkjet ink formulations and code verification systems. Maintenance schedules, printhead maintenance, and ribbon selection are crucial aspects of ensuring system uptime. Regulatory compliance is a constant consideration, with RFID tagging systems offering solutions for tracking and traceability. Industrial coding solutions continue to evolve, with innovation in inkjet nozzle cleaning, inkjet coding technology, and code verification systems. Error detection rates and production line efficiency are key performance indicators, driving ongoing improvements in the market. Market activities unfold as businesses adopt these technologies to meet evolving industry demands, with the focus on enhancing efficiency, improving quality, and ensuring regulatory compliance.
    • The market is a vibrant and continually unfolding ecosystem, reflecting the dynamic nature of modern business operations.

    What are the Key Data Covered in this Coding And Marking Equipment Market Research and Growth Report?

    • What is the expected growth of the Coding And Marking Equipment Market between 2025 and 2029?

      • USD 1.54 billion, at a CAGR of 6.8%

    • What segmentation does the market report cover?

      • The report is segmented by End-user (Food and beverage, Healthcare/Pharmaceuticals, Industrial, and Others), Product (Continuous Inkjet (CIJ) printing and coding, Laser coding and marking, Thermal Inkjet (TIJ) Printing, Drop on Demand (DOD) Printing, Thermal Transfer Overprinting (TTO), and Others), Geography (APAC, Europe, North America, Middle East and Africa, South America, and Rest of World (ROW)), Technology (Inkjet Printing, Laser Printing, and Thermal Transfer), and Application (Primary Packaging, Secondary Packaging, and Tertiary Packaging)

    • Which regions are analyzed in the report?

      • APAC, Europe, North America, Middle East and Africa, and South America

    • What are the key growth drivers and market challenges?

      • Increasing need for product traceability, High operational costs

    • Who are the major players in the Coding And Marking Equipment Market?

      • ATD Ltd., BestCode, Brother Industries Ltd., Danaher Corp., Domino Printing Sciences PLC, Dover Corp., Hitachi Ltd., ITW Marking and Coding, Keyence Corp., Koenig & Bauer Coding GmbH, Linx Printing Technologies, Markem-Imaje, Matthews International Corp., Overprint Ltd., Paul Leibinger GmbH and Co. KG, Pro Mach Inc., REA Elektronik GmbH, and Videojet Technologies

    Market Research Insights

    • The market encompasses a range of technologies, including ink circulation systems, UV inkjet printing, material surface treatment, continuous inkjet printers, inkjet printheads, CO2 laser marking, and thermal inkjet printers. According to industry estimates, the market for UV inkjet printing is projected to grow at a significant rate due to its ability to produce high-quality codes on various materials. In contrast, CO2 laser marking is preferred for its ability to mark on a wide range of materials, including metals and plastics, but requires more frequent maintenance, with an average of 10 cleaning cycles per week. Moreover, advancements in sensor integration, remote monitoring, print resolution, and system diagnostics have led to a reduction in downtime and improved code legibility, density, and image clarity.
    • For instance, continuous inkjet printers with drop-on-demand inkjet technology offer higher print resolution and lower maintenance costs compared to traditional thermal inkjet printers. Similarly, fiber laser marking provides superior contrast levels, while pneumatic marking systems offer cost-effective solutions for marking large surfaces. Overall, the market continues to evolve, with ongoing advancements in technology driving increased production throughput and efficiency for industries reliant on industrial control systems and packaging lines.

    We can help! Our analysts can customize this coding and marking equipment market research report to meet your requirements.

    Get in touch

    1 Executive Summary

    • 1.1 Market overview
      • Executive Summary - Chart on Market Overview
      • Executive Summary - Data Table on Market Overview
      • Executive Summary - Chart on Global Market Characteristics
      • Executive Summary - Chart on Market by Geography
      • Executive Summary - Chart on Market Segmentation by End-user
      • Executive Summary - Chart on Market Segmentation by Product
      • Executive Summary - Chart on Incremental Growth
      • Executive Summary - Data Table on Incremental Growth
      • Executive Summary - Chart on Company Market Positioning

    2 Technavio Analysis

    • 2.1 Analysis of price sensitivity, lifecycle, customer purchase basket, adoption rates, and purchase criteria
      • Analysis of price sensitivity, lifecycle, customer purchase basket, adoption rates, and purchase criteria
    • 2.2 Criticality of inputs and Factors of differentiation
      • Overview on criticality of inputs and factors of differentiation
    • 2.3 Factors of disruption
      • Overview on factors of disruption
    • 2.4 Impact of drivers and challenges
      • Impact of drivers and challenges in 2024 and 2029

    3 Market Landscape

    • 3.1 Market ecosystem
      • Parent Market
      • Data Table on - Parent Market
    • 3.2 Market characteristics
      • Market characteristics analysis
    • 3.3 Value chain analysis
      • Value chain analysis

    4 Market Sizing

    • 4.1 Market definition
      • Offerings of companies included in the market definition
    • 4.2 Market segment analysis
      • Market segments
    • 4.3 Market size 2024
      • 4.4 Market outlook: Forecast for 2024-2029
        • Chart on Global - Market size and forecast 2024-2029 ($ million)
        • Data Table on Global - Market size and forecast 2024-2029 ($ million)
        • Chart on Global Market: Year-over-year growth 2024-2029 (%)
        • Data Table on Global Market: Year-over-year growth 2024-2029 (%)

      5 Historic Market Size

      • 5.1 Global Coding And Marking Equipment Market 2019 - 2023
        • Historic Market Size - Data Table on Global Coding And Marking Equipment Market 2019 - 2023 ($ million)
      • 5.2 End-user segment analysis 2019 - 2023
        • Historic Market Size - End-user Segment 2019 - 2023 ($ million)
      • 5.3 Product segment analysis 2019 - 2023
        • Historic Market Size - Product Segment 2019 - 2023 ($ million)
      • 5.4 Geography segment analysis 2019 - 2023
        • Historic Market Size - Geography Segment 2019 - 2023 ($ million)
      • 5.5 Country segment analysis 2019 - 2023
        • Historic Market Size - Country Segment 2019 - 2023 ($ million)

      6 Qualitative Analysis

      • 6.1 Impact of AI in global coding and marking equipment market

        7 Five Forces Analysis

        • 7.1 Five forces summary
          • Five forces analysis - Comparison between 2024 and 2029
        • 7.2 Bargaining power of buyers
          • Bargaining power of buyers - Impact of key factors 2024 and 2029
        • 7.3 Bargaining power of suppliers
          • Bargaining power of suppliers - Impact of key factors in 2024 and 2029
        • 7.4 Threat of new entrants
          • Threat of new entrants - Impact of key factors in 2024 and 2029
        • 7.5 Threat of substitutes
          • Threat of substitutes - Impact of key factors in 2024 and 2029
        • 7.6 Threat of rivalry
          • Threat of rivalry - Impact of key factors in 2024 and 2029
        • 7.7 Market condition
          • Chart on Market condition - Five forces 2024 and 2029

        8 Market Segmentation by End-user

        • 8.1 Market segments
          • Chart on End-user - Market share (2024-2029) (%)
          • Data Table on End-user - Market share (2024-2029) (%)
        • 8.2 Comparison by End-user
          • Chart on Comparison by End-user
          • Data Table on Comparison by End-user
        • 8.3 Food and beverage - Market size and forecast (2024-2029)
          • Chart on Food and beverage - Market size and forecast (2024-2029) ($ million)
          • Data Table on Food and beverage - Market size and forecast (2024-2029) ($ million)
          • Chart on Food and beverage - Year-over-year growth (2024-2029) (%)
          • Data Table on Food and beverage - Year-over-year growth (2024-2029) (%)
        • 8.4 Healthcare/Pharmaceuticals - Market size and forecast (2024-2029)
          • Chart on Healthcare/Pharmaceuticals - Market size and forecast (2024-2029) ($ million)
          • Data Table on Healthcare/Pharmaceuticals - Market size and forecast (2024-2029) ($ million)
          • Chart on Healthcare/Pharmaceuticals - Year-over-year growth (2024-2029) (%)
          • Data Table on Healthcare/Pharmaceuticals - Year-over-year growth (2024-2029) (%)
        • 8.5 Industrial - Market size and forecast (2024-2029)
          • Chart on Industrial - Market size and forecast (2024-2029) ($ million)
          • Data Table on Industrial - Market size and forecast (2024-2029) ($ million)
          • Chart on Industrial - Year-over-year growth (2024-2029) (%)
          • Data Table on Industrial - Year-over-year growth (2024-2029) (%)
        • 8.6 Others - Market size and forecast (2024-2029)
          • Chart on Others - Market size and forecast (2024-2029) ($ million)
          • Data Table on Others - Market size and forecast (2024-2029) ($ million)
          • Chart on Others - Year-over-year growth (2024-2029) (%)
          • Data Table on Others - Year-over-year growth (2024-2029) (%)
        • 8.7 Market opportunity by End-user
          • Market opportunity by End-user ($ million)
          • Data Table on Market opportunity by End-user ($ million)

        9 Market Segmentation by Product

        • 9.1 Market segments
          • Chart on Product - Market share (2024-2029) (%)
          • Data Table on Product - Market share (2024-2029) (%)
        • 9.2 Comparison by Product
          • Chart on Comparison by Product
          • Data Table on Comparison by Product
        • 9.3 Continuous Inkjet (CIJ) printing and coding - Market size and forecast (2024-2029)
          • Chart on Continuous Inkjet (CIJ) printing and coding - Market size and forecast (2024-2029) ($ million)
          • Data Table on Continuous Inkjet (CIJ) printing and coding - Market size and forecast (2024-2029) ($ million)
          • Chart on Continuous Inkjet (CIJ) printing and coding - Year-over-year growth (2024-2029) (%)
          • Data Table on Continuous Inkjet (CIJ) printing and coding - Year-over-year growth (2024-2029) (%)
        • 9.4 Laser coding and marking - Market size and forecast (2024-2029)
          • Chart on Laser coding and marking - Market size and forecast (2024-2029) ($ million)
          • Data Table on Laser coding and marking - Market size and forecast (2024-2029) ($ million)
          • Chart on Laser coding and marking - Year-over-year growth (2024-2029) (%)
          • Data Table on Laser coding and marking - Year-over-year growth (2024-2029) (%)
        • 9.5 Thermal Inkjet (TIJ) Printing - Market size and forecast (2024-2029)
          • Chart on Thermal Inkjet (TIJ) Printing - Market size and forecast (2024-2029) ($ million)
          • Data Table on Thermal Inkjet (TIJ) Printing - Market size and forecast (2024-2029) ($ million)
          • Chart on Thermal Inkjet (TIJ) Printing - Year-over-year growth (2024-2029) (%)
          • Data Table on Thermal Inkjet (TIJ) Printing - Year-over-year growth (2024-2029) (%)
        • 9.6 Drop on Demand (DOD) Printing - Market size and forecast (2024-2029)
          • Chart on Drop on Demand (DOD) Printing - Market size and forecast (2024-2029) ($ million)
          • Data Table on Drop on Demand (DOD) Printing - Market size and forecast (2024-2029) ($ million)
          • Chart on Drop on Demand (DOD) Printing - Year-over-year growth (2024-2029) (%)
          • Data Table on Drop on Demand (DOD) Printing - Year-over-year growth (2024-2029) (%)
        • 9.7 Thermal Transfer Overprinting (TTO) - Market size and forecast (2024-2029)
          • Chart on Thermal Transfer Overprinting (TTO) - Market size and forecast (2024-2029) ($ million)
          • Data Table on Thermal Transfer Overprinting (TTO) - Market size and forecast (2024-2029) ($ million)
          • Chart on Thermal Transfer Overprinting (TTO) - Year-over-year growth (2024-2029) (%)
          • Data Table on Thermal Transfer Overprinting (TTO) - Year-over-year growth (2024-2029) (%)
        • 9.8 Others - Market size and forecast (2024-2029)
          • Chart on Others - Market size and forecast (2024-2029) ($ million)
          • Data Table on Others - Market size and forecast (2024-2029) ($ million)
          • Chart on Others - Year-over-year growth (2024-2029) (%)
          • Data Table on Others - Year-over-year growth (2024-2029) (%)
        • 9.9 Market opportunity by Product
          • Market opportunity by Product ($ million)
          • Data Table on Market opportunity by Product ($ million)

        10 Market Segmentation by Technology

        • 10.1 Market segments
          • Chart on Technology - Market share (2024-2029) (%)
          • Data Table on Technology - Market share (2024-2029) (%)
        • 10.2 Comparison by Technology
          • Chart on Comparison by Technology
          • Data Table on Comparison by Technology
        • 10.3 Inkjet Printing - Market size and forecast (2024-2029)
          • Chart on Inkjet Printing - Market size and forecast (2024-2029) ($ million)
          • Data Table on Inkjet Printing - Market size and forecast (2024-2029) ($ million)
          • Chart on Inkjet Printing - Year-over-year growth (2024-2029) (%)
          • Data Table on Inkjet Printing - Year-over-year growth (2024-2029) (%)
        • 10.4 Laser Printing - Market size and forecast (2024-2029)
          • Chart on Laser Printing - Market size and forecast (2024-2029) ($ million)
          • Data Table on Laser Printing - Market size and forecast (2024-2029) ($ million)
          • Chart on Laser Printing - Year-over-year growth (2024-2029) (%)
          • Data Table on Laser Printing - Year-over-year growth (2024-2029) (%)
        • 10.5 Thermal Transfer - Market size and forecast (2024-2029)
          • Chart on Thermal Transfer - Market size and forecast (2024-2029) ($ million)
          • Data Table on Thermal Transfer - Market size and forecast (2024-2029) ($ million)
          • Chart on Thermal Transfer - Year-over-year growth (2024-2029) (%)
          • Data Table on Thermal Transfer - Year-over-year growth (2024-2029) (%)
        • 10.6 Market opportunity by Technology
          • Market opportunity by Technology ($ million)
          • Data Table on Market opportunity by Technology ($ million)

        11 Market Segmentation by Application

        • 11.1 Market segments
          • Chart on Application - Market share (2024-2029) (%)
          • Data Table on Application - Market share (2024-2029) (%)
        • 11.2 Comparison by Application
          • Chart on Comparison by Application
          • Data Table on Comparison by Application
        • 11.3 Primary Packaging - Market size and forecast (2024-2029)
          • Chart on Primary Packaging - Market size and forecast (2024-2029) ($ million)
          • Data Table on Primary Packaging - Market size and forecast (2024-2029) ($ million)
          • Chart on Primary Packaging - Year-over-year growth (2024-2029) (%)
          • Data Table on Primary Packaging - Year-over-year growth (2024-2029) (%)
        • 11.4 Secondary Packaging - Market size and forecast (2024-2029)
          • Chart on Secondary Packaging - Market size and forecast (2024-2029) ($ million)
          • Data Table on Secondary Packaging - Market size and forecast (2024-2029) ($ million)
          • Chart on Secondary Packaging - Year-over-year growth (2024-2029) (%)
          • Data Table on Secondary Packaging - Year-over-year growth (2024-2029) (%)
        • 11.5 Tertiary Packaging - Market size and forecast (2024-2029)
          • Chart on Tertiary Packaging - Market size and forecast (2024-2029) ($ million)
          • Data Table on Tertiary Packaging - Market size and forecast (2024-2029) ($ million)
          • Chart on Tertiary Packaging - Year-over-year growth (2024-2029) (%)
          • Data Table on Tertiary Packaging - Year-over-year growth (2024-2029) (%)
        • 11.6 Market opportunity by Application
          • Market opportunity by Application ($ million)
          • Data Table on Market opportunity by Application ($ million)

        12 Customer Landscape

        • 12.1 Customer landscape overview
          • Analysis of price sensitivity, lifecycle, customer purchase basket, adoption rates, and purchase criteria

        13 Geographic Landscape

        • 13.1 Geographic segmentation
          • Chart on Market share by geography 2024-2029 (%)
          • Data Table on Market share by geography 2024-2029 (%)
        • 13.2 Geographic comparison
          • Chart on Geographic comparison
          • Data Table on Geographic comparison
        • 13.3 APAC - Market size and forecast 2024-2029
          • Chart on APAC - Market size and forecast 2024-2029 ($ million)
          • Data Table on APAC - Market size and forecast 2024-2029 ($ million)
          • Chart on APAC - Year-over-year growth 2024-2029 (%)
          • Data Table on APAC - Year-over-year growth 2024-2029 (%)
        • 13.4 Europe - Market size and forecast 2024-2029
          • Chart on Europe - Market size and forecast 2024-2029 ($ million)
          • Data Table on Europe - Market size and forecast 2024-2029 ($ million)
          • Chart on Europe - Year-over-year growth 2024-2029 (%)
          • Data Table on Europe - Year-over-year growth 2024-2029 (%)
        • 13.5 North America - Market size and forecast 2024-2029
          • Chart on North America - Market size and forecast 2024-2029 ($ million)
          • Data Table on North America - Market size and forecast 2024-2029 ($ million)
          • Chart on North America - Year-over-year growth 2024-2029 (%)
          • Data Table on North America - Year-over-year growth 2024-2029 (%)
        • 13.6 Middle East and Africa - Market size and forecast 2024-2029
          • Chart on Middle East and Africa - Market size and forecast 2024-2029 ($ million)
          • Data Table on Middle East and Africa - Market size and forecast 2024-2029 ($ million)
          • Chart on Middle East and Africa - Year-over-year growth 2024-2029 (%)
          • Data Table on Middle East and Africa - Year-over-year growth 2024-2029 (%)
        • 13.7 South America - Market size and forecast 2024-2029
          • Chart on South America - Market size and forecast 2024-2029 ($ million)
          • Data Table on South America - Market size and forecast 2024-2029 ($ million)
          • Chart on South America - Year-over-year growth 2024-2029 (%)
          • Data Table on South America - Year-over-year growth 2024-2029 (%)
        • 13.8 China - Market size and forecast 2024-2029
          • Chart on China - Market size and forecast 2024-2029 ($ million)
          • Data Table on China - Market size and forecast 2024-2029 ($ million)
          • Chart on China - Year-over-year growth 2024-2029 (%)
          • Data Table on China - Year-over-year growth 2024-2029 (%)
        • 13.9 Japan - Market size and forecast 2024-2029
          • Chart on Japan - Market size and forecast 2024-2029 ($ million)
          • Data Table on Japan - Market size and forecast 2024-2029 ($ million)
          • Chart on Japan - Year-over-year growth 2024-2029 (%)
          • Data Table on Japan - Year-over-year growth 2024-2029 (%)
        • 13.10 US - Market size and forecast 2024-2029
          • Chart on US - Market size and forecast 2024-2029 ($ million)
          • Data Table on US - Market size and forecast 2024-2029 ($ million)
          • Chart on US - Year-over-year growth 2024-2029 (%)
          • Data Table on US - Year-over-year growth 2024-2029 (%)
        • 13.11 Germany - Market size and forecast 2024-2029
          • Chart on Germany - Market size and forecast 2024-2029 ($ million)
          • Data Table on Germany - Market size and forecast 2024-2029 ($ million)
          • Chart on Germany - Year-over-year growth 2024-2029 (%)
          • Data Table on Germany - Year-over-year growth 2024-2029 (%)
        • 13.12 UK - Market size and forecast 2024-2029
          • Chart on UK - Market size and forecast 2024-2029 ($ million)
          • Data Table on UK - Market size and forecast 2024-2029 ($ million)
          • Chart on UK - Year-over-year growth 2024-2029 (%)
          • Data Table on UK - Year-over-year growth 2024-2029 (%)
        • 13.13 India - Market size and forecast 2024-2029
          • Chart on India - Market size and forecast 2024-2029 ($ million)
          • Data Table on India - Market size and forecast 2024-2029 ($ million)
          • Chart on India - Year-over-year growth 2024-2029 (%)
          • Data Table on India - Year-over-year growth 2024-2029 (%)
        • 13.14 South Korea - Market size and forecast 2024-2029
          • Chart on South Korea - Market size and forecast 2024-2029 ($ million)
          • Data Table on South Korea - Market size and forecast 2024-2029 ($ million)
          • Chart on South Korea - Year-over-year growth 2024-2029 (%)
          • Data Table on South Korea - Year-over-year growth 2024-2029 (%)
        • 13.15 France - Market size and forecast 2024-2029
          • Chart on France - Market size and forecast 2024-2029 ($ million)
          • Data Table on France - Market size and forecast 2024-2029 ($ million)
          • Chart on France - Year-over-year growth 2024-2029 (%)
          • Data Table on France - Year-over-year growth 2024-2029 (%)
        • 13.16 Canada - Market size and forecast 2024-2029
          • Chart on Canada - Market size and forecast 2024-2029 ($ million)
          • Data Table on Canada - Market size and forecast 2024-2029 ($ million)
          • Chart on Canada - Year-over-year growth 2024-2029 (%)
          • Data Table on Canada - Year-over-year growth 2024-2029 (%)
        • 13.17 Italy - Market size and forecast 2024-2029
          • Chart on Italy - Market size and forecast 2024-2029 ($ million)
          • Data Table on Italy - Market size and forecast 2024-2029 ($ million)
          • Chart on Italy - Year-over-year growth 2024-2029 (%)
          • Data Table on Italy - Year-over-year growth 2024-2029 (%)
        • 13.18 Market opportunity by geography
          • Market opportunity by geography ($ million)
          • Data Tables on Market opportunity by geography ($ million)
        • 13.19 USA - Market size and forecast (2024-2029)
          • Chart on USA - Market size and forecast (2024-2029) ($ million)
          • Data Table on USA - Market size and forecast (2024-2029) ($ million)
          • Chart on USA - Year-over-year growth (2024-2029) (%)
          • Data Table on USA - Year-over-year growth (2024-2029) (%)
        • 13.20 Brazil - Market size and forecast (2024-2029)
          • Chart on Brazil - Market size and forecast (2024-2029) ($ million)
          • Data Table on Brazil - Market size and forecast (2024-2029) ($ million)
          • Chart on Brazil - Year-over-year growth (2024-2029) (%)
          • Data Table on Brazil - Year-over-year growth (2024-2029) (%)
        • 13.21 Rest of World (ROW) - Market size and forecast (2024-2029)
          • Chart on Rest of World (ROW) - Market size and forecast (2024-2029) ($ million)
          • Data Table on Rest of World (ROW) - Market size and forecast (2024-2029) ($ million)
          • Chart on Rest of World (ROW) - Year-over-year growth (2024-2029) (%)
          • Data Table on Rest of World (ROW) - Year-over-year growth (2024-2029) (%)

        14 Drivers, Challenges, and Opportunity/Restraints

        • 14.1 Market drivers
          • 14.2 Market challenges
            • 14.3 Impact of drivers and challenges
              • Impact of drivers and challenges in 2024 and 2029
            • 14.4 Market opportunities/restraints

              15 Competitive Landscape

              • 15.1 Overview
                • 15.2 Competitive Landscape
                  • Overview on criticality of inputs and factors of differentiation
                • 15.3 Landscape disruption
                  • Overview on factors of disruption
                • 15.4 Industry risks
                  • Impact of key risks on business

                16 Competitive Analysis

                • 16.1 Companies profiled
                  • Companies covered
                • 16.2 Market positioning of companies
                  • Matrix on companies position and classification
                • 16.3 ATD Ltd.
                  • ATD Ltd. - Overview
                  • ATD Ltd. - Product / Service
                  • ATD Ltd. - Key offerings
                • 16.4 BestCode
                  • BestCode - Overview
                  • BestCode - Product / Service
                  • BestCode - Key offerings
                • 16.5 Brother Industries Ltd.
                  • Brother Industries Ltd. - Overview
                  • Brother Industries Ltd. - Product / Service
                  • Brother Industries Ltd. - Key offerings
                • 16.6 Danaher Corp.
                  • Danaher Corp. - Overview
                  • Danaher Corp. - Product / Service
                  • Danaher Corp. - Key offerings
                • 16.7 Domino Printing Sciences PLC
                  • Domino Printing Sciences PLC - Overview
                  • Domino Printing Sciences PLC - Product / Service
                  • Domino Printing Sciences PLC - Key offerings
                • 16.8 Dover Corp.
                  • Dover Corp. - Overview
                  • Dover Corp. - Product / Service
                  • Dover Corp. - Key offerings
                • 16.9 Hitachi Ltd.
                  • Hitachi Ltd. - Overview
                  • Hitachi Ltd. - Product / Service
                  • Hitachi Ltd. - Key offerings
                • 16.10 ITW Marking and Coding
                  • ITW Marking and Coding - Overview
                  • ITW Marking and Coding - Product / Service
                  • ITW Marking and Coding - Key offerings
                • 16.11 Keyence Corp.
                  • Keyence Corp. - Overview
                  • Keyence Corp. - Product / Service
                  • Keyence Corp. - Key offerings
                • 16.12 Koenig & Bauer Coding GmbH
                  • Koenig & Bauer Coding GmbH - Overview
                  • Koenig & Bauer Coding GmbH - Product / Service
                  • Koenig & Bauer Coding GmbH - Key offerings
                • 16.13 Linx Printing Technologies
                  • Linx Printing Technologies - Overview
                  • Linx Printing Technologies - Product / Service
                  • Linx Printing Technologies - Key offerings
                • 16.14 Markem-Imaje
                  • Markem-Imaje - Overview
                  • Markem-Imaje - Product / Service
                  • Markem-Imaje - Key offerings
                • 16.15 Matthews International Corp.
                  • Matthews International Corp. - Overview
                  • Matthews International Corp. - Product / Service
                  • Matthews International Corp. - Key offerings
                • 16.16 Overprint Ltd.
                  • Overprint Ltd. - Overview
                  • Overprint Ltd. - Product / Service
                  • Overprint Ltd. - Key offerings
                • 16.17 Paul Leibinger GmbH and Co. KG
                  • Paul Leibinger GmbH and Co. KG - Overview
                  • Paul Leibinger GmbH and Co. KG - Product / Service
                  • Paul Leibinger GmbH and Co. KG - Key offerings
                • 16.18 Pro Mach Inc.
                  • Pro Mach Inc. - Overview
                  • Pro Mach Inc. - Product / Service
                  • Pro Mach Inc. - Key offerings
                • 16.19 REA Elektronik GmbH
                  • REA Elektronik GmbH - Overview
                  • REA Elektronik GmbH - Product / Service
                  • REA Elektronik GmbH - Key offerings
                • 16.20 Videojet Technologies
                  • Videojet Technologies - Overview
                  • Videojet Technologies - Product / Service
                  • Videojet Technologies - Key offerings
                • 16.21 ATD Ltd.
                  • ATD Ltd. - Overview
                  • ATD Ltd. - Product / Service
                  • ATD Ltd. - Key offerings
                • 16.22 BestCode
                  • BestCode - Overview
                  • BestCode - Product / Service
                  • BestCode - Key offerings
                • 16.23 Brother Industries Ltd.
                  • Brother Industries Ltd. - Overview
                  • Brother Industries Ltd. - Product / Service
                  • Brother Industries Ltd. - Key offerings
                • 16.24 Danaher Corp.
                  • Danaher Corp. - Overview
                  • Danaher Corp. - Product / Service
                  • Danaher Corp. - Key offerings
                • 16.25 Domino Printing Sciences PLC
                  • Domino Printing Sciences PLC - Overview
                  • Domino Printing Sciences PLC - Product / Service
                  • Domino Printing Sciences PLC - Key offerings
                • 16.26 Dover Corp.
                  • Dover Corp. - Overview
                  • Dover Corp. - Product / Service
                  • Dover Corp. - Key offerings
                • 16.27 Hitachi Ltd.
                  • Hitachi Ltd. - Overview
                  • Hitachi Ltd. - Product / Service
                  • Hitachi Ltd. - Key offerings
                • 16.28 ITW Marking and Coding
                  • ITW Marking and Coding - Overview
                  • ITW Marking and Coding - Product / Service
                  • ITW Marking and Coding - Key offerings
                • 16.29 Keyence Corp.
                  • Keyence Corp. - Overview
                  • Keyence Corp. - Product / Service
                  • Keyence Corp. - Key offerings
                • 16.30 Koenig & Bauer Coding GmbH
                  • Koenig & Bauer Coding GmbH - Overview
                  • Koenig & Bauer Coding GmbH - Product / Service
                  • Koenig & Bauer Coding GmbH - Key offerings
                • 16.31 Linx Printing Technologies
                  • Linx Printing Technologies - Overview
                  • Linx Printing Technologies - Product / Service
                  • Linx Printing Technologies - Key offerings
                • 16.32 Markem-Imaje
                  • Markem-Imaje - Overview
                  • Markem-Imaje - Product / Service
                  • Markem-Imaje - Key offerings
                • 16.33 Matthews International Corp.
                  • Matthews International Corp. - Overview
                  • Matthews International Corp. - Product / Service
                  • Matthews International Corp. - Key offerings
                • 16.34 MULTIVAC Sepp Haggenmuller SE and Co. KG
                  • MULTIVAC Sepp Haggenmuller SE and Co. KG - Overview
                  • MULTIVAC Sepp Haggenmuller SE and Co. KG - Product / Service
                  • MULTIVAC Sepp Haggenmuller SE and Co. KG - Key offerings
                • 16.35 Overprint Ltd.
                  • Overprint Ltd. - Overview
                  • Overprint Ltd. - Product / Service
                  • Overprint Ltd. - Key offerings
                • 16.36 Paul Leibinger GmbH and Co. KG
                  • Paul Leibinger GmbH and Co. KG - Overview
                  • Paul Leibinger GmbH and Co. KG - Product / Service
                  • Paul Leibinger GmbH and Co. KG - Key offerings
                • 16.37 Pro Mach Inc.
                  • Pro Mach Inc. - Overview
                  • Pro Mach Inc. - Product / Service
                  • Pro Mach Inc. - Key offerings
                • 16.38 REA Elektronik GmbH
                  • REA Elektronik GmbH - Overview
                  • REA Elektronik GmbH - Product / Service
                  • REA Elektronik GmbH - Key offerings
                • 16.39 SATO Holdings Corp.
                  • SATO Holdings Corp. - Overview
                  • SATO Holdings Corp. - Product / Service
                  • SATO Holdings Corp. - Key offerings
                • 16.40 Videojet Technologies
                  • Videojet Technologies - Overview
                  • Videojet Technologies - Product / Service
                  • Videojet Technologies - Key offerings

                17 Appendix

                • 17.1 Scope of the report
                  • 17.2 Inclusions and exclusions checklist
                    • Inclusions checklist
                    • Exclusions checklist
                  • 17.3 Currency conversion rates for US$
                    • Currency conversion rates for US$
                  • 17.4 Research methodology
                    • Research methodology
                  • 17.5 Data procurement
                    • Information sources
                  • 17.6 Data validation
                    • Data validation
                  • 17.7 Validation techniques employed for market sizing
                    • Validation techniques employed for market sizing
                  • 17.8 Data synthesis
                    • Data synthesis
                  • 17.9 360 degree market analysis
                    • 360 degree market analysis
                  • 17.10 List of abbreviations
                    • List of abbreviations

                  Research Methodology

                  Technavio presents a detailed picture of the market by way of study, synthesis, and summation of data from multiple sources. The analysts have presented the various facets of the market with a particular focus on identifying the key industry influencers. The data thus presented is comprehensive, reliable, and the result of extensive research, both primary and secondary.

                  INFORMATION SOURCES

                  Primary sources

                  • Manufacturers and suppliers
                  • Channel partners
                  • Industry experts
                  • Strategic decision makers

                  Secondary sources

                  • Industry journals and periodicals
                  • Government data
                  • Financial reports of key industry players
                  • Historical data
                  • Press releases

                  DATA ANALYSIS

                  Data Synthesis

                  • Collation of data
                  • Estimation of key figures
                  • Analysis of derived insights

                  Data Validation

                  • Triangulation with data models
                  • Reference against proprietary databases
                  • Corroboration with industry experts

                  REPORT WRITING

                  Qualitative

                  • Market drivers
                  • Market challenges
                  • Market trends
                  • Five forces analysis

                  Quantitative

                  • Market size and forecast
                  • Market segmentation
                  • Geographical insights
                  • Competitive landscape

                  Interested in this report?

                  Get your sample now to see our research methodology and insights!

                  Download Now

                  Frequently Asked Questions

                  Coding And Marking Equipment market growth will increase by $ 1541.1 mn during 2025-2029.

                  The Coding And Marking Equipment market is expected to grow at a CAGR of 6.8% during 2025-2029.

                  Coding And Marking Equipment market is segmented by End-user( Food and beverage, Healthcare/Pharmaceuticals, Industrial, Others, Others) Product( Continuous Inkjet (CIJ) printing and coding, Laser coding and marking, Thermal Inkjet (TIJ) Printing, Drop on Demand (DOD) Printing, Thermal Transfer Overprinting (TTO))

                  ATD Ltd., BestCode, Brother Industries Ltd., Danaher Corp., Domino Printing Sciences PLC, Dover Corp., Hitachi Ltd., ITW Marking and Coding, Keyence Corp., Koenig & Bauer Coding GmbH, Linx Printing Technologies, Markem-Imaje, Matthews International Corp., Overprint Ltd., Paul Leibinger GmbH and Co. KG, Pro Mach Inc., REA Elektronik GmbH, Videojet Technologies are a few of the key vendors in the Coding And Marking Equipment market.

                  APAC will register the highest growth rate of 41% among the other regions. Therefore, the Coding And Marking Equipment market in APAC is expected to garner significant business opportunities for the vendors during the forecast period.

                  China, Japan, US, Germany, UK, India, South Korea, France, Canada, Italy, USA, Brazil, Rest of World (ROW)

                  • Increasing need for product traceabilityProduct traceability is the driving factor this market.
                  • which refers to the ability to track and trace the journey of a product is the driving factor this market.
                  • is one of the most important features in supply chain and logistics operations is the driving factor this market.
                  • especially in industries such as food and beverage is the driving factor this market.
                  • healthcare is the driving factor this market.
                  • retail is the driving factor this market.
                  • automotive is the driving factor this market.
                  • and aerospace. The need to trace products is increasing as companies are focusing on ensuring product quality control is the driving factor this market.
                  • consistency in production is the driving factor this market.
                  • and product safety. Tracing is becoming an essential part of the product management cycle as it enables manufacturers to track and trace products when required. Authorized personnel in logistics departments can easily track and trace products from the manufacturing stage to the time of delivery to end customers. Traceability of products helps manufacturing companies match replacement parts is the driving factor this market.
                  • track products is the driving factor this market.
                  • and quickly recall products.Packaging companies are integrating technologies such as barcodes is the driving factor this market.
                  • RFID is the driving factor this market.
                  • QR codes is the driving factor this market.
                  • and Data Matrix codes for tracking and tracing products. RFID technology provides product traceability information to companies by collecting data from the products and sending them to the central database of companies through an IP network. Packaging companies use QR codes to provide information such as the condition of the product is the driving factor this market.
                  • manufacturing date is the driving factor this market.
                  • and usage. QR codes provide high traceability and accurate data related to delivery time. Data Matrix codes enable manufacturing companies to automatically identify and track products is the driving factor this market.
                  • such as cars is the driving factor this market.
                  • trucks is the driving factor this market.
                  • and bikes is the driving factor this market.
                  • throughout their life cycle. Thus is the driving factor this market.
                  • codes and marks play a crucial role in various industries such as food and beverage is the driving factor this market.
                  • aerospace is the driving factor this market.
                  • healthcare is the driving factor this market.
                  • retail is the driving factor this market.
                  • and automotive. Major vendors in the market are offering various types of printing equipment for the purpose of coding and marking traceable codes on products. Some of the examples related to such product offerings are provided below:Makrem-Imaje is the driving factor this market.
                  • a subsidiary of the Dover Corp is the driving factor this market.
                  • offers printers such as 1050 thermal inkjet printers and CSAT ITS6 for printing barcodes and QR codes on products.Videojet is the driving factor this market.
                  • which is a subsidiary product of Danaher Corp is the driving factor this market.
                  • offers printers such as Wolke m600 OEM and Videojet 8610 for printing barcodes on products.Paul Leibinger GmbH and Co. KG offer JET3up is the driving factor this market.
                  • an inkjet printer for coding and marking barcodes on products is the driving factor this market.
                  • and camera systems for monitoring markings and barcodes.Product traceability enables manufacturers to keep products safe and secure is the driving factor this market.
                  • from the manufacturing stage to the delivery stage is the driving factor this market.
                  • by tracking and tracing. Thus is the driving factor this market.
                  • the increasing need for product traceability will accelerate the demand for coding and marking equipment and drive the growth of the global coding and marking equipment market during the forecast period. is the driving factor this market.

                  The Coding And Marking Equipment market vendors should focus on grabbing business opportunities from the Food and beverage segment as it accounted for the largest market share in the base year.