
Supply Chain Analytics Market Size 2025-2029
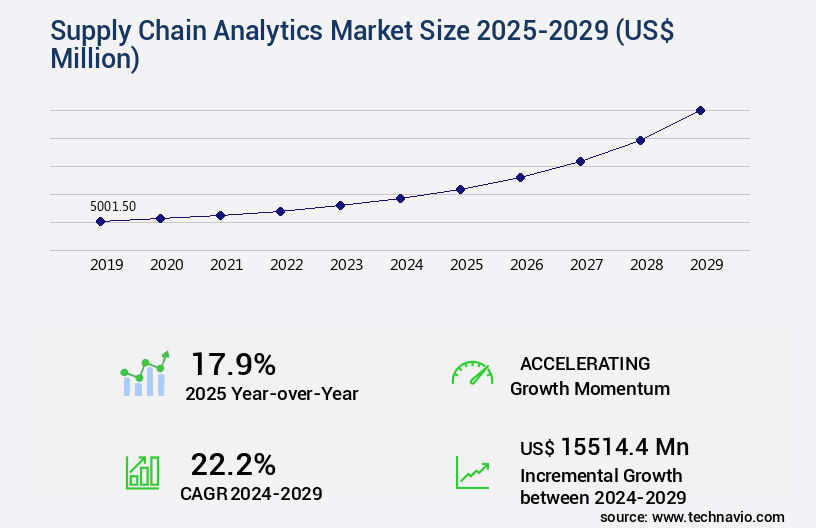
The supply chain analytics market size is valued to increase USD 15.51 billion, at a CAGR of 22.2% from 2024 to 2029. Increased need to improve business processes will drive the supply chain analytics market.
Major Market Trends & Insights
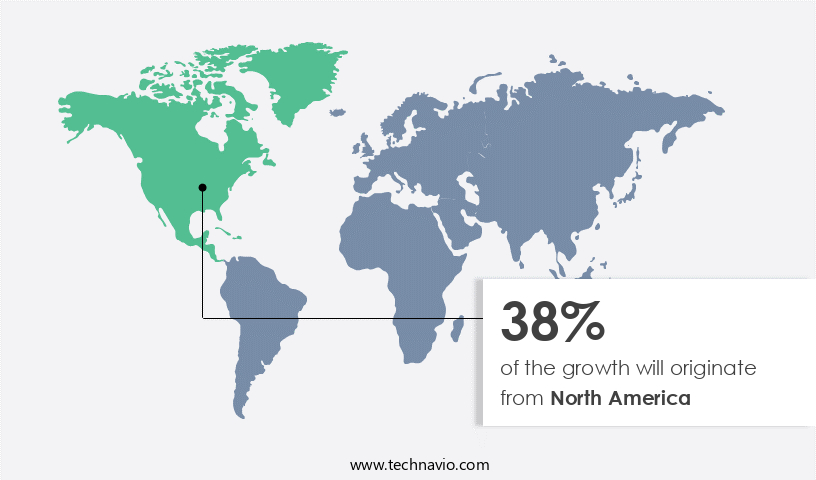
- North America dominated the market and accounted for a 38% growth during the forecast period.
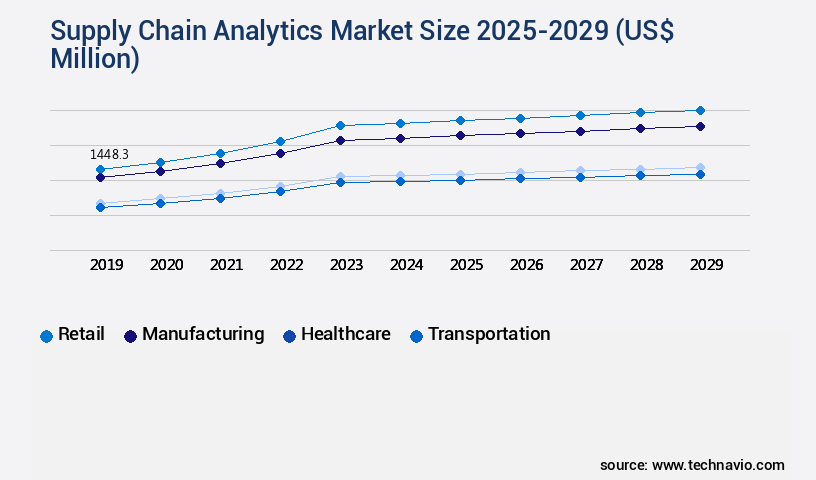
- By End-user - Retail segment was valued at USD 1.45 billion in 2023
- By Deployment - On-premises segment accounted for the largest market revenue share in 2023
Market Size & Forecast
- Market Opportunities: USD 389.88 million
- Market Future Opportunities: USD 15,514.40 million
- CAGR : 22.2%
- North America: Largest market in 2023
Market Summary
- The market is a dynamic and ever-evolving domain, driven by the increasing need to optimize business processes and enhance operational efficiency. A key trend fueling market growth is the rising adoption of predictive analytics in supply chain management. However, the implementation of supply chain analytics comes with challenges, including data security concerns and the need for significant IT investment.
- Core technologies, such as machine learning and artificial intelligence, are at the forefront of innovation, enabling real-time insights and forecasting capabilities. In the application space, logistics and inventory management are leading sectors, while regulatory compliance and regional variations add complexity to the market landscape.
What will be the Size of the Supply Chain Analytics Market during the forecast period?
Get Key Insights on Market Forecast (PDF) Request Free Sample
How is the Supply Chain Analytics Market Segmented and what are the key trends of market segmentation?
The supply chain analytics industry research report provides comprehensive data (region-wise segment analysis), with forecasts and estimates in "USD million" for the period 2025-2029, as well as historical data from 2019-2023 for the following segments.
- End-user
- Retail
- Manufacturing
- Healthcare
- Transportation
- Others
- Deployment
- On-premises
- Cloud-based
- Service
- Professional services
- Managed services
- Geography
- North America
- US
- Canada
- Europe
- France
- Germany
- Italy
- UK
- APAC
- China
- India
- Japan
- South Korea
- Rest of World (ROW)
- North America
By End-user Insights
The retail segment is estimated to witness significant growth during the forecast period.
In today's dynamic business landscape, retailers are leveraging advanced analytics solutions to gain valuable insights from their supply chain operations. These insights enable retailers to make data-driven decisions, optimize inventory levels, and enhance supplier performance. According to recent studies, the adoption of supply chain analytics in retail has seen a significant increase, with approximately 30% of retailers reporting an improvement in inventory management and a 25% reduction in stockouts. Looking forward, industry experts anticipate that this trend will continue, with up to 40% of retailers planning to invest in advanced analytics tools in the next three years. Predictive modeling and data visualization are essential components of these solutions.
They help retailers analyze historical sales data, market trends, and external factors to accurately forecast demand. Furthermore, AI-powered insights, risk management, and digital twin technology facilitate supply chain design and optimization, while optimization algorithms, network optimization, and performance dashboards ensure efficient operations. Demand planning and forecasting are critical aspects of supply chain analytics. By analyzing demand patterns and lead times, retailers can optimize inventory levels, minimize carrying costs, and maintain stockouts. Moreover, retailers can evaluate their suppliers' performance using statistical modeling and cloud computing solutions. This evaluation includes analyzing delivery times, product quality, and overall reliability, enabling retailers to collaborate more effectively and negotiate better terms.
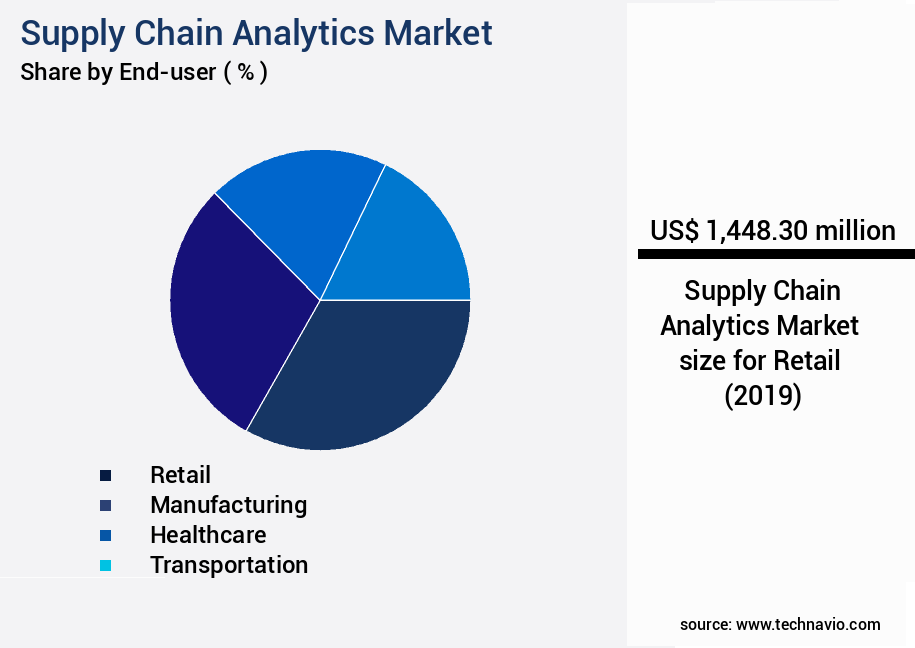
The Retail segment was valued at USD 1.45 billion in 2019 and showed a gradual increase during the forecast period.
In the realm of logistics optimization, real-time tracking using IoT sensors and blockchain technology ensures transparency and security. Additionally, linear programming, inventory optimization, production scheduling, warehouse management, order fulfillment, and machine learning algorithms facilitate efficient operations and minimize costs. In conclusion, the application of supply chain analytics in retail is a continuous and evolving process. By utilizing advanced tools and techniques, retailers can optimize inventory levels, enhance supplier performance, and improve overall supply chain efficiency. With the increasing adoption of these solutions and the anticipated growth in the market, retailers are poised to reap significant benefits.
Regional Analysis
North America is estimated to contribute 38% to the growth of the global market during the forecast period. Technavio's analysts have elaborately explained the regional trends and drivers that shape the market during the forecast period.
See How Supply Chain Analytics Market Demand is Rising in North America Request Free Sample
The North American market is experiencing growth due to the region's technological innovation and the increasing complexity of supply chains. Advanced analytics technologies, such as artificial intelligence (AI), machine learning (ML), and big data analytics, are driving the adoption of sophisticated supply chain analytics solutions. E-commerce growth and evolving customer expectations have put significant pressure on supply chain networks. In response, businesses are utilizing supply chain analytics to gain insights into demand, inventory, and logistics, optimizing operations and enhancing overall efficiency.
The United States, in particular, is a key player in this market, with its technological advancements and focus on supply chain optimization.
Market Dynamics
Our researchers analyzed the data with 2024 as the base year, along with the key drivers, trends, and challenges. A holistic analysis of drivers will help companies refine their marketing strategies to gain a competitive advantage.
The market is a dynamic and evolving landscape, characterized by the adoption of advanced technologies and data-driven strategies to optimize various aspects of the supply chain. This market is witnessing significant growth as businesses seek to enhance their operational efficiency, reduce costs, and improve customer satisfaction. One of the key trends driving this market is the use of AI for optimizing transportation routes, predictive modeling for inventory management, and improving supply chain visibility with IoT. Real-time tracking of shipments using GPS and reducing lead times through process automation are other areas where AI is making a significant impact.
Another emerging trend is the use of blockchain for enhanced supply chain security and data-driven decision making in supply chain management. The implementation of lean methodologies for supply chain optimization, risk mitigation strategies for supply chain disruptions, and measuring key performance indicators in the supply chain are also gaining popularity. Moreover, developing resilient supply chains against disruptions, leveraging big data for supply chain insights, using digital twins for supply chain simulations, and scenario planning for supply chain uncertainty are some of the other strategies being adopted by businesses to stay competitive. The use of linear programming for optimizing capacity planning and reducing transportation costs through route optimization is another area of focus.
Enhancing supply chain sustainability through ethical sourcing and ensuring supply chain compliance with regulations are also becoming essential considerations for businesses. According to market intelligence, more than 70% of businesses are investing in digital transformation initiatives to optimize their supply chain operations. This represents a significant shift towards data-driven decision making and automation, with a minority of players, less than 15%, dominating the high-end instrument market. This trend is expected to continue as businesses seek to gain a competitive edge through improved supply chain efficiency and agility.
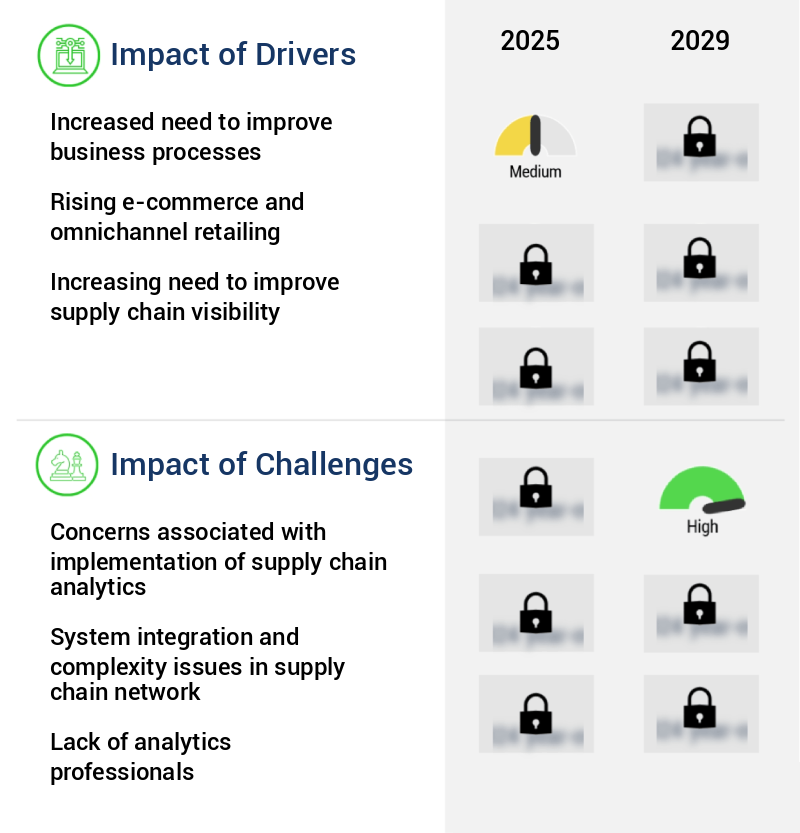
What are the key market drivers leading to the rise in the adoption of Supply Chain Analytics Industry?
- The escalating requirement to enhance business processes serves as the primary market catalyst.
- Supply chain analytics plays a pivotal role in driving business productivity by utilizing predictive mechanisms and risk-mitigating models. This data-driven approach enables industrial organizations to identify new growth opportunities and minimize errors and failure rates in their products and services. The significance of supply chain analytics is underscored by its ability to enhance business processes, resulting in improved effectiveness and efficiency. Business processes, which involve producing specific products for particular customer sets, can significantly benefit from the implementation of supply chain management (SCM) software. By optimizing resources and streamlining operations, SCM solutions contribute to increased output using minimal input.
- The ongoing evolution of supply chain analytics and its applications across various sectors underscores its strategic importance for organizations aiming to stay competitive in today's dynamic business landscape. Incorporating advanced analytical tools and techniques, supply chain analytics enables companies to gain valuable insights into their operations, identify trends, and anticipate potential challenges. By harnessing the power of data, businesses can make informed decisions, optimize their supply chains, and ultimately, enhance their bottom line. The continuous unfolding of market activities and evolving patterns in supply chain analytics further underscores its importance as a strategic priority for industrial organizations.
What are the market trends shaping the Supply Chain Analytics Industry?
- The use of predictive analytics is becoming more prevalent in supply chain management. This trend is expected to continue in the upcoming market.
- The supply chain sector faces the escalating challenge of managing and processing large volumes of data, commonly referred to as big data. Big Data Analytics is a solution tailored to address this issue, enabling organizations to efficiently handle and analyze extensive datasets generated throughout the supply chain. This encompasses various aspects, including procurement, manufacturing, logistics, and distribution. Big Data Analytics offers enhanced visibility into the supply chain by integrating data from multiple sources. By doing so, businesses can obtain a holistic perspective on inventory levels, supplier performance, transportation, and other essential metrics. This heightened transparency empowers more informed decision-making.
- Moreover, Big Data Analytics facilitates predictive and prescriptive analytics models within the supply chain. These advanced capabilities allow organizations to anticipate potential disruptions and suggest corrective actions, ultimately improving overall efficiency and productivity. In summary, Big Data Analytics plays a pivotal role in the supply chain sector by addressing the challenges posed by the exponential growth of data. Its ability to integrate and analyze vast datasets from multiple sources offers enhanced visibility, predictive capabilities, and improved decision-making.
What challenges does the Supply Chain Analytics Industry face during its growth?
- The implementation of supply chain analytics in the industry presents significant concerns that can hinder its growth. These concerns encompass various complexities, such as data security, integration of systems, and the need for specialized skills, among others. Addressing these challenges effectively is crucial for organizations seeking to leverage analytics to optimize their supply chain operations and gain a competitive edge.
- Supply chain analytics solutions have gained significant traction in business circles due to their potential to optimize operations and enhance decision-making. These advanced technologies, including AI, ML, and big data analytics, offer valuable insights by processing vast amounts of data from various sources. However, implementing these solutions comes with substantial investments. Upfront costs for acquiring and integrating these technologies can be high. Furthermore, ensuring data integration and maintaining data quality across diverse sources is a complex and costly process. Data cleansing, transformation, and integration efforts are crucial to create a unified and reliable data foundation for analytics. Organizations must also invest in hardware, software licenses, and infrastructure to support the analytics environment.
- Customization and configuration efforts are necessary to tailor supply chain analytics solutions to meet specific organizational needs. Despite these challenges, the benefits of supply chain analytics, such as improved efficiency, increased visibility, and reduced costs, make the investment worthwhile.
Exclusive Customer Landscape
The supply chain analytics market forecasting report includes the adoption lifecycle of the market, covering from the innovator's stage to the laggard's stage. It focuses on adoption rates in different regions based on penetration. Furthermore, the supply chain analytics market report also includes key purchase criteria and drivers of price sensitivity to help companies evaluate and develop their market growth analysis strategies.
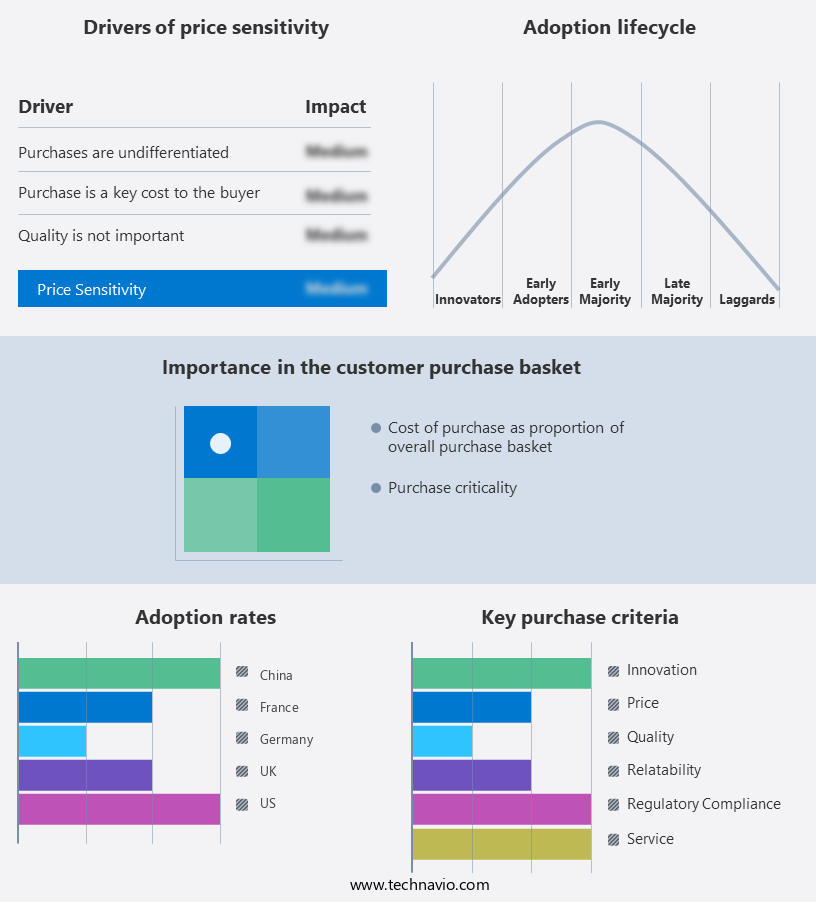
Customer Landscape of Supply Chain Analytics Industry
Competitive Landscape & Market Insights
Companies are implementing various strategies, such as strategic alliances, supply chain analytics market forecast, partnerships, mergers and acquisitions, geographical expansion, and product/service launches, to enhance their presence in the industry.
AIMMS BV - The company specializes in supply chain analytics, providing advanced solutions like AIMMS SC Navigator.
The industry research and growth report includes detailed analyses of the competitive landscape of the market and information about key companies, including:
- AIMMS BV
- American Software Inc.
- Anaplan Inc.
- Coupa Software Inc.
- Domo Inc.
- Infor Inc.
- International Business Machines Corp.
- Kinaxis Inc.
- Manhattan Associates Inc.
- MicroStrategy Inc.
- NB Ventures Inc.
- NTT DATA Corp.
- Oracle Corp.
- Panasonic Holdings Corp.
- Salesforce Inc.
- SAP SE
- SAS Institute Inc.
- TARGIT AS
- Teradata Corp.
- TIBCO Software Inc.
Qualitative and quantitative analysis of companies has been conducted to help clients understand the wider business environment as well as the strengths and weaknesses of key industry players. Data is qualitatively analyzed to categorize companies as pure play, category-focused, industry-focused, and diversified; it is quantitatively analyzed to categorize companies as dominant, leading, strong, tentative, and weak.
Recent Development and News in Supply Chain Analytics Market
- In January 2024, IBM announced the launch of its new AI-powered supply chain analytics solution, Watson Supply Chain, designed to optimize inventory levels and improve demand forecasting for businesses. This offering integrates machine learning and advanced analytics capabilities to help clients make data-driven decisions and enhance operational efficiency (IBM Press Release, 2024).
- In March 2024, SAP and Oracle formed a strategic partnership to collaborate on supply chain solutions, combining SAP's Ariba network for procurement and Oracle's JD Edwards EnterpriseOne for manufacturing and distribution. This alliance aimed to provide businesses with a comprehensive end-to-end supply chain management solution (Oracle Press Release, 2024).
- In May 2024, Descartes Systems Group, a leading global logistics technology company, completed its acquisition of MacroPoint, a real-time transportation visibility provider. This acquisition expanded Descartes' logistics technology offerings and enabled real-time tracking and analytics capabilities for its clients (Descartes Systems Group Press Release, 2024).
- In April 2025, the European Union introduced new regulations on supply chain transparency, requiring companies to disclose information about their supply chains, including social and environmental practices. This initiative aimed to promote ethical business practices and increase consumer trust (European Commission Press Release, 2025).
Dive into Technavio's robust research methodology, blending expert interviews, extensive data synthesis, and validated models for unparalleled Supply Chain Analytics Market insights. See full methodology.
|
Market Scope |
|
|
Report Coverage |
Details |
|
Page number |
222 |
|
Base year |
2024 |
|
Historic period |
2019-2023 |
|
Forecast period |
2025-2029 |
|
Growth momentum & CAGR |
Accelerate at a CAGR of 22.2% |
|
Market growth 2025-2029 |
USD 15514.4 million |
|
Market structure |
Fragmented |
|
YoY growth 2024-2025(%) |
17.9 |
|
Key countries |
US, Canada, China, Germany, UK, France, India, Japan, Italy, and South Korea |
|
Competitive landscape |
Leading Companies, Market Positioning of Companies, Competitive Strategies, and Industry Risks |
Research Analyst Overview
- The market is a dynamic and evolving landscape, shaped by the ongoing integration of advanced technologies and shifting business priorities. Predictive modeling and data visualization are increasingly essential components, enabling demand planning and supply chain resilience. AI-powered insights have become indispensable, driving demand forecasting and risk management. Digital twin technology and optimization algorithms are transforming supply chain design, allowing for network optimization and performance dashboards. Scenario planning and what-if analysis are facilitated by data analytics platforms, ensuring businesses remain agile in the face of market volatility. Linear programming and inventory optimization are crucial for production scheduling and warehouse management, while order fulfillment relies on machine learning algorithms and simulation software.
- Real-time tracking through IoT sensors and big data processing enhances supply chain visibility, enabling logistics optimization and delivery optimization. Route optimization and transportation management are further improved through cloud computing solutions and business intelligence tools. Blockchain technology adds a layer of security and transparency, ensuring data integrity and supply chain resilience. Statistical modeling and logistics optimization continue to be key areas of focus, with ongoing advancements in technology driving significant improvements in performance and efficiency. The market's continuous evolution reflects the growing importance of data-driven insights and the need for agile, adaptive supply chain strategies.
What are the Key Data Covered in this Supply Chain Analytics Market Research and Growth Report?
-
What is the expected growth of the Supply Chain Analytics Market between 2025 and 2029?
-
USD 15.51 billion, at a CAGR of 22.2%
-
-
What segmentation does the market report cover?
-
The report segmented by End-user (Retail, Manufacturing, Healthcare, Transportation, and Others), Deployment (On-premises and Cloud-based), Service (Professional services and Managed services), and Geography (North America, Europe, APAC, Middle East and Africa, and South America)
-
-
Which regions are analyzed in the report?
-
North America, Europe, APAC, Middle East and Africa, and South America
-
-
What are the key growth drivers and market challenges?
-
Increased need to improve business processes, Concerns associated with implementation of supply chain analytics
-
-
Who are the major players in the Supply Chain Analytics Market?
-
Key Companies AIMMS BV, American Software Inc., Anaplan Inc., Coupa Software Inc., Domo Inc., Infor Inc., International Business Machines Corp., Kinaxis Inc., Manhattan Associates Inc., MicroStrategy Inc., NB Ventures Inc., NTT DATA Corp., Oracle Corp., Panasonic Holdings Corp., Salesforce Inc., SAP SE, SAS Institute Inc., TARGIT AS, Teradata Corp., and TIBCO Software Inc.
-
Market Research Insights
- The market encompasses a range of solutions that leverage data mining, process improvement, and decision support systems to optimize inventory levels, reduce lead times, and enhance supply chain efficiency. The expansion is driven by the increasing importance of data integration, root cause analysis, and real-time process automation in addressing supply chain disruptions, transportation costs, and demand variability. For instance, six sigma methodologies can help companies achieve efficiency gains of up to 30% by eliminating defects and reducing waste.
- Furthermore, the adoption of lean methodologies, agile supply chains, and sustainability initiatives contributes to on-time delivery, customer satisfaction, and risk mitigation strategies. By harnessing the power of data analytics, businesses can improve quality control, enhance ethical sourcing, and streamline network design, ultimately leading to significant cost reduction and compliance with regulatory requirements.
We can help! Our analysts can customize this supply chain analytics market research report to meet your requirements.
 RIA -
RIA - 
