Laser Marking Equipment Market Analysis APAC, North America, Europe, Middle East and Africa, South America - US, China, Germany, Japan, UK - Size and Forecast 2024-2028

Laser Marking Equipment Market Analysis APAC, North America, Europe, Middle East and Africa, South America - US, China, Germany, Japan, UK - Size and Forecast 2024-2028

Published: Jul 2024 182 Pages SKU: IRTNTR43054

Market Overview at a Glance

$1.43 B
Market Opportunity
7.86%
CAGR
7.14
YoY growth 2023-2024(%)

Laser Marking Equipment Market Size 2024-2028 

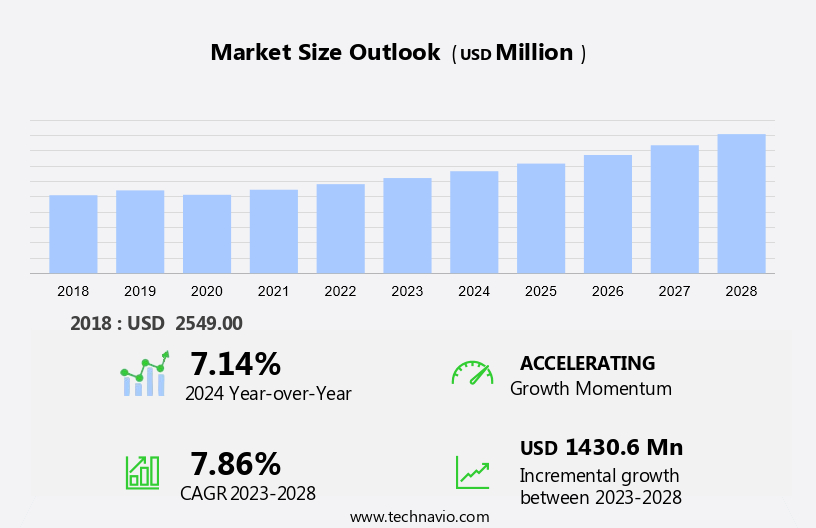
The laser marking equipment market size is forecast to increase by USD 1.43 billion, at a CAGR of 7.86% between 2023 and 2028. The market is witnessing significant growth due to the increasing trend towards automation in various industries. This automation is leading to the adoption of laser marking equipment for marking and coding applications, as it offers high precision, flexibility, and speed. Another trend driving the market is the need for better product traceability, which is essential in industries such as pharmaceuticals, electronics, and food and beverage. However, a challenge facing the market is the lack of skilled operators to handle and maintain these advanced laser marking systems. This requires ongoing training and development programs to ensure a sufficient workforce to meet the growing demand for laser marking technology.

Laser Marking Equipment Market Size

 Request Free Sample

The market is witnessing significant growth due to the increasing automation processes in various industrial verticals, including the medical sector and defense sector. The use of laser marking machines for identifying and branding products, improving process quality, and ensuring industry standards has become increasingly popular. In particular, the medical devices industry is adopting laser marking for product identification and traceability. UV laser marking technology is gaining traction due to its ability to mark various materials, such as polypropylene tubes, without causing material damage. The non-contact nature of laser marking makes it an attractive alternative to traditional marking methods, such as etching and annealing.

Integrated laser marking machines, which combine laser marking with other technologies like sensors and barcode readers, are becoming increasingly popular. These machines offer process improvement and quality control benefits, making them essential for production lines. The defense sector is also adopting laser marking for identification and traceability purposes. Laser marking offers a permanent and reliable marking solution, making it ideal for marking sensitive components and materials. Consumables, such as laser marking consumables, are an essential part of the market. These consumables include marking media and lasers, and their availability and cost-effectiveness play a significant role in the market's growth.

Overall, the market is expected to grow due to the increasing demand for automation, product branding, and quality control in various industries. The market is expected to continue to evolve with advancements in laser marking technology and industry standards.

Market Segmentation

The market research report provides comprehensive data (region-wise segment analysis), with forecasts and estimates in "USD million" for the period 2024-2028, as well as historical data from 2018-2022 for the following segments.
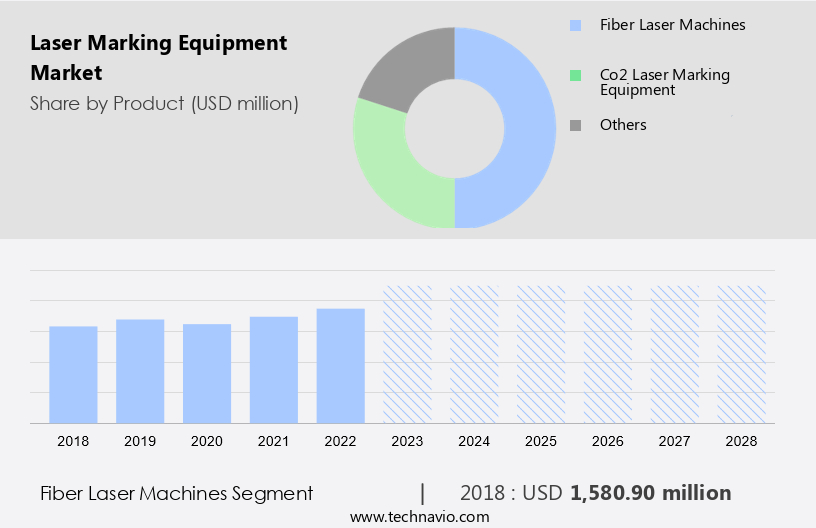
  • Product
    • Fiber laser machines
    • Co2 laser marking equipment
    • Others
  • Application
    • Machine tool
    • Electronics and microelectronics
    • Automotive
    • Medical
    • Others
  • Geography
    • APAC
      • China
      • Japan
    • North America
      • US
    • Europe
      • Germany
      • UK
    • Middle East and Africa
    • South America

By Product Insights

The fiber laser machines segment is estimated to witness significant growth during the forecast period. Laser marking equipment is a versatile technology finding extensive application across various industries, including healthcare and pharmaceuticals, machine tools, packaging sectors, and the automobile industry. The expanding usage of this technology is driven by improved functionality, operational excellence, and ecological integrity. Small businesses and startups, despite limited budgets, are increasingly adopting laser marking due to its upfront expense being offset by its long-term benefits. Power needs and additional functionalities vary depending on the industry. For instance, in healthcare and pharmaceuticals, laser marking ensures forgery-proof, easy-to-read data on medical devices and components. In contrast, the automobile sector requires durable markings that withstand high temperatures and fluids, such as oil and gas, during mass production.

Macroeconomic factors, including virus containment measures, have further accelerated the adoption of laser marking equipment. The largest end user, the automobile sector, is expected to continue leading the market growth due to the need for maximum precision, speed, high contrast, and thermal stress resistance. Laser marking offers protection against forgery, making it an essential component in industries where component malfunctions can have severe consequences. This versatile technology caters to various industries, offering alphanumeric inscriptions on plastic, metal, auto parts, and components, ensuring high-quality, long-lasting markings.

Laser Marking Equipment Market Size

Get a glance at the market share of various segments Request Free Sample

The fiber laser machines segment accounted for USD 1.58 million in 2018 and showed a gradual increase during the forecast period.

Regional Insights

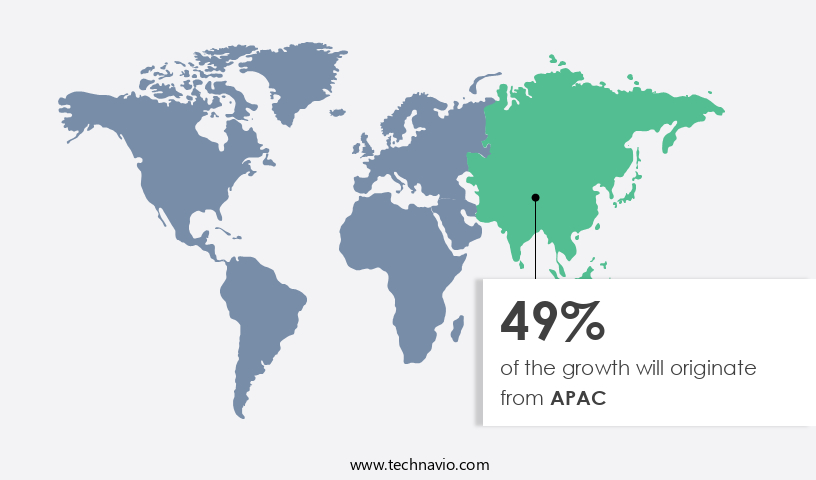
APAC is estimated to contribute 49% to the growth of the global market during the forecast period. Technavio's analysts have elaborately explained the regional trends and drivers that shape the market during the forecast period.

Laser Marking Equipment Market Share by Geography

For more insights on the market share of various regions Request Free Sample

Laser marking equipment is a versatile technology finding expanding usage in various industries, including healthcare and pharmaceuticals, machine tools, packaging sectors, and the automobile industry. This technology offers improved functionality, operational excellence, and ecological integrity, making it an attractive option for small businesses and startups with limited budgets. The upfront expense of laser marking equipment can be offset by its long-term benefits, such as laser placement, power needs, and additional functionalities. Macroeconomic factors, such as virus containment measures and mass production needs, have further fueled the demand for laser marking equipment. In the healthcare and pharmaceutical sectors, laser marking is used to create forgery-proof, easy-to-read data on medical devices and components.

In the automobile sector, it is used to create durable markings on auto parts and components, withstanding high temperatures, fluids, oil, and gas. The largest end user of laser marking equipment is the automobile sector, followed by the machine tools and packaging industries. The technology's ability to create high-contrast, maximum precision, and high-speed markings makes it ideal for mass production and protection against forgery. The markings produced by laser marking equipment are known for their durability, withstanding thermal stress and component malfunctions, making it a valuable investment for businesses seeking operational excellence and ecological integrity.

Our researchers analyzed the data with 2023 as the base year, along with the key drivers, trends, and challenges. A holistic analysis of drivers will help companies refine their marketing strategies to gain a competitive advantage.

Laser Marking Equipment Market Driver

Increasing in automation in laser marking equipment is the key driver of the market. Laser marking equipment, a form of automation technology, is gaining popularity in various industries due to its non-contact nature and ability to provide permanent identification solutions. This technology utilizes laser beams to engrave, etch, anneal, or mark surfaces without the use of inks, coatings, or exposure to acids, gasoline, oils, or heat. The medical devices industry, in particular, benefits from laser marking as it ensures traceability and product branding, adhering to stringent industry standards. Laser technology, including CO2, green, YAG, and fiber lasers, is employed for marking various materials, from metals and plastics to glass and ceramics. Material compatibility is a crucial factor in selecting the appropriate laser type.

Consumables, such as laser marking pens and fibers, are essential for maintaining the equipment's performance and longevity. The initial investment and implementation costs for laser marking equipment may be high, but the long-term benefits include increased productivity, reduced material damage, and expertise required for labeling processes. Furthermore, advancements in laser technology have expanded its applications to include 3D printing. As automation continues to be a priority for businesses, the demand for laser marking equipment is expected to grow.

Laser Marking Equipment Market Trends

Product marking for better traceability is the upcoming trend in the market. Laser marking equipment is a non-contact marking technology that utilizes laser beams to expose materials to heat, resulting in markings through engraving, etching, or annealing. This method offers advantages such as high precision, durability, and compatibility with various materials, including metals, plastics, and glass. The medical devices industry, in particular, has embraced laser marking for product branding and traceability solutions, ensuring compliance with industry standards. Laser technology enables the creation of permanent and legible markings, reducing the need for labels susceptible to damage from exposure to acids, gasoline, oils, or other harsh environments. With the increasing demand for automation and traceability, laser marking equipment has become an essential investment for industries, despite the initial investment and implementation costs.

Consumables, such as CO2 Laser, Green Laser, YAG Laser, and Fiber Laser, are used in laser marking processes. Training and expertise are crucial for effective implementation and optimal results. The technology's non-contact nature and versatility have led to its expansion into 3D printing applications, further broadening its applications and benefits.

Laser Marking Equipment Market Challenge

Lack of skilled operators for laser marking equipment is a key challenge affecting the market growth. Laser marking equipment, which utilizes laser technology for engraving, etching, annealing, and other labeling processes, has gained considerable traction in the industrial sector. Unlike traditional methods that expose materials to acids, gasoline, oils, or heat, laser marking offers a non-contact nature, ensuring minimal material damage. The equipment caters to various industries, including medical devices, where product branding and traceability solutions are crucial. The laser marking process involves a computer or microprocessor-control system converting digital data into motion control, enabling the execution of marking processes. Though the equipment boasts advanced technology, it necessitates an expert operator for marking operations. Operators are responsible for loading part files into the control system and aligning the bed with the material to be marked.

Laser marking equipment is available in various types, such as CO2 Laser, Green Laser, YAG Laser, and Fiber Laser, each with its unique advantages and material compatibility. Consumables and automation are essential aspects of laser marking, with industry standards ensuring material compatibility and safety. Initial investment and implementation costs, including training and expertise, should be considered before investing in laser marking equipment. The technology's growing applications in 3D printing and identification solutions further expand its market potential.

Exclusive Customer Landscape

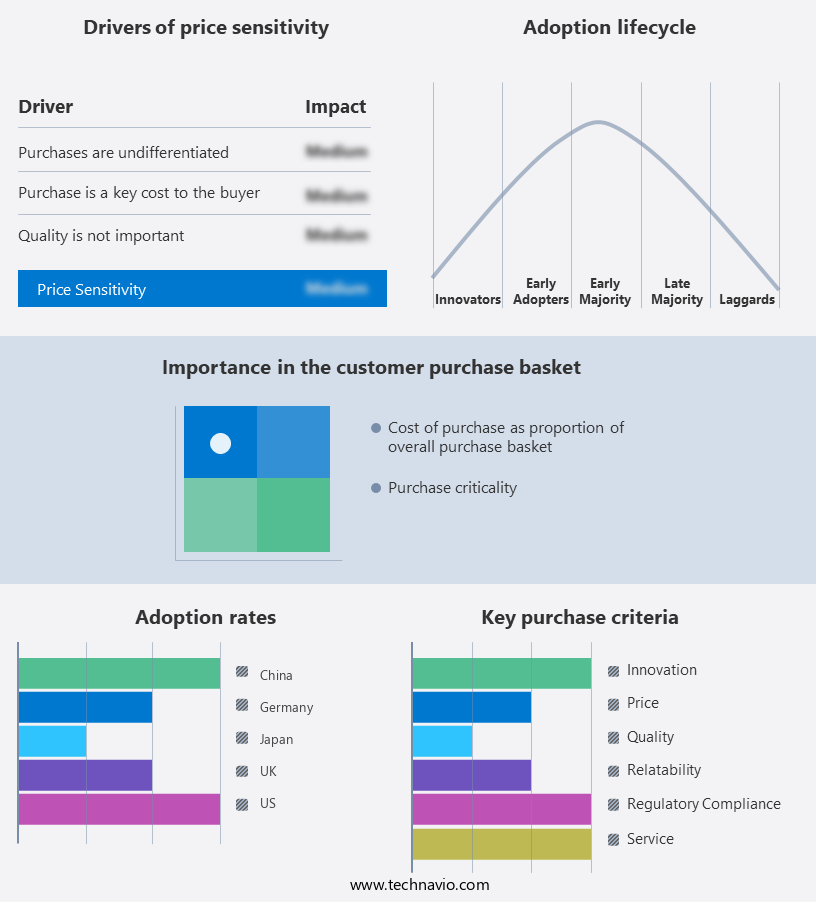
The market forecasting report includes the adoption lifecycle of the market, covering from the innovator's stage to the laggard's stage. It focuses on adoption rates in different regions based on penetration. Furthermore, the report also includes key purchase criteria and drivers of price sensitivity to help companies evaluate and develop their market growth analysis strategies.

Laser Marking Equipment Market Share by Geography

 Customer Landscape

Key Companies & Market Insights

Companies are implementing various strategies, such as strategic alliances, partnerships, mergers and acquisitions, geographical expansion, and product/service launches, to enhance their presence in the market.

Alpha Laser US Inc. - The company offers a range of advanced laser marking solutions, including the AL in laser welder, AL series laser welders, and the ALFLAK laser welder.

The market research and growth report includes detailed analyses of the competitive landscape of the market and information about key companies, including:

  • AMADA Co. Ltd.
  • EMAG GmbH and Co. KG
  • Emerson Electric Co.
  • Epilog Corp.
  • FANUC Corp.
  • II VI Inc.
  • IPG Photonics Corp.
  • Jenoptik AG
  • Jinan Xintian Technology Co. Ltd.
  • Laser Marking Technologies LLC
  • Laserline GmbH
  • Laserstar Technologies Corp.
  • Morn Laser
  • Perfect Laser Co. Ltd.
  • Precitec GmbH and Co. KG
  • Shenzhen HeroLaser Equipment Co. Ltd.
  • Trotec Laser GmbH
  • TRUMPF SE Co. KG
  • Videojet Technologies

Qualitative and quantitative analysis of companies has been conducted to help clients understand the wider business environment as well as the strengths and weaknesses of key market players. Data is qualitatively analyzed to categorize companies as pure play, category-focused, industry-focused, and diversified; it is quantitatively analyzed to categorize companies as dominant, leading, strong, tentative, and weak.

Research Analyst Overview

The global market is expected to witness significant growth due to the increasing automation processes in various industrial verticals, including the medical sector and defense industry. Laser marking machines are increasingly being adopted for marking complex-shaped characters, traceability, inventory control, production flow control, and product quality validation. The market is segmented into UV laser, fiber laser, CO2 laser marking, and galvo laser marking systems. Fiber laser machines are gaining popularity due to their ability to mark on a wide range of materials, including polypropylene tubes, electronic devices, and inclined planes. The integration of sensors, robotics, and barcode readers in laser marking machines is enabling the development of smart factories and improving process efficiency.

The market also caters to the requirements of the surgical and medical sector for marking batch numbers and identifying complex-shaped characters on moving or rotating objects. The use of green laser systems and machine tools in laser marking is further expanding the market's application areas. Overall, the market is driven by the need for traceability, identification, and quality control in various industries.

Market Scope

Report Coverage

Details

Page number

182

Base year

2023

Historic period

2018-2022

Forecast period

2024-2028

Growth momentum & CAGR

Accelerate at a CAGR of 7.86%

Market growth 2024-2028

USD 1.43 billion

Market structure

Fragmented

YoY growth 2023-2024(%)

7.14

Regional analysis

APAC, North America, Europe, Middle East and Africa, and South America

Performing market contribution

APAC at 49%

Key countries

US, China, Germany, Japan, and UK

Competitive landscape

Leading Companies, Market Positioning of Companies, Competitive Strategies, and Industry Risks

Key companies profiled

Alpha Laser US Inc., AMADA Co. Ltd., EMAG GmbH and Co. KG, Emerson Electric Co., Epilog Corp., FANUC Corp., II VI Inc., IPG Photonics Corp., Jenoptik AG, Jinan Xintian Technology Co. Ltd., Laser Marking Technologies LLC, Laserline GmbH, Laserstar Technologies Corp., Morn Laser, Perfect Laser Co. Ltd., Precitec GmbH and Co. KG, Shenzhen HeroLaser Equipment Co. Ltd., Trotec Laser GmbH, TRUMPF SE Co. KG, and Videojet Technologies

Market dynamics

Parent market analysis, market growth inducers and obstacles, market forecast, fast-growing and slow-growing segment analysis, COVID-19 impact and recovery analysis and future consumer dynamics, market condition analysis for the forecast period

Customization purview

If our market report has not included the data that you are looking for, you can reach out to our analysts and get segments customized.

Request Free Sample

What are the Key Data Covered in this Market Research and Growth Report?

  • CAGR of the market during the forecast period
  • Detailed information on factors that will drive the market growth and forecasting between 2024 and 2028
  • Precise estimation of the size of the market  and its contribution of the market in focus to the parent market
  • Accurate predictions about upcoming market growth and trends and changes in consumer behaviour
  • Growth of the market across APAC, North America, Europe, Middle East and Africa, and South America
  • Thorough analysis of the market's competitive landscape and detailed information about companies
  • Comprehensive analysis of factors that will challenge the growth of market companies

We can help! Our analysts can customize this market research report to meet your requirements.

Get in touch

1 Executive Summary

  • 1.1 Market overview
    • Executive Summary - Chart on Market Overview
    • Executive Summary - Data Table on Market Overview
    • Executive Summary - Chart on Global Market Characteristics
    • Executive Summary - Chart on Market by Geography
    • Executive Summary - Chart on Market Segmentation by Product
    • Executive Summary - Chart on Market Segmentation by Application
    • Executive Summary - Chart on Incremental Growth
    • Executive Summary - Data Table on Incremental Growth
    • Executive Summary - Chart on Company Market Positioning

2 Market Landscape

  • 2.1 Market ecosystem
    • Parent Market
    • Data Table on - Parent Market
  • 2.2 Market characteristics
    • Market characteristics analysis
  • 2.3 Value chain analysis
    • Value Chain Analysis

3 Market Sizing

  • 3.1 Market definition
    • Offerings of companies included in the market definition
  • 3.2 Market segment analysis
    • Market segments
  • 3.3 Market size 2023
    • 3.4 Market outlook: Forecast for 2023-2028
      • Chart on Global - Market size and forecast 2023-2028 ($ million)
      • Data Table on Global - Market size and forecast 2023-2028 ($ million)
      • Chart on Global Market: Year-over-year growth 2023-2028 (%)
      • Data Table on Global Market: Year-over-year growth 2023-2028 (%)

    4 Historic Market Size

    • 4.1 Global Laser Marking Equipment Market 2018 - 2022
      • Historic Market Size - Data Table on Global Laser Marking Equipment Market 2018 - 2022 ($ million)
    • 4.2 Product segment analysis 2018 - 2022
      • Historic Market Size - Product Segment 2018 - 2022 ($ million)
    • 4.3 Application segment analysis 2018 - 2022
      • Historic Market Size - Application Segment 2018 - 2022 ($ million)
    • 4.4 Geography segment analysis 2018 - 2022
      • Historic Market Size - Geography Segment 2018 - 2022 ($ million)
    • 4.5 Country segment analysis 2018 - 2022
      • Historic Market Size - Country Segment 2018 - 2022 ($ million)

    5 Five Forces Analysis

    • 5.1 Five forces summary
      • Five forces analysis - Comparison between 2023 and 2028
    • 5.2 Bargaining power of buyers
      • Bargaining power of buyers - Impact of key factors 2023 and 2028
    • 5.3 Bargaining power of suppliers
      • Bargaining power of suppliers - Impact of key factors in 2023 and 2028
    • 5.4 Threat of new entrants
      • Threat of new entrants - Impact of key factors in 2023 and 2028
    • 5.5 Threat of substitutes
      • Threat of substitutes - Impact of key factors in 2023 and 2028
    • 5.6 Threat of rivalry
      • Threat of rivalry - Impact of key factors in 2023 and 2028
    • 5.7 Market condition
      • Chart on Market condition - Five forces 2023 and 2028

    6 Market Segmentation by Product

    • 6.1 Market segments
      • Chart on Product - Market share 2023-2028 (%)
      • Data Table on Product - Market share 2023-2028 (%)
    • 6.2 Comparison by Product
      • Chart on Comparison by Product
      • Data Table on Comparison by Product
    • 6.3 Fiber laser machines - Market size and forecast 2023-2028
      • Chart on Fiber laser machines - Market size and forecast 2023-2028 ($ million)
      • Data Table on Fiber laser machines - Market size and forecast 2023-2028 ($ million)
      • Chart on Fiber laser machines - Year-over-year growth 2023-2028 (%)
      • Data Table on Fiber laser machines - Year-over-year growth 2023-2028 (%)
    • 6.4 Co2 laser marking equipment - Market size and forecast 2023-2028
      • Chart on Co2 laser marking equipment - Market size and forecast 2023-2028 ($ million)
      • Data Table on Co2 laser marking equipment - Market size and forecast 2023-2028 ($ million)
      • Chart on Co2 laser marking equipment - Year-over-year growth 2023-2028 (%)
      • Data Table on Co2 laser marking equipment - Year-over-year growth 2023-2028 (%)
    • 6.5 Others - Market size and forecast 2023-2028
      • Chart on Others - Market size and forecast 2023-2028 ($ million)
      • Data Table on Others - Market size and forecast 2023-2028 ($ million)
      • Chart on Others - Year-over-year growth 2023-2028 (%)
      • Data Table on Others - Year-over-year growth 2023-2028 (%)
    • 6.6 Market opportunity by Product
      • Market opportunity by Product ($ million)
      • Data Table on Market opportunity by Product ($ million)

    7 Market Segmentation by Application

    • 7.1 Market segments
      • Chart on Application - Market share 2023-2028 (%)
      • Data Table on Application - Market share 2023-2028 (%)
    • 7.2 Comparison by Application
      • Chart on Comparison by Application
      • Data Table on Comparison by Application
    • 7.3 Machine tool - Market size and forecast 2023-2028
      • Chart on Machine tool - Market size and forecast 2023-2028 ($ million)
      • Data Table on Machine tool - Market size and forecast 2023-2028 ($ million)
      • Chart on Machine tool - Year-over-year growth 2023-2028 (%)
      • Data Table on Machine tool - Year-over-year growth 2023-2028 (%)
    • 7.4 Electronics and microelectronics - Market size and forecast 2023-2028
      • Chart on Electronics and microelectronics - Market size and forecast 2023-2028 ($ million)
      • Data Table on Electronics and microelectronics - Market size and forecast 2023-2028 ($ million)
      • Chart on Electronics and microelectronics - Year-over-year growth 2023-2028 (%)
      • Data Table on Electronics and microelectronics - Year-over-year growth 2023-2028 (%)
    • 7.5 Automotive - Market size and forecast 2023-2028
      • Chart on Automotive - Market size and forecast 2023-2028 ($ million)
      • Data Table on Automotive - Market size and forecast 2023-2028 ($ million)
      • Chart on Automotive - Year-over-year growth 2023-2028 (%)
      • Data Table on Automotive - Year-over-year growth 2023-2028 (%)
    • 7.6 Medical - Market size and forecast 2023-2028
      • Chart on Medical - Market size and forecast 2023-2028 ($ million)
      • Data Table on Medical - Market size and forecast 2023-2028 ($ million)
      • Chart on Medical - Year-over-year growth 2023-2028 (%)
      • Data Table on Medical - Year-over-year growth 2023-2028 (%)
    • 7.7 Others - Market size and forecast 2023-2028
      • Chart on Others - Market size and forecast 2023-2028 ($ million)
      • Data Table on Others - Market size and forecast 2023-2028 ($ million)
      • Chart on Others - Year-over-year growth 2023-2028 (%)
      • Data Table on Others - Year-over-year growth 2023-2028 (%)
    • 7.8 Market opportunity by Application
      • Market opportunity by Application ($ million)
      • Data Table on Market opportunity by Application ($ million)

    8 Customer Landscape

    • 8.1 Customer landscape overview
      • Analysis of price sensitivity, lifecycle, customer purchase basket, adoption rates, and purchase criteria

    9 Geographic Landscape

    • 9.1 Geographic segmentation
      • Chart on Market share by geography 2023-2028 (%)
      • Data Table on Market share by geography 2023-2028 (%)
    • 9.2 Geographic comparison
      • Chart on Geographic comparison
      • Data Table on Geographic comparison
    • 9.3 APAC - Market size and forecast 2023-2028
      • Chart on APAC - Market size and forecast 2023-2028 ($ million)
      • Data Table on APAC - Market size and forecast 2023-2028 ($ million)
      • Chart on APAC - Year-over-year growth 2023-2028 (%)
      • Data Table on APAC - Year-over-year growth 2023-2028 (%)
    • 9.4 North America - Market size and forecast 2023-2028
      • Chart on North America - Market size and forecast 2023-2028 ($ million)
      • Data Table on North America - Market size and forecast 2023-2028 ($ million)
      • Chart on North America - Year-over-year growth 2023-2028 (%)
      • Data Table on North America - Year-over-year growth 2023-2028 (%)
    • 9.5 Europe - Market size and forecast 2023-2028
      • Chart on Europe - Market size and forecast 2023-2028 ($ million)
      • Data Table on Europe - Market size and forecast 2023-2028 ($ million)
      • Chart on Europe - Year-over-year growth 2023-2028 (%)
      • Data Table on Europe - Year-over-year growth 2023-2028 (%)
    • 9.6 Middle East and Africa - Market size and forecast 2023-2028
      • Chart on Middle East and Africa - Market size and forecast 2023-2028 ($ million)
      • Data Table on Middle East and Africa - Market size and forecast 2023-2028 ($ million)
      • Chart on Middle East and Africa - Year-over-year growth 2023-2028 (%)
      • Data Table on Middle East and Africa - Year-over-year growth 2023-2028 (%)
    • 9.7 South America - Market size and forecast 2023-2028
      • Chart on South America - Market size and forecast 2023-2028 ($ million)
      • Data Table on South America - Market size and forecast 2023-2028 ($ million)
      • Chart on South America - Year-over-year growth 2023-2028 (%)
      • Data Table on South America - Year-over-year growth 2023-2028 (%)
    • 9.8 US - Market size and forecast 2023-2028
      • Chart on US - Market size and forecast 2023-2028 ($ million)
      • Data Table on US - Market size and forecast 2023-2028 ($ million)
      • Chart on US - Year-over-year growth 2023-2028 (%)
      • Data Table on US - Year-over-year growth 2023-2028 (%)
    • 9.9 China - Market size and forecast 2023-2028
      • Chart on China - Market size and forecast 2023-2028 ($ million)
      • Data Table on China - Market size and forecast 2023-2028 ($ million)
      • Chart on China - Year-over-year growth 2023-2028 (%)
      • Data Table on China - Year-over-year growth 2023-2028 (%)
    • 9.10 Germany - Market size and forecast 2023-2028
      • Chart on Germany - Market size and forecast 2023-2028 ($ million)
      • Data Table on Germany - Market size and forecast 2023-2028 ($ million)
      • Chart on Germany - Year-over-year growth 2023-2028 (%)
      • Data Table on Germany - Year-over-year growth 2023-2028 (%)
    • 9.11 Japan - Market size and forecast 2023-2028
      • Chart on Japan - Market size and forecast 2023-2028 ($ million)
      • Data Table on Japan - Market size and forecast 2023-2028 ($ million)
      • Chart on Japan - Year-over-year growth 2023-2028 (%)
      • Data Table on Japan - Year-over-year growth 2023-2028 (%)
    • 9.12 UK - Market size and forecast 2023-2028
      • Chart on UK - Market size and forecast 2023-2028 ($ million)
      • Data Table on UK - Market size and forecast 2023-2028 ($ million)
      • Chart on UK - Year-over-year growth 2023-2028 (%)
      • Data Table on UK - Year-over-year growth 2023-2028 (%)
    • 9.13 Market opportunity by geography
      • Market opportunity by geography ($ million)
      • Data Tables on Market opportunity by geography ($ million)

    10 Drivers, Challenges, and Opportunity/Restraints

    • 10.1 Market drivers
      • 10.2 Market challenges
        • 10.3 Impact of drivers and challenges
          • Impact of drivers and challenges in 2023 and 2028
        • 10.4 Market opportunities/restraints

          11 Competitive Landscape

          • 11.1 Overview
            • 11.2 Competitive Landscape
              • Overview on criticality of inputs and factors of differentiation
            • 11.3 Landscape disruption
              • Overview on factors of disruption
            • 11.4 Industry risks
              • Impact of key risks on business

            12 Competitive Analysis

            • 12.1 Companies profiled
              • Companies covered
            • 12.2 Market positioning of companies
              • Matrix on companies position and classification
            • 12.3 Alpha Laser US Inc.
              • Alpha Laser US Inc. - Overview
              • Alpha Laser US Inc. - Product / Service
              • Alpha Laser US Inc. - Key offerings
            • 12.4 AMADA Co. Ltd.
              • AMADA Co. Ltd. - Overview
              • AMADA Co. Ltd. - Business segments
              • AMADA Co. Ltd. - Key offerings
              • AMADA Co. Ltd. - Segment focus
            • 12.5 EMAG GmbH and Co. KG
              • EMAG GmbH and Co. KG - Overview
              • EMAG GmbH and Co. KG - Product / Service
              • EMAG GmbH and Co. KG - Key offerings
            • 12.6 Emerson Electric Co.
              • Emerson Electric Co. - Overview
              • Emerson Electric Co. - Business segments
              • Emerson Electric Co. - Key news
              • Emerson Electric Co. - Key offerings
              • Emerson Electric Co. - Segment focus
            • 12.7 FANUC Corp.
              • FANUC Corp. - Overview
              • FANUC Corp. - Product / Service
              • FANUC Corp. - Key news
              • FANUC Corp. - Key offerings
            • 12.8 II VI Inc.
              • II VI Inc. - Overview
              • II VI Inc. - Business segments
              • II VI Inc. - Key news
              • II VI Inc. - Key offerings
              • II VI Inc. - Segment focus
            • 12.9 IPG Photonics Corp.
              • IPG Photonics Corp. - Overview
              • IPG Photonics Corp. - Product / Service
              • IPG Photonics Corp. - Key news
              • IPG Photonics Corp. - Key offerings
            • 12.10 Jenoptik AG
              • Jenoptik AG - Overview
              • Jenoptik AG - Business segments
              • Jenoptik AG - Key news
              • Jenoptik AG - Key offerings
              • Jenoptik AG - Segment focus
            • 12.11 Jinan Xintian Technology Co. Ltd.
              • Jinan Xintian Technology Co. Ltd. - Overview
              • Jinan Xintian Technology Co. Ltd. - Product / Service
              • Jinan Xintian Technology Co. Ltd. - Key offerings
            • 12.12 Laser Marking Technologies LLC
              • Laser Marking Technologies LLC - Overview
              • Laser Marking Technologies LLC - Product / Service
              • Laser Marking Technologies LLC - Key offerings
            • 12.13 Laserline GmbH
              • Laserline GmbH - Overview
              • Laserline GmbH - Product / Service
              • Laserline GmbH - Key offerings
            • 12.14 Laserstar Technologies Corp.
              • Laserstar Technologies Corp. - Overview
              • Laserstar Technologies Corp. - Product / Service
              • Laserstar Technologies Corp. - Key offerings
            • 12.15 Morn Laser
              • Morn Laser - Overview
              • Morn Laser - Product / Service
              • Morn Laser - Key offerings
            • 12.16 Perfect Laser Co. Ltd.
              • Perfect Laser Co. Ltd. - Overview
              • Perfect Laser Co. Ltd. - Product / Service
              • Perfect Laser Co. Ltd. - Key offerings
            • 12.17 TRUMPF SE Co. KG
              • TRUMPF SE Co. KG - Overview
              • TRUMPF SE Co. KG - Product / Service
              • TRUMPF SE Co. KG - Key offerings

            13 Appendix

            • 13.1 Scope of the report
              • 13.2 Inclusions and exclusions checklist
                • Inclusions checklist
                • Exclusions checklist
              • 13.3 Currency conversion rates for US$
                • Currency conversion rates for US$
              • 13.4 Research methodology
                • Research methodology
              • 13.5 Data procurement
                • Information sources
              • 13.6 Data validation
                • Data validation
              • 13.7 Validation techniques employed for market sizing
                • Validation techniques employed for market sizing
              • 13.8 Data synthesis
                • Data synthesis
              • 360 degree market analysis
                • 360 degree market analysis
              • 13.10 List of abbreviations
                • List of abbreviations

              Research Methodology

              Technavio presents a detailed picture of the market by way of study, synthesis, and summation of data from multiple sources. The analysts have presented the various facets of the market with a particular focus on identifying the key industry influencers. The data thus presented is comprehensive, reliable, and the result of extensive research, both primary and secondary.

              INFORMATION SOURCES

              Primary sources

              • Manufacturers and suppliers
              • Channel partners
              • Industry experts
              • Strategic decision makers

              Secondary sources

              • Industry journals and periodicals
              • Government data
              • Financial reports of key industry players
              • Historical data
              • Press releases

              DATA ANALYSIS

              Data Synthesis

              • Collation of data
              • Estimation of key figures
              • Analysis of derived insights

              Data Validation

              • Triangulation with data models
              • Reference against proprietary databases
              • Corroboration with industry experts

              REPORT WRITING

              Qualitative

              • Market drivers
              • Market challenges
              • Market trends
              • Five forces analysis

              Quantitative

              • Market size and forecast
              • Market segmentation
              • Geographical insights
              • Competitive landscape

              Interested in this report?

              Get your sample now to see our research methodology and insights!

              Download Now

              Frequently Asked Questions

              Laser Marking Equipment market growth will increase by $ 1430.6 mn during 2024-2028.

              The Laser Marking Equipment market is expected to grow at a CAGR of 7.86% during 2024-2028.

              Laser Marking Equipment market is segmented by Product( Fiber laser machines, Co2 laser marking equipment, Others) Application( Machine tool, Electronics and microelectronics, Automotive, Medical, Others)

              Alpha Laser US Inc., AMADA Co. Ltd., EMAG GmbH and Co. KG, Emerson Electric Co., Epilog Corp., FANUC Corp., II VI Inc., IPG Photonics Corp., Jenoptik AG, Jinan Xintian Technology Co. Ltd., Laser Marking Technologies LLC, Laserline GmbH, Laserstar Technologies Corp., Morn Laser, Perfect Laser Co. Ltd., Precitec GmbH and Co. KG, Shenzhen HeroLaser Equipment Co. Ltd., Trotec Laser GmbH, TRUMPF SE Co. KG, Videojet Technologies are a few of the key vendors in the Laser Marking Equipment market.

              APAC will register the highest growth rate of 49% among the other regions. Therefore, the Laser Marking Equipment market in APAC is expected to garner significant business opportunities for the vendors during the forecast period.

              US, China, Germany, Japan, UK

              • Increasing in automation in laser marking equipmentCompanies are shifting to automation to meet the desired high standards for quality is the driving factor this market.
              • which is one of the results of globalization and the increasing population. Investments in the process automation market in the US are increasing and are projected to reach $30 billion by 2021 is the driving factor this market.
              • indicating a growth rate of approximately 5%. This growth will primarily be witnessed in sectors such as software is the driving factor this market.
              • hardware is the driving factor this market.
              • services is the driving factor this market.
              • technology is the driving factor this market.
              • and the communication protocol used in automation. Many companies implement process automation to enhance their productivity and increase profit margins. Considering the above factors is the driving factor this market.
              • companies benefit due to the enhancement in the overall efficiency that automation brings. Automation ensures that a company can save on labor costs (as many automated systems can run 24/7) as well as increase efficiency. However is the driving factor this market.
              • the downside of automation is the high operational costs of these systems and equipment. Automation also aids in problem-solving as it can respond to critical issues at hand in a better way. While it may seem that this task is not likely to be designed for an automation system is the driving factor this market.
              • the setting up of a system of checks can aid in troubleshooting and result in more effective task management. In an automated system is the driving factor this market.
              • when a problem arises is the driving factor this market.
              • the system automatically notifies and alerts the appropriate personnel needed to rectify the fault is the driving factor this market.
              • unlike in the traditional system is the driving factor this market.
              • where the task is passed on along the chain till it reaches the correct person. Therefore is the driving factor this market.
              • automation enables the prioritization of the workflow and allows professionals to become more efficient and flexible in times of emergency. Another advantage of automated equipment and robotics is the consistency of the final manufactured product is the driving factor this market.
              • as automation eliminates the possibility of human error that can affect the overall production quality in manufacturing. Automation enables the careful control and manipulation of manufacturing processes to maintain the quality of the products. Automation is especially invaluable in manufacturing scenarios that involve the production of components or parts in high volumes. In low-volume production is the driving factor this market.
              • however is the driving factor this market.
              • automation is not used as the expense involved in tooling and machine operations can often outweigh the overall cost of the finished products. Thus is the driving factor this market.
              • the rise in automation is one of the major drivers for the growth of the global laser marking equipment market during the forecast period. is the driving factor this market.

              The Laser Marking Equipment market vendors should focus on grabbing business opportunities from the Fiber laser machines segment as it accounted for the largest market share in the base year.