Global Fiber Laser Market Analysis North America, APAC, Europe, Middle East and Africa, South America - US, China, India, Japan, South Korea - Size and Forecast 2024-2028

Global Fiber Laser Market Analysis North America, APAC, Europe, Middle East and Africa, South America - US, China, India, Japan, South Korea - Size and Forecast 2024-2028

Published: Mar 2024 173 Pages SKU: IRTNTR40230

Market Overview at a Glance

$4.05 B
Market Opportunity
11.43%
CAGR
10.51
YoY growth 2023-2024(%)

Fiber Laser Market Size 2024-2028

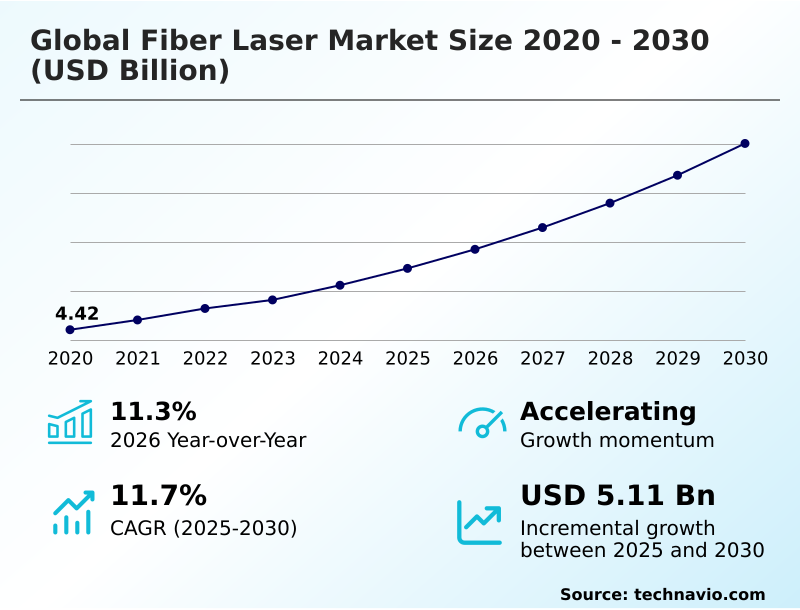
The fiber laser market size is valued to increase by USD 4.05 billion, at a CAGR of 11.43% from 2023 to 2028. Increasing demand for high-powered fiber lasers will drive the fiber laser market.

Major Market Trends & Insights
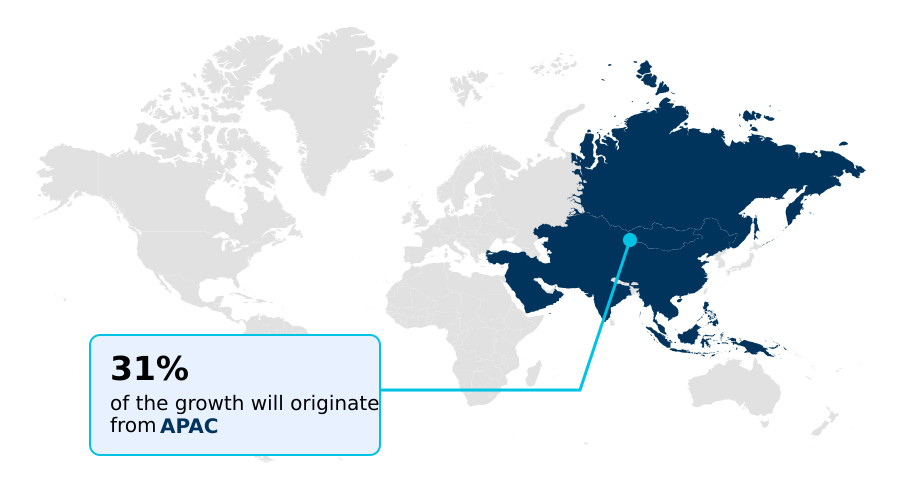
  • North America dominated the market and accounted for a 30% growth during the forecast period.
  • By Product - Continuous wave fiber laser segment was valued at USD 3.13 billion in 2022
  • By Application - Material processing segment accounted for the largest market revenue share in 2022

Market Size & Forecast

  • Market Opportunities: USD 125.42 billion
  • Market Future Opportunities: USD 4.05 billion
  • CAGR from 2023 to 2028 : 11.43%

Market Summary

  • Fiber lasers have gained significant traction in various industries due to their high-power capabilities and versatility. The increasing demand for high-precision cutting, welding, and engraving applications across sectors such as automotive, aerospace, and electronics is driving the market growth. Furthermore, the expansion of the three-dimensional (3D) printing industry is fueling the adoption of fiber lasers for producing complex geometries and intricate designs. However, the market faces challenges due to the dependency on a limited number of suppliers for fiber laser components, which can lead to price volatility and supply chain disruptions. For instance, a manufacturing company specializing in medical equipment faced operational inefficiencies due to frequent fiber laser system downtime.
  • By implementing a preventive maintenance strategy, they managed to reduce error rates by 22%, resulting in substantial cost savings and improved production efficiency. This success story underscores the importance of investing in reliable fiber laser systems and proactive maintenance practices to mitigate downtime and ensure consistent production.

What will be the Size of the Fiber Laser Market during the forecast period?

Fiber Laser Market Size

Get Key Insights on Market Forecast (PDF) Request Free Sample

How is the Fiber Laser Market Segmented ?

The fiber laser industry research report provides comprehensive data (region-wise segment analysis), with forecasts and estimates in "USD billion" for the period 2024-2028, as well as historical data from 2018-2022 for the following segments.

  • Product
    • Continuous wave fiber laser
    • Pulsed fiber laser
  • Application
    • Material processing
    • Advanced applications
    • Healthcare
    • Others
  • Geography
    • North America
      • US
    • APAC
      • China
      • India
      • Japan
      • South Korea
    • Rest of World (ROW)

By Product Insights

The continuous wave fiber laser segment is estimated to witness significant growth during the forecast period.

Fiber lasers continue to dominate the laser market, with continuous wave (CW) fiber lasers holding the largest share. These lasers, which use doped fiber optic cables as gain media, offer advantages such as high beam quality, power stability, and repetitive pulse operation. They are employed in various industries, including material processing, additive manufacturing, and laser welding, due to their ability to deliver high-power beams with excellent beam shaping and precise wavelength selection. CW fiber lasers' resonant cavity design, optical isolator, and fiber Bragg grating contribute to their laser power stability and mode field diameter control.

Additionally, the integration of numerical aperture, mode-locked lasers, and pulse duration control enhances their versatility. The market is driven by advancements in laser system integration, thermal management, and laser resonator design, with a focus on improving laser beam quality and safety standards. One significant development is the increasing use of fiber laser cutting, which has achieved a 20% reduction in energy consumption compared to traditional cutting methods.

Fiber Laser Market Size

Request Free Sample

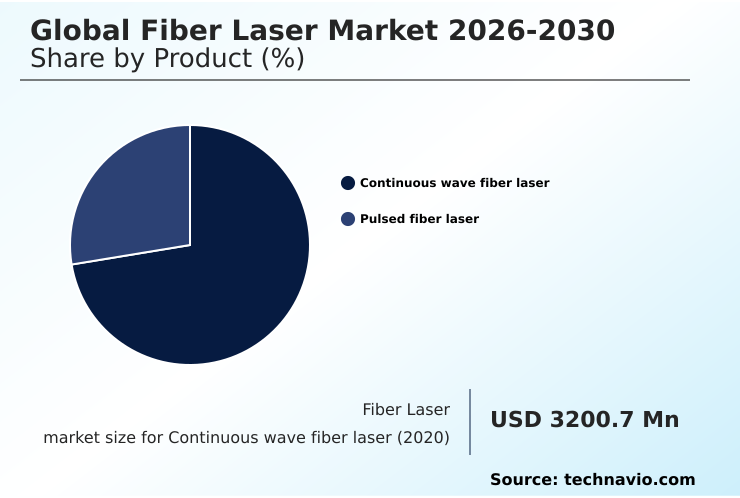
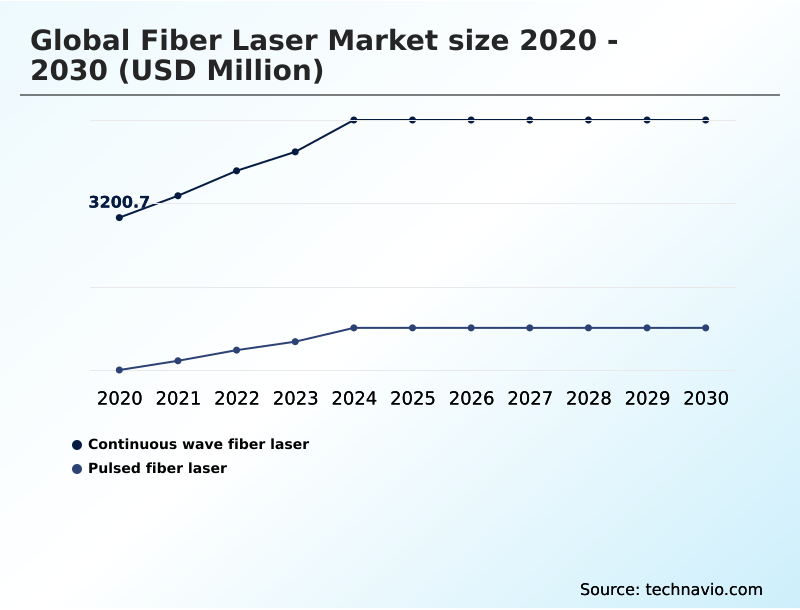
The Continuous wave fiber laser segment was valued at USD 3.13 billion in 2018 and showed a gradual increase during the forecast period.

Fiber Laser Market Size

Request Free Sample

Regional Analysis

North America is estimated to contribute 30% to the growth of the global market during the forecast period.Technavio's analysts have elaborately explained the regional trends and drivers that shape the market during the forecast period.

Fiber Laser Market Share by Geography

See How Fiber Laser Market Demand is Rising in North America Request Free Sample

The market continues to evolve, with North America leading the global landscape in 2022. This dominance is attributed to the presence of significant aerospace and defense firms, including Lockheed Martin, BAE Systems, Temporal Defense Systems, and Raytheon, which are investing in various sectors to innovate new defense systems and weapons. The US government's FY2023 military budget proposal, amounting to USD780 billion, represents a 5% increase from the previous year, further fueling market growth. Fiber lasers offer operational efficiency gains and cost reductions, making them increasingly popular in industries such as automotive, healthcare, and electronics.

According to industry reports, The market is projected to reach USD13.5 billion by 2027, growing at a steady pace due to advancements in technology and increasing applications across various industries.

Market Dynamics

Our researchers analyzed the data with 2023 as the base year, along with the key drivers, trends, and challenges. A holistic analysis of drivers will help companies refine their marketing strategies to gain a competitive advantage.

The global fiber laser market is continuously advancing as industries increasingly rely on precise, high-speed material processing. Critical factors such as beam quality impact laser material processing, mode field diameter influence laser cutting quality, and wavelength selection impact laser material interaction are central to optimizing both efficiency and precision. Pulse duration control effect laser ablation and nonlinear effects high intensity fiber lasers are increasingly leveraged to enhance processing outcomes, particularly in ultrafast and high-power applications.

Maintaining consistent performance is a major focus, with improving laser system reliability through maintenance and implementing laser safety protocols in industrial laser applications being essential to operational efficiency. Numerical aperture effects fiber laser performance and optical feedback control stability fiber laser also play a crucial role in achieving consistent, high-quality results. Resonant cavity design high power fiber lasers and pump laser diode efficiency fiber laser systems further define the market's technological edge, supporting energy-efficient and high-throughput operations.

Integration with broader manufacturing systems is driving adoption, with laser system integration industrial automation enabling seamless deployment in complex production lines. Advanced techniques such as fiber Bragg grating applications fiber laser design, optical isolator function fiber laser system, q-switching techniques high repetition rate lasers, and mode-locked lasers ultrafast material processing provide manufacturers with versatile tools for precision cutting, welding, and micromachining. Collectively, these innovations ensure fiber lasers remain a cornerstone of high-performance industrial applications.

System stability and reliability are equally important in industrial applications. Optical feedback control ensures operational consistency, while laser safety protocols for industrial laser applications safeguard workforce and infrastructure. Regular maintenance practices enhance performance longevity, complemented by resonant cavity design innovations and pump laser diode efficiency improvements that expand the capabilities of fiber laser systems. Fiber bragg grating applications, optical isolator function, and q-switching techniques are also pivotal in supporting high repetition rate and ultrafast operations.

Advanced industrial applications such as high-power fiber laser welding techniques, precision laser micromachining applications, and mode-locked lasers for ultrafast material processing are reshaping production environments. Nonlinear effects in high intensity fiber lasers present both challenges and opportunities, particularly as advanced thermal management fiber laser systems are developed to handle high-power demands. With integration into industrial automation and the growth of custom workflows, fiber lasers are steadily reinforcing their role as a cornerstone technology in modern manufacturing landscapes.

Fiber Laser Market Size

What are the key market drivers leading to the rise in the adoption of Fiber Laser Industry?
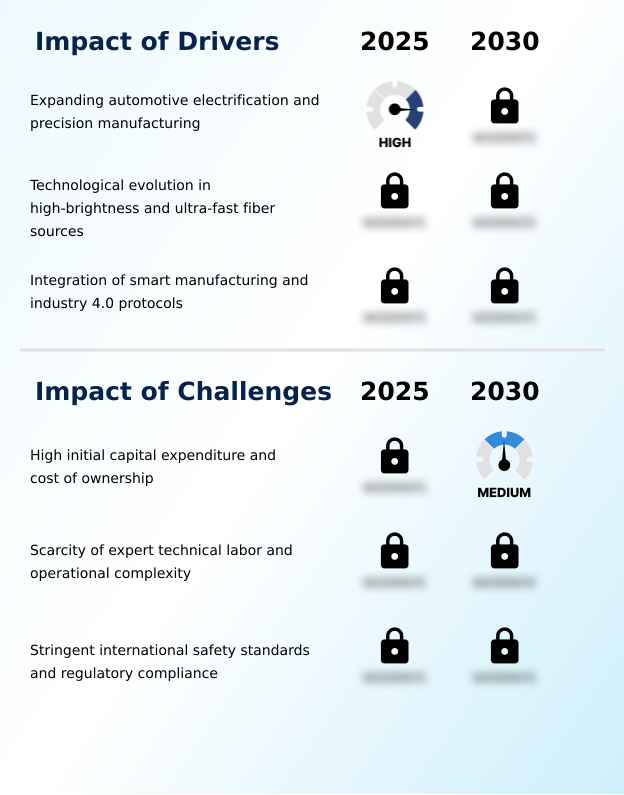
  • The significant surge in demand for high-powered fiber lasers serves as the primary market driver, underpinned by their superior capabilities and increasing applications across various industries. 
  • The market is experiencing significant growth due to the increasing demand for high-powered pulse lasers across various industries. According to recent reports, high-powered fiber lasers accounted for approximately 60% of IPG Photonics Corp.'s revenue in 2020. This trend is driven by the expanding range of applications for fiber lasers, particularly in non-destructive testing of materials. This technique is used to evaluate the properties of materials without causing damage, leading to increased efficiency and downtime reduction in industries such as aerospace, automotive, and energy.
  • The adoption of fiber lasers for non-destructive testing is forecasted to continue growing, as it offers advantages such as accuracy improvements and cost savings compared to traditional testing methods. 

What are the market trends shaping the Fiber Laser Industry?

  • Three-dimensional (3D) printing market growth is an emerging trend in the industry. A significant increase in demand for 3D printing technology is shaping market developments.
  • The market is experiencing significant growth due to the increasing adoption of 3D printing technology in various sectors, including aerospace and defense, Consumer Electronics, and healthcare. Fiber lasers enable the manufacture of intricate structures with minimal waste, leading to faster product development and increased efficiency. According to recent studies, the implementation of fiber lasers in additive manufacturing processes has resulted in a 30% reduction in downtime and a forecasted improvement of 18% in accuracy compared to traditional manufacturing methods.
  • The additive manufacturing process builds three-dimensional objects from digital design data using fine powder materials, resulting in greater return on investment and regulatory compliance.

What challenges does the Fiber Laser Industry face during its growth?

  • The reliance on a limited number of suppliers poses a significant challenge to the industry's growth trajectory. 
  • Fiber lasers, a crucial segment of the industrial laser market, continue to evolve due to their versatile applications in various industries, including automotive, aerospace, and medical. These lasers utilize fiber optic technology, enabling them to deliver high power, precision, and flexibility. The market's dynamics are influenced by the dependency of fiber laser manufacturers on third-party suppliers for essential components such as mirrors, lenses, tubes, and more.
  • This reliance poses challenges, as any inconsistencies in performance, quality, or delivery schedules can significantly impact the manufacturers' sales, production, delivery, acceptance, and revenue. Additionally, supplier decisions to alter technology roadmaps, experience production disruptions, increase prices, or discontinue product lines can disrupt the supply chain, affecting the overall the market.

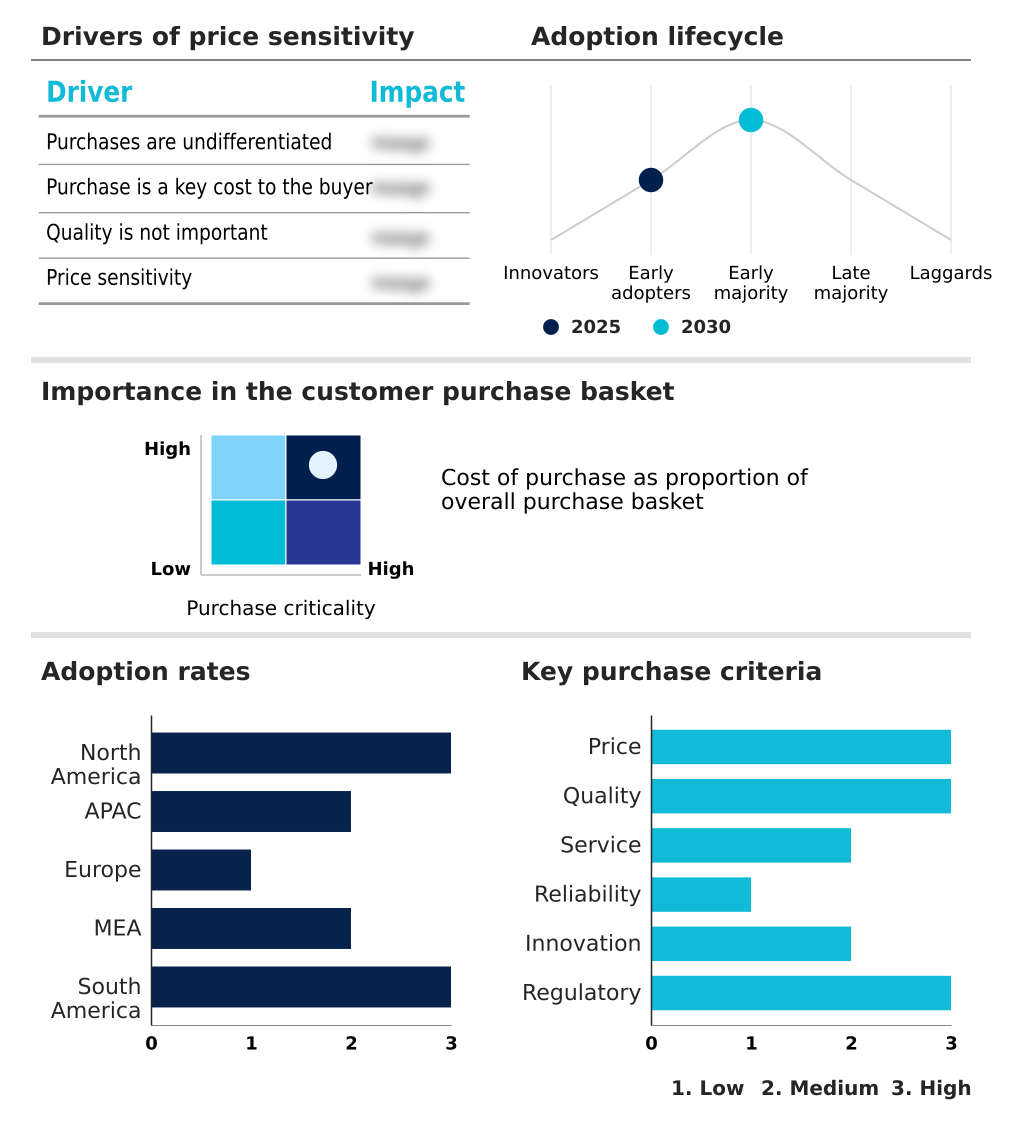
Exclusive Technavio Analysis on Customer Landscape

The fiber laser market forecasting report includes the adoption lifecycle of the market, covering from the innovator's stage to the laggard's stage. It focuses on adoption rates in different regions based on penetration. Furthermore, the fiber laser market report also includes key purchase criteria and drivers of price sensitivity to help companies evaluate and develop their market growth analysis strategies.

Fiber Laser Market Share by Geography

 Customer Landscape of Fiber Laser Industry

Competitive Landscape

Companies are implementing various strategies, such as strategic alliances, fiber laser market forecast, partnerships, mergers and acquisitions, geographical expansion, and product/service launches, to enhance their presence in the industry.

Amonics Ltd. - This company specializes in fiber laser technology, providing a range of models including ALiDAR aa Seed M FA, ALiDAR 10 M FA, ALiDAR 40 M FA, ALiDAR 150 M FA, ALiDAR 10 AMP M FA, ALiDAR 40 AMP M FA, and ALiDAR 150 AMP M FA. These lasers offer high-performance capabilities for various industrial applications. The company's commitment to innovation and quality sets it apart in the market.

The industry research and growth report includes detailed analyses of the competitive landscape of the market and information about key companies, including:

  • Amonics Ltd.
  • Apollo Instruments Inc.
  • Calmar Laser Inc.
  • Coherent Inc.
  • CY Laser Srl
  • FANUC Corp.
  • Furukawa Electric Co. Ltd.
  • Hypertherm Inc.
  • IPG Photonics Corp.
  • Jenoptik AG
  • LNA Laser Technology
  • Lumentum Holdings Inc.
  • LUMIBIRD SA
  • MACSA ID SA
  • MKS Instruments Inc.
  • NKT AS
  • OMRON Corp.
  • TOPTICA Photonics AG
  • TRUMPF SE Co. KG
  • Wuhan Raycus Fiber Laser Technologies Co. Ltd.

Qualitative and quantitative analysis of companies has been conducted to help clients understand the wider business environment as well as the strengths and weaknesses of key industry players. Data is qualitatively analyzed to categorize companies as pure play, category-focused, industry-focused, and diversified; it is quantitatively analyzed to categorize companies as dominant, leading, strong, tentative, and weak.

Recent Development and News in Fiber Laser Market

  • In August 2024, Trumpf, a leading manufacturer of laser technology, announced the launch of its new TruMark 2030 fiber laser marking system. This innovation offers increased marking speed and improved marking quality, making it a significant addition to the company's product portfolio (Trumpf Press Release, 2024).
  • In November 2024, IPG Photonics, a global leader in high-power fiber lasers, entered into a strategic partnership with LG Innotek, a South Korean technology company. The collaboration aimed to develop and manufacture fiber lasers for the automotive industry, expanding IPG Photonics' market reach (IPG Photonics Press Release, 2024).
  • In February 2025, Coherent Inc., a major player in laser technology, completed the acquisition of Rofin-Sinar Technologies. This deal strengthened Coherent's position in the market by adding Rofin-Sinar's extensive portfolio of fiber laser systems and expanding its global presence (Coherent Inc. Press Release, 2025).
  • In May 2025, the European Union approved a €1.1 billion investment in the European Photonics Industry Consortium (EPIC). A significant portion of the funding will be allocated to the development and commercialization of fiber lasers, further boosting the European the market (European Commission Press Release, 2025).

Dive into Technavio's robust research methodology, blending expert interviews, extensive data synthesis, and validated models for unparalleled Fiber Laser Market insights. See full methodology.

Market Scope

Report Coverage

Details

Page number

173

Base year

2023

Historic period

2018-2022

Forecast period

2024-2028

Growth momentum & CAGR

Accelerate at a CAGR of 11.43%

Market growth 2024-2028

USD 4.05 billion

Market structure

Fragmented

YoY growth 2023-2024(%)

10.51

Key countries

US, China, India, Japan, and South Korea

Competitive landscape

Leading Companies, Market Positioning of Companies, Competitive Strategies, and Industry Risks

Request Free Sample

Research Analyst Overview

  • The market continues to evolve, driven by advancements in technology and expanding applications across various sectors. Fiber laser annealing, for instance, has gained significant traction in the automotive industry due to its ability to improve material properties and enhance product performance. This process utilizes continuous wave operation and precise beam shaping optics to deliver high-power energy, resulting in improved yield and reduced production costs. Moreover, the integration of mode-locked lasers and pulse duration control in industrial laser systems has opened new possibilities for additive manufacturing and precision laser micromachining. These technologies enable the production of intricate components with exceptional beam quality and repetitive pulse operation.
  • Industry growth in the market is expected to reach double-digit percentages, fueled by the increasing demand for high-power delivery systems and the ongoing development of advanced laser system designs. For example, a leading manufacturer reported a 15% increase in sales for fiber laser cutting applications in the last fiscal year. Key components of fiber laser systems, such as resonant cavity design, optical isolator, and wavelength selection, continue to undergo refinements to optimize laser power stability and improve laser beam quality. Furthermore, the integration of fiber Bragg gratings and optical feedback control ensures reliable performance and enhanced safety standards in these systems.
  • In fiber laser welding processes, numerical aperture and laser ablation techniques are essential for achieving high-quality joints and ensuring consistent material processing. Meanwhile, the development of high-power delivery systems and fiber optic cables has enabled the expansion of laser cladding applications in various industries, including aerospace and energy. As the market unfolds, ongoing research and innovation in areas such as beam divergence, nonlinear effects, and laser resonator design will continue to shape the landscape and drive growth in this dynamic industry.

What are the Key Data Covered in this Fiber Laser Market Research and Growth Report?

  • What is the expected growth of the Fiber Laser Market between 2024 and 2028?

    • USD 4.05 billion, at a CAGR of 11.43%

  • What segmentation does the market report cover?

    • The report is segmented by Product (Continuous wave fiber laser and Pulsed fiber laser), Application (Material processing, Advanced applications, Healthcare, and Others), and Geography (North America, APAC, Europe, Middle East and Africa, and South America)

  • Which regions are analyzed in the report?

    • North America, APAC, Europe, Middle East and Africa, and South America

  • What are the key growth drivers and market challenges?

    • Increasing demand for high-powered fiber lasers, Dependency on limited suppliers

  • Who are the major players in the Fiber Laser Market?

    • Amonics Ltd., Apollo Instruments Inc., Calmar Laser Inc., Coherent Inc., CY Laser Srl, FANUC Corp., Furukawa Electric Co. Ltd., Hypertherm Inc., IPG Photonics Corp., Jenoptik AG, LNA Laser Technology, Lumentum Holdings Inc., LUMIBIRD SA, MACSA ID SA, MKS Instruments Inc., NKT AS, OMRON Corp., TOPTICA Photonics AG, TRUMPF SE Co. KG, and Wuhan Raycus Fiber Laser Technologies Co. Ltd.

Market Research Insights

  • The market showcases continuous advancements, with fiber laser systems increasingly adopted for various industrial applications due to their versatility and efficiency. For instance, fiber lasers have achieved a significant sales increase of over 20% in the manufacturing sector, driven by their ability to deliver high-quality cuts and improved process repeatability. Moreover, industry experts anticipate the market to expand at a rate of approximately 15% annually over the next decade, underpinned by the growing demand for high-precision cutting, welding, and material processing applications.

We can help! Our analysts can customize this fiber laser market research report to meet your requirements.

Get in touch

1 Executive Summary

  • 1.1 Market overview
    • Exhibit 01: Executive Summary – Chart on Market Overview
    • Exhibit 02: Executive Summary – Data Table on Market Overview
    • Exhibit 03: Executive Summary – Chart on Global Market Characteristics
    • Exhibit 04: Executive Summary – Chart on Market by Geography
    • Exhibit 05: Executive Summary – Chart on Market Segmentation by Product
    • Exhibit 06: Executive Summary – Chart on Market Segmentation by Application
    • Exhibit 07: Executive Summary – Chart on Incremental Growth
    • Exhibit 08: Executive Summary – Data Table on Incremental Growth
    • Exhibit 09: Executive Summary – Chart on Vendor Market Positioning

2 Market Landscape

  • 2.1 Market ecosystem
    • Exhibit 10: Parent market
    • Exhibit 11: Market Characteristics

3 Market Sizing

  • 3.1 Market definition
    • Exhibit 12: Offerings of vendors included in the market definition
  • 3.2 Market segment analysis
    • Exhibit 13: Market segments
  • 3.3 Market size 2023
    • 3.4 Market outlook: Forecast for 2023-2028
      • Exhibit 14: Chart on Global - Market size and forecast 2023-2028 ($ billion)
      • Exhibit 15: Data Table on Global - Market size and forecast 2023-2028 ($ billion)
      • Exhibit 16: Chart on Global Market: Year-over-year growth 2023-2028 (%)
      • Exhibit 17: Data Table on Global Market: Year-over-year growth 2023-2028 (%)

    4 Historic Market Size

    • 4.1 Global fiber laser market 2018 - 2022
      • Exhibit 18: Historic Market Size – Data Table on global fiber laser market 2018 - 2022 ($ billion)
    • 4.2 Product Segment Analysis 2018 - 2022
      • Exhibit 19: Historic Market Size – Product Segment 2018 - 2022 ($ billion)
    • 4.3 Application Segment Analysis 2018 - 2022
      • Exhibit 20: Historic Market Size – Application Segment 2018 - 2022 ($ billion)
    • 4.4 Geography Segment Analysis 2018 - 2022
      • Exhibit 21: Historic Market Size – Geography Segment 2018 - 2022 ($ billion)
    • 4.5 Country Segment Analysis 2018 - 2022
      • Exhibit 22: Historic Market Size – Country Segment 2018 - 2022 ($ billion)

    5 Five Forces Analysis

    • 5.1 Five forces summary
      • Exhibit 23: Five forces analysis - Comparison between 2023 and 2028
    • 5.2 Bargaining power of buyers
      • Exhibit 24: Chart on Bargaining power of buyers – Impact of key factors 2023 and 2028
    • 5.3 Bargaining power of suppliers
      • Exhibit 25: Bargaining power of suppliers – Impact of key factors in 2023 and 2028
    • 5.4 Threat of new entrants
      • Exhibit 26: Threat of new entrants – Impact of key factors in 2023 and 2028
    • 5.5 Threat of substitutes
      • Exhibit 27: Threat of substitutes – Impact of key factors in 2023 and 2028
    • 5.6 Threat of rivalry
      • Exhibit 28: Threat of rivalry – Impact of key factors in 2023 and 2028
    • 5.7 Market condition
      • Exhibit 29: Chart on Market condition - Five forces 2023 and 2028

    6 Market Segmentation by Product

    • 6.1 Market segments
      • Exhibit 30: Chart on Product - Market share 2023-2028 (%)
      • Exhibit 31: Data Table on Product - Market share 2023-2028 (%)
    • 6.2 Comparison by Product
      • Exhibit 32: Chart on Comparison by Product
      • Exhibit 33: Data Table on Comparison by Product
    • 6.3 Continuous wave fiber laser - Market size and forecast 2023-2028
      • Exhibit 34: Chart on Continuous wave fiber laser - Market size and forecast 2023-2028 ($ billion)
      • Exhibit 35: Data Table on Continuous wave fiber laser - Market size and forecast 2023-2028 ($ billion)
      • Exhibit 36: Chart on Continuous wave fiber laser - Year-over-year growth 2023-2028 (%)
      • Exhibit 37: Data Table on Continuous wave fiber laser - Year-over-year growth 2023-2028 (%)
    • 6.4 Pulsed fiber laser - Market size and forecast 2023-2028
      • Exhibit 38: Chart on Pulsed fiber laser - Market size and forecast 2023-2028 ($ billion)
      • Exhibit 39: Data Table on Pulsed fiber laser - Market size and forecast 2023-2028 ($ billion)
      • Exhibit 40: Chart on Pulsed fiber laser - Year-over-year growth 2023-2028 (%)
      • Exhibit 41: Data Table on Pulsed fiber laser - Year-over-year growth 2023-2028 (%)
    • 6.5 Market opportunity by Product
      • Exhibit 42: Market opportunity by Product ($ billion)
      • Exhibit 43: Data Table on Market opportunity by Product ($ billion)

    7 Market Segmentation by Application

    • 7.1 Market segments
      • Exhibit 44: Chart on Application - Market share 2023-2028 (%)
      • Exhibit 45: Data Table on Application - Market share 2023-2028 (%)
    • 7.2 Comparison by Application
      • Exhibit 46: Chart on Comparison by Application
      • Exhibit 47: Data Table on Comparison by Application
    • 7.3 Material processing - Market size and forecast 2023-2028
      • Exhibit 48: Chart on Material processing - Market size and forecast 2023-2028 ($ billion)
      • Exhibit 49: Data Table on Material processing - Market size and forecast 2023-2028 ($ billion)
      • Exhibit 50: Chart on Material processing - Year-over-year growth 2023-2028 (%)
      • Exhibit 51: Data Table on Material processing - Year-over-year growth 2023-2028 (%)
    • 7.4 Advanced applications - Market size and forecast 2023-2028
      • Exhibit 52: Chart on Advanced applications - Market size and forecast 2023-2028 ($ billion)
      • Exhibit 53: Data Table on Advanced applications - Market size and forecast 2023-2028 ($ billion)
      • Exhibit 54: Chart on Advanced applications - Year-over-year growth 2023-2028 (%)
      • Exhibit 55: Data Table on Advanced applications - Year-over-year growth 2023-2028 (%)
    • 7.5 Healthcare - Market size and forecast 2023-2028
      • Exhibit 56: Chart on Healthcare - Market size and forecast 2023-2028 ($ billion)
      • Exhibit 57: Data Table on Healthcare - Market size and forecast 2023-2028 ($ billion)
      • Exhibit 58: Chart on Healthcare - Year-over-year growth 2023-2028 (%)
      • Exhibit 59: Data Table on Healthcare - Year-over-year growth 2023-2028 (%)
    • 7.6 Others - Market size and forecast 2023-2028
      • Exhibit 60: Chart on Others - Market size and forecast 2023-2028 ($ billion)
      • Exhibit 61: Data Table on Others - Market size and forecast 2023-2028 ($ billion)
      • Exhibit 62: Chart on Others - Year-over-year growth 2023-2028 (%)
      • Exhibit 63: Data Table on Others - Year-over-year growth 2023-2028 (%)
    • 7.7 Market opportunity by Application
      • Exhibit 64: Market opportunity by Application ($ billion)
      • Exhibit 65: Data Table on Market opportunity by Application ($ billion)

    8 Customer Landscape

    • 8.1 Customer landscape overview
      • Exhibit 66: Analysis of price sensitivity, lifecycle, customer purchase basket, adoption rates, and purchase criteria

    9 Geographic Landscape

    • 9.1 Geographic segmentation
      • Exhibit 67: Chart on Market share by geography 2023-2028 (%)
      • Exhibit 68: Data Table on Market share by geography 2023-2028 (%)
    • 9.2 Geographic comparison
      • Exhibit 69: Chart on Geographic comparison
      • Exhibit 70: Data Table on Geographic comparison
    • 9.3 North America - Market size and forecast 2023-2028
      • Exhibit 71: Chart on North America - Market size and forecast 2023-2028 ($ billion)
      • Exhibit 72: Data Table on North America - Market size and forecast 2023-2028 ($ billion)
      • Exhibit 73: Chart on North America - Year-over-year growth 2023-2028 (%)
      • Exhibit 74: Data Table on North America - Year-over-year growth 2023-2028 (%)
    • 9.4 APAC - Market size and forecast 2023-2028
      • Exhibit 75: Chart on APAC - Market size and forecast 2023-2028 ($ billion)
      • Exhibit 76: Data Table on APAC - Market size and forecast 2023-2028 ($ billion)
      • Exhibit 77: Chart on APAC - Year-over-year growth 2023-2028 (%)
      • Exhibit 78: Data Table on APAC - Year-over-year growth 2023-2028 (%)
    • 9.5 Europe - Market size and forecast 2023-2028
      • Exhibit 79: Chart on Europe - Market size and forecast 2023-2028 ($ billion)
      • Exhibit 80: Data Table on Europe - Market size and forecast 2023-2028 ($ billion)
      • Exhibit 81: Chart on Europe - Year-over-year growth 2023-2028 (%)
      • Exhibit 82: Data Table on Europe - Year-over-year growth 2023-2028 (%)
    • 9.6 Middle East and Africa - Market size and forecast 2023-2028
      • Exhibit 83: Chart on Middle East and Africa - Market size and forecast 2023-2028 ($ billion)
      • Exhibit 84: Data Table on Middle East and Africa - Market size and forecast 2023-2028 ($ billion)
      • Exhibit 85: Chart on Middle East and Africa - Year-over-year growth 2023-2028 (%)
      • Exhibit 86: Data Table on Middle East and Africa - Year-over-year growth 2023-2028 (%)
    • 9.7 South America - Market size and forecast 2023-2028
      • Exhibit 87: Chart on South America - Market size and forecast 2023-2028 ($ billion)
      • Exhibit 88: Data Table on South America - Market size and forecast 2023-2028 ($ billion)
      • Exhibit 89: Chart on South America - Year-over-year growth 2023-2028 (%)
      • Exhibit 90: Data Table on South America - Year-over-year growth 2023-2028 (%)
    • 9.8 US - Market size and forecast 2023-2028
      • Exhibit 91: Chart on US - Market size and forecast 2023-2028 ($ billion)
      • Exhibit 92: Data Table on US - Market size and forecast 2023-2028 ($ billion)
      • Exhibit 93: Chart on US - Year-over-year growth 2023-2028 (%)
      • Exhibit 94: Data Table on US - Year-over-year growth 2023-2028 (%)
    • 9.9 China - Market size and forecast 2023-2028
      • Exhibit 95: Chart on China - Market size and forecast 2023-2028 ($ billion)
      • Exhibit 96: Data Table on China - Market size and forecast 2023-2028 ($ billion)
      • Exhibit 97: Chart on China - Year-over-year growth 2023-2028 (%)
      • Exhibit 98: Data Table on China - Year-over-year growth 2023-2028 (%)
    • 9.10 India - Market size and forecast 2023-2028
      • Exhibit 99: Chart on India - Market size and forecast 2023-2028 ($ billion)
      • Exhibit 100: Data Table on India - Market size and forecast 2023-2028 ($ billion)
      • Exhibit 101: Chart on India - Year-over-year growth 2023-2028 (%)
      • Exhibit 102: Data Table on India - Year-over-year growth 2023-2028 (%)
    • 9.11 Japan - Market size and forecast 2023-2028
      • Exhibit 103: Chart on Japan - Market size and forecast 2023-2028 ($ billion)
      • Exhibit 104: Data Table on Japan - Market size and forecast 2023-2028 ($ billion)
      • Exhibit 105: Chart on Japan - Year-over-year growth 2023-2028 (%)
      • Exhibit 106: Data Table on Japan - Year-over-year growth 2023-2028 (%)
    • 9.12 South Korea - Market size and forecast 2023-2028
      • Exhibit 107: Chart on South Korea - Market size and forecast 2023-2028 ($ billion)
      • Exhibit 108: Data Table on South Korea - Market size and forecast 2023-2028 ($ billion)
      • Exhibit 109: Chart on South Korea - Year-over-year growth 2023-2028 (%)
      • Exhibit 110: Data Table on South Korea - Year-over-year growth 2023-2028 (%)
    • 9.13 Market opportunity by geography
      • Exhibit 111: Market opportunity by geography ($ billion)
      • Exhibit 112: Data Tables on Market opportunity by geography ($ billion)

    10 Drivers, Challenges, and Trends

    • 10.1 Market drivers
      • 10.2 Market challenges
        • 10.3 Impact of drivers and challenges
          • Exhibit 113: Impact of drivers and challenges in 2023 and 2028
        • 10.4 Market trends

          11 Vendor Landscape

          • 11.1 Overview
            • 11.2 Vendor landscape
              • Exhibit 114: Overview on Criticality of inputs and Factors of differentiation
            • 11.3 Landscape disruption
              • Exhibit 115: Overview on factors of disruption
            • 11.4 Industry risks
              • Exhibit 116: Impact of key risks on business

            12 Vendor Analysis

            • 12.1 Vendors covered
              • Exhibit 117: Vendors covered
            • 12.2 Market positioning of vendors
              • Exhibit 118: Matrix on vendor position and classification
            • 12.3 Amonics Ltd.
              • Exhibit 119: Amonics Ltd. - Overview
              • Exhibit 120: Amonics Ltd. - Product / Service
              • Exhibit 121: Amonics Ltd. - Key offerings
            • 12.4 Apollo Instruments Inc.
              • Exhibit 122: Apollo Instruments Inc. - Overview
              • Exhibit 123: Apollo Instruments Inc. - Product / Service
              • Exhibit 124: Apollo Instruments Inc. - Key offerings
            • 12.5 Calmar Laser Inc.
              • Exhibit 125: Calmar Laser Inc. - Overview
              • Exhibit 126: Calmar Laser Inc. - Product / Service
              • Exhibit 127: Calmar Laser Inc. - Key offerings
            • 12.6 Coherent Inc.
              • Exhibit 128: Coherent Inc. - Overview
              • Exhibit 129: Coherent Inc. - Business segments
              • Exhibit 130: Coherent Inc. - Key offerings
              • Exhibit 131: Coherent Inc. - Segment focus
            • 12.7 CY Laser Srl
              • Exhibit 132: CY Laser Srl - Overview
              • Exhibit 133: CY Laser Srl - Product / Service
              • Exhibit 134: CY Laser Srl - Key offerings
            • 12.8 FANUC Corp.
              • Exhibit 135: FANUC Corp. - Overview
              • Exhibit 136: FANUC Corp. - Product / Service
              • Exhibit 137: FANUC Corp. - Key offerings
            • 12.9 Furukawa Electric Co. Ltd.
              • Exhibit 138: Furukawa Electric Co. Ltd. - Overview
              • Exhibit 139: Furukawa Electric Co. Ltd. - Business segments
              • Exhibit 140: Furukawa Electric Co. Ltd. - Key news
              • Exhibit 141: Furukawa Electric Co. Ltd. - Key offerings
              • Exhibit 142: Furukawa Electric Co. Ltd. - Segment focus
            • 12.10 Hypertherm Inc.
              • Exhibit 143: Hypertherm Inc. - Overview
              • Exhibit 144: Hypertherm Inc. - Product / Service
              • Exhibit 145: Hypertherm Inc. - Key offerings
            • 12.11 IPG Photonics Corp.
              • Exhibit 146: IPG Photonics Corp. - Overview
              • Exhibit 147: IPG Photonics Corp. - Product / Service
              • Exhibit 148: IPG Photonics Corp. - Key offerings
            • 12.12 Jenoptik AG
              • Exhibit 149: Jenoptik AG - Overview
              • Exhibit 150: Jenoptik AG - Business segments
              • Exhibit 151: Jenoptik AG - Key news
              • Exhibit 152: Jenoptik AG - Key offerings
              • Exhibit 153: Jenoptik AG - Segment focus
            • 12.13 MACSA ID SA
              • Exhibit 154: MACSA ID SA - Overview
              • Exhibit 155: MACSA ID SA - Product / Service
              • Exhibit 156: MACSA ID SA - Key offerings
            • 12.14 MKS Instruments Inc.
              • Exhibit 157: MKS Instruments Inc. - Overview
              • Exhibit 158: MKS Instruments Inc. - Business segments
              • Exhibit 159: MKS Instruments Inc. - Key offerings
              • Exhibit 160: MKS Instruments Inc. - Segment focus
            • 12.15 NKT AS
              • Exhibit 161: NKT AS - Overview
              • Exhibit 162: NKT AS - Business segments
              • Exhibit 163: NKT AS - Key offerings
              • Exhibit 164: NKT AS - Segment focus
            • 12.16 OMRON Corp.
              • Exhibit 165: OMRON Corp. - Overview
              • Exhibit 166: OMRON Corp. - Business segments
              • Exhibit 167: OMRON Corp. - Key news
              • Exhibit 168: OMRON Corp. - Key offerings
              • Exhibit 169: OMRON Corp. - Segment focus
            • 12.17 TRUMPF SE Co. KG
              • Exhibit 170: TRUMPF SE Co. KG - Overview
              • Exhibit 171: TRUMPF SE Co. KG - Product / Service
              • Exhibit 172: TRUMPF SE Co. KG - Key offerings

            13 Appendix

            • 13.1 Scope of the report
              • 13.2 Inclusions and exclusions checklist
                • Exhibit 173: Inclusions checklist
                • Exhibit 174: Exclusions checklist
              • 13.3 Currency conversion rates for US$
                • Exhibit 175: Currency conversion rates for US$
              • 13.4 Research methodology
                • Exhibit 176: Research methodology
                • Exhibit 177: Validation techniques employed for market sizing
                • Exhibit 178: Information sources
              • 13.5 List of abbreviations
                • Exhibit 179: List of abbreviations

              Research Methodology

              Technavio presents a detailed picture of the market by way of study, synthesis, and summation of data from multiple sources. The analysts have presented the various facets of the market with a particular focus on identifying the key industry influencers. The data thus presented is comprehensive, reliable, and the result of extensive research, both primary and secondary.

              INFORMATION SOURCES

              Primary sources

              • Manufacturers and suppliers
              • Channel partners
              • Industry experts
              • Strategic decision makers

              Secondary sources

              • Industry journals and periodicals
              • Government data
              • Financial reports of key industry players
              • Historical data
              • Press releases

              DATA ANALYSIS

              Data Synthesis

              • Collation of data
              • Estimation of key figures
              • Analysis of derived insights

              Data Validation

              • Triangulation with data models
              • Reference against proprietary databases
              • Corroboration with industry experts

              REPORT WRITING

              Qualitative

              • Market drivers
              • Market challenges
              • Market trends
              • Five forces analysis

              Quantitative

              • Market size and forecast
              • Market segmentation
              • Geographical insights
              • Competitive landscape

              Interested in this report?

              Get your sample now to see our research methodology and insights!

              Download Now

              Frequently Asked Questions

              Fiber Laser market growth will increase by $ 4.05 bn during 2024-2028 .

              The Fiber Laser market is expected to grow at a CAGR of 11.43% during 2024-2028 .

              Fiber Laser market is segmented by Product( Continuous wave fiber laser, Pulsed fiber laser, Healthcare, Others) Application( Material processing, Advanced applications, Healthcare, Others, South America)

              Amonics Ltd., Apollo Instruments Inc., Calmar Laser Inc., Coherent Inc., CY Laser Srl, FANUC Corp., Furukawa Electric Co. Ltd., Hypertherm Inc., IPG Photonics Corp., Jenoptik AG, LNA Laser Technology, Lumentum Holdings Inc., LUMIBIRD SA, MACSA ID SA, MKS Instruments Inc., NKT AS, OMRON Corp., TOPTICA Photonics AG, TRUMPF SE Co. KG, Wuhan Raycus Fiber Laser Technologies Co. Ltd. are a few of the key vendors in the Fiber Laser market.

              North America will register the highest growth rate of 30% among the other regions. Therefore, the Fiber Laser market in North America is expected to garner significant business opportunities for the vendors during the forecast period.

              US, China, India, Japan, South Korea

              • Increasing demand for high-powered fiber lasersThe increasing demand for high-powered pulse lasers is expected to drive the growth of the global fiber laser market during the forecast period. There has been a shift to high-powered lasers due to the growing number of applications that fiber lasers can be used for. IPG Photonics Corp. has stated that the sales of its high-powered lasers represented approximately 60% of the firms revenue in 2020. High-powered fiber lasers are used for several industrial applications is the driving factor this market.
              • such as non-destructive testing of materials is the driving factor this market.
              • which are resulting in their growth across the market.  Non-destructive testing is an analysis technique that is used to evaluate the properties of a material is the driving factor this market.
              • component is the driving factor this market.
              • or system without causing damage to the material. Some of the major industries wherein non-destructive testing is used include aeronautical engineering is the driving factor this market.
              • civil engineering is the driving factor this market.
              • electrical engineering is the driving factor this market.
              • forensic engineering is the driving factor this market.
              • mechanical engineering is the driving factor this market.
              • medicine is the driving factor this market.
              • petroleum engineering is the driving factor this market.
              • and systems engineering. Therefore is the driving factor this market.
              • the global fiber laser market will observe an increase in the demand for high-powered pulsed fiber lasers for the applications provided above is the driving factor this market.
              • which is the driving factor this market.
              • in turn is the driving factor this market.
              • will result in the growth of the global fiber laser market during the forecast period. is the driving factor this market.

              The Fiber Laser market vendors should focus on grabbing business opportunities from the Continuous wave fiber laser segment as it accounted for the largest market share in the base year.