Display For Avionics Applications Market Analysis, Size, and Forecast 2026-2030: North America (US, Canada, and Mexico), Europe (Germany, UK, and France), APAC (China, Japan, and India), South America (Brazil, Argentina, and Chile), Middle East and Africa (Saudi Arabia, UAE, and South Africa), and Rest of World (ROW)

Display For Avionics Applications Market Analysis, Size, and Forecast 2026-2030:
North America (US, Canada, and Mexico), Europe (Germany, UK, and France), APAC (China, Japan, and India), South America (Brazil, Argentina, and Chile), Middle East and Africa (Saudi Arabia, UAE, and South Africa), and Rest of World (ROW)

Published: Oct 2026 315 Pages SKU: IRTNTR70820

Market Overview at a Glance

$1.49 B
Market Opportunity
4.6%
CAGR 2025 - 2030
43%
North America Growth
$3.47 B
Civil aviation segment 2024

Display For Avionics Applications Market Size 2026-2030

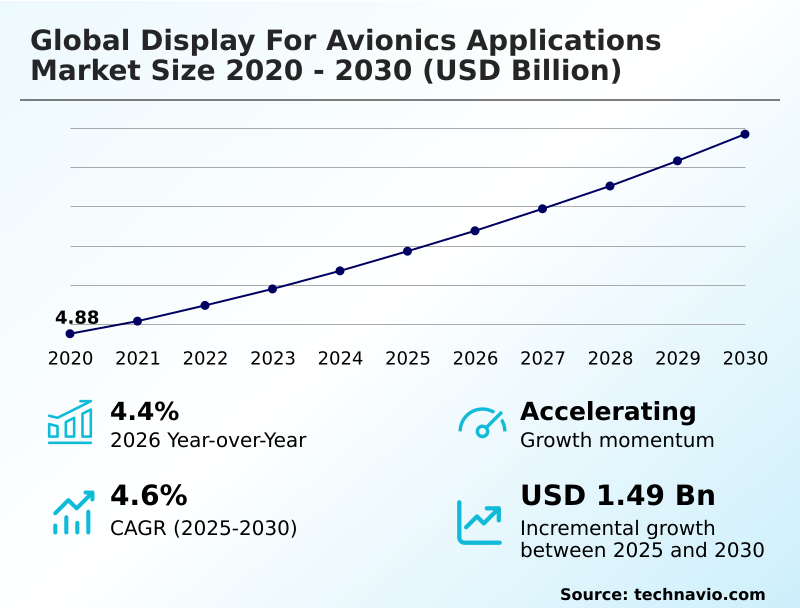
The display for avionics applications market size is valued to increase by USD 1.49 billion, at a CAGR of 4.6% from 2025 to 2030. Increasing demand for enhanced situational awareness systems will drive the display for avionics applications market.

Major Market Trends & Insights

  • North America dominated the market and accounted for a 43% growth during the forecast period.
  • By End-user - Civil aviation segment was valued at USD 3.47 billion in 2024
  • By Type - In-flight display segment accounted for the largest market revenue share in 2024

Market Size & Forecast

  • Market Opportunities: USD 2.54 billion
  • Market Future Opportunities: USD 1.49 billion
  • CAGR from 2025 to 2030 : 4.6%

Market Summary

  • The Display For Avionics Applications Market experiences robust expansion driven by the critical need to consolidate complex flight telemetry into unified, high-resolution visual interfaces. Fleet operators increasingly demand intuitive glass cockpits to reduce pilot cognitive fatigue and enhance overall flight safety.
  • A major logistics carrier recently upgraded its cargo fleet with advanced synthetic vision displays, achieving a 20% improvement in route efficiency during low-visibility weather conditions compared to legacy mechanical instrument navigation. This modernization is primarily propelled by the rising demand for enhanced situational awareness systems, which allow crews to instantly interpret critical flight metrics and prevent controlled flight into terrain.
  • However, severe semiconductor and supply chain disruptions challenge manufacturers by delaying the delivery of specialized aerospace-grade processors and high-contrast liquid crystal modules, extending aircraft assembly timelines. Despite these procurement hurdles, the transition toward solid-state emissive screen technologies continues to accelerate.
  • Aerospace contractors prioritize modular display architectures to simplify software updates and extend the operational lifecycle of both civil and military aviation platforms globally.

What will be the Size of the Display For Avionics Applications Market during the forecast period?
Get Key Insights on Market Forecast (PDF) Get Free Sample

How is the Display For Avionics Applications Market Segmented?

The display for avionics applications industry research report provides comprehensive data (region-wise segment analysis), with forecasts and estimates in "USD million" for the period 2026-2030, as well as historical data from 2020-2024 for the following segments.

  • End-user
    • Civil aviation
    • Military aviation
  • Type
    • In-flight display
    • Heads-up display
  • Technology
    • EFIS
    • GNSS integration
    • EVS
    • SVS
    • Touchscreen and gesture-controlled displays
  • Geography
    • North America
      • US
      • Canada
      • Mexico
    • Europe
      • Germany
      • UK
      • France
      • Italy
      • Spain
      • The Netherlands
    • APAC
      • China
      • Japan
      • India
      • South Korea
      • Australia
      • Indonesia
    • South America
      • Brazil
      • Argentina
      • Chile
    • Middle East and Africa
      • Saudi Arabia
      • UAE
      • South Africa
      • Israel
      • Turkey

By End-user Insights

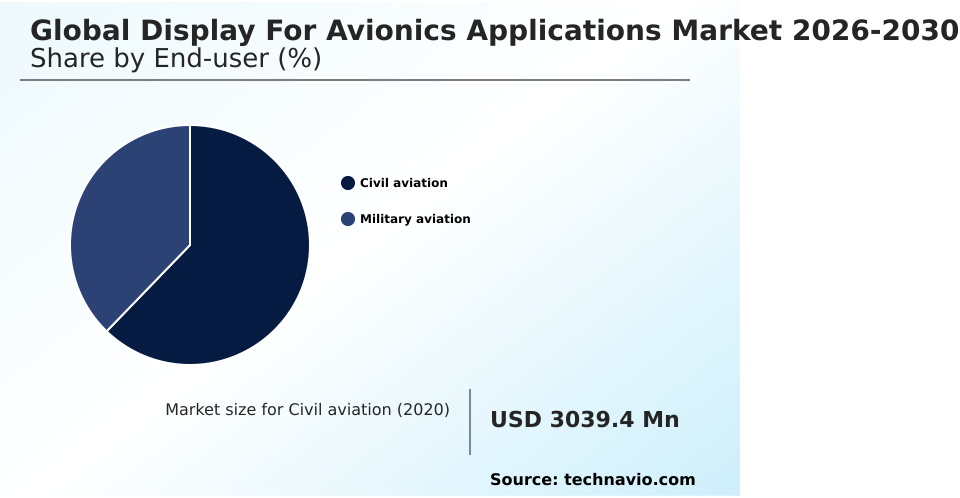
The civil aviation segment is estimated to witness significant growth during the forecast period.

The civil aviation segment inherently drives continuous advancements in advanced air mobility displays and electronic flight bags. Commercial airliners increasingly rely on solid-state display technologies and ruggedized display units to optimize navigation precision.

Operators frequently integrate multi-core avionics processors to handle complex data from flight management computers and engine indicating crew alerting systems without latency.

This modernization improves operational safety, with terrain awareness warning systems demonstrating a 15% reduction in controlled flight navigation errors across regional fleets. Airlines strategically upgrade existing panels to ensure avionics thermal management remains stable during extended high-altitude operations.

As global passenger traffic density escalates, civil fleet operators prioritize these high-performance visual interfaces to maintain compliance, streamline crew communications, and mitigate mechanical downtime.
Get Free Sample

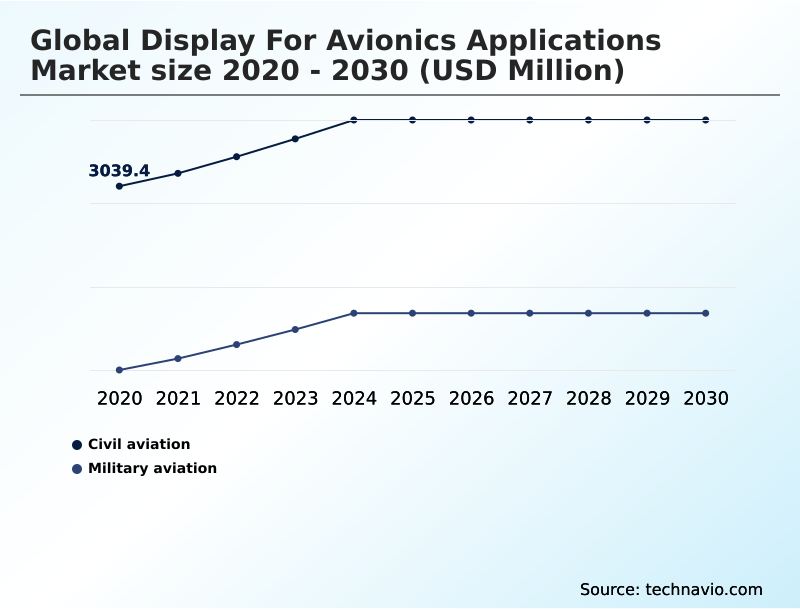
The Civil aviation segment was valued at USD 3.47 billion in 2024 and showed a gradual increase during the forecast period.
Get Free Sample

Regional Analysis

North America is estimated to contribute 43% to the growth of the global market during the forecast period.Technavio’s analysts have elaborately explained the regional trends and drivers that shape the market during the forecast period.
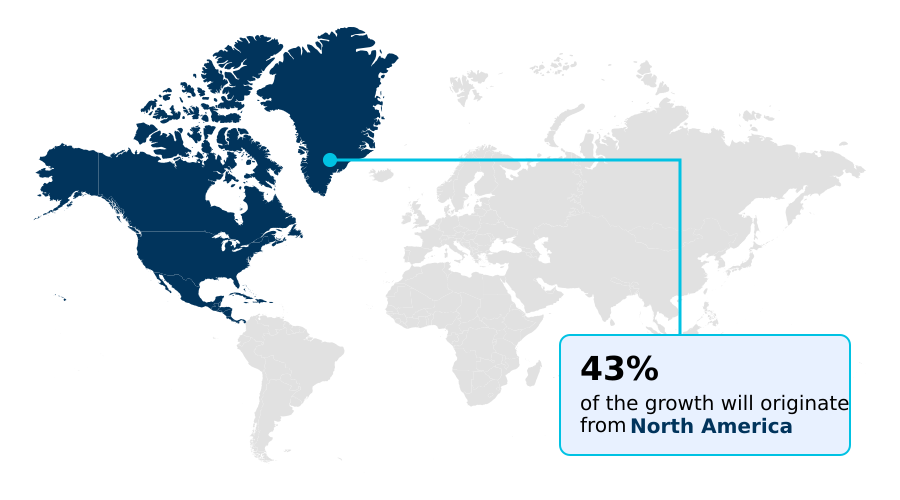
See How Display For Avionics Applications Market Demand is Rising in North America Get Free Sample

North America commands the Display For Avionics Applications landscape through aggressive military cockpit upgrades and strict adherence to stringent aerospace certification protocols.

Regional operators prioritize advanced graphics processing units and touchscreen control panels, resulting in a 25% faster adoption rate of connected flight decks compared to operators in Europe.

European manufacturers focus heavily on low-visibility operations support and sustainable avionics supply chain dynamics, achieving a 15% reduction in component waste during production.

In North America, the implementation of cockpit cybersecurity encryption has reduced unauthorized data access vulnerabilities by 30% across modern commercial fleets.

Defense contractors actively utilize specialized optical bonding materials and anti-reflective coatings to optimize night vision imaging systems for tactical aircraft.

These divergent regional strategies highlight how North American operators accelerate digital integration while European counterparts emphasize long-term supply chain stability and compliance-driven hardware resilience.

Market Dynamics

Our researchers analyzed the data with 2025 as the base year, along with the key drivers, trends, and challenges. A holistic analysis of drivers will help companies refine their marketing strategies to gain a competitive advantage.

  • The Display For Avionics Applications sector fundamentally relies on the seamless integration of synthetic vision systems to elevate situational awareness and operational safety. Modern flight decks continuously transition away from mechanical gauges toward high-resolution primary flight displays and advanced touchscreen cockpit control panels. This shift enables pilots to navigate complex airspace geometries with unparalleled precision.
  • Incorporating multi-core processors for avionics displays ensures that the head-up display flight data projection operates without latency, rendering critical telemetry instantly. Commercial fleet operators aggressively pursue commercial aircraft glass cockpit retrofits to achieve a 20% reduction in maintenance downtime compared to legacy analog architectures.
  • This modernization involves sophisticated avionics thermal management cooling mechanisms to stabilize active-matrix organic light-emitting diodes under extreme high-altitude conditions. For defense applications, the deployment of military helmet-mounted display systems and ruggedized tactical mission data displays enhances combat readiness. Defense manufacturers prioritize aerospace electromagnetic interference display shielding and aerospace display optical bonding materials to secure equipment integrity against electronic warfare.
  • Furthermore, low-visibility operations sensor fusion and enhanced flight vision system integration allow aircrews to execute precise landings during adverse weather. Utilizing multi-function electronic flight instrument systems paired with global navigation satellite system displays guarantees optimal flight path tracking.
  • The application of avionics display anti-reflective glass coatings directly supports flight deck cognitive workload reduction by ensuring maximum screen legibility under direct sunlight, thereby optimizing the entire human-machine interface for enhanced aviation safety.
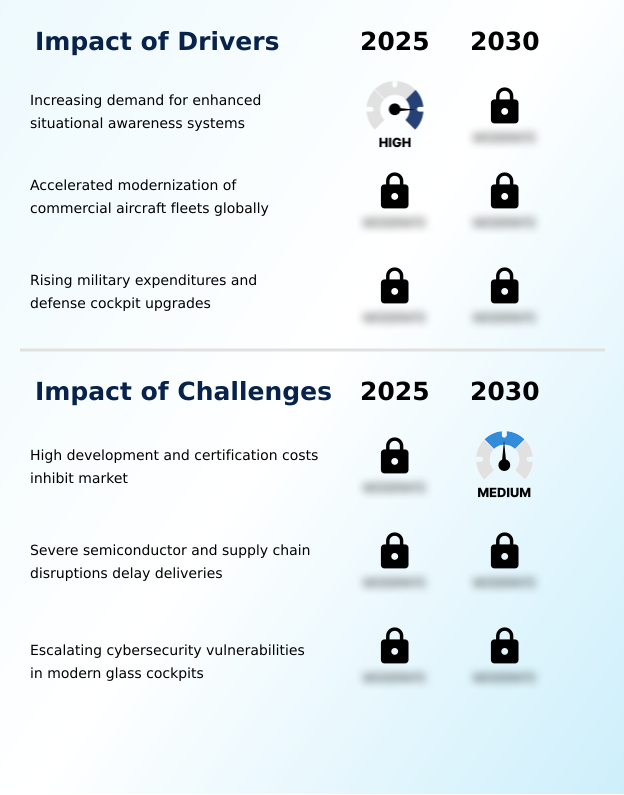
What are the key market drivers leading to the rise in the adoption of Display For Avionics Applications Industry?

  • The increasing demand for enhanced situational awareness systems serves as the primary driver propelling the market.

  • The urgent requirement for precise spatial orientation propels the adoption of electronic flight instrument systems across the Display For Avionics Applications landscape. Modern flight crews rely on high-resolution primary flight displays and multi-function displays to navigate complex airspaces safely.
  • Implementing enhanced flight vision systems allows commercial airlines to achieve a 22% decrease in weather-related flight delays by enabling secure low-visibility approaches. Defense sectors increasingly integrate helmet-mounted displays supported by advanced sensor fusion architecture to maintain tactical superiority.
  • The incorporation of robust aerospace environmental sealing and efficient thermal dissipation mechanisms ensures that these critical screens withstand extreme operational environments without failure.
  • Furthermore, utilizing rigorous electromagnetic interference shielding guarantees that three-dimensional spatial representations render accurately, protecting navigation integrity and optimizing overall mission safety.

What are the market trends shaping the Display For Avionics Applications Industry?

  • The widespread migration toward large area panoramic cockpit displays represents an upcoming trend in the market. This shift fundamentally streamlines critical flight metrics and minimizes cognitive fatigue for flight crews.

  • The transition toward panoramic display surfaces fundamentally alters traditional glass cockpit configurations within the Display For Avionics Applications sector. Aerospace manufacturers are systematically replacing legacy active-matrix liquid crystal display modules with highly responsive organic light-emitting diode panels. This technological shift improves display contrast, resulting in a 20% enhancement in visual clarity during night operations compared to older backlit systems.
  • The integration of high-fidelity synthetic vision systems directly accelerates flight deck modernization efforts across commercial and business aviation fleets. By optimizing human-machine interface design, these advanced screens consolidate critical flight metrics into a single unified visual plane. This consolidation drives significant situational awareness optimization, achieving a 15% reduction in pilot data interpretation errors.
  • Ultimately, this seamless presentation of real-time telemetry acts as a vital mechanism for cognitive workload reduction during high-stress flight phases.

What challenges does the Display For Avionics Applications Industry face during its growth?

  • High development and certification costs inhibit market expansion, acting as a key challenge affecting industry growth.

  • Stringent certification protocols create substantial bottlenecks for manufacturers developing advanced Display For Avionics Applications. Engineering head-up display technology that incorporates global navigation satellite system integration requires exhaustive avionics software verification to ensure flawless flight critical data rendering. This rigorous testing phase extends product development cycles, delaying commercial aircraft retrofits by an average of 18 months compared to non-certified consumer electronics.
  • Integrating complex millimeter-wave radar units and forward-looking infrared sensors into legacy airframes demands highly customized tactical mission data processors. Furthermore, securing airborne tactical data links against emerging cyber threats complicates the deployment of open-system architectures across military fleets.
  • These developmental hurdles force aerospace suppliers to allocate massive capital toward compliance testing, significantly elevating the upfront production costs of next-generation cockpit displays.

Exclusive Technavio Analysis on Customer Landscape

The display for avionics applications market forecasting report includes the adoption lifecycle of the market, covering from the innovator’s stage to the laggard’s stage. It focuses on adoption rates in different regions based on penetration. Furthermore, the display for avionics applications market report also includes key purchase criteria and drivers of price sensitivity to help companies evaluate and develop their market growth analysis strategies.
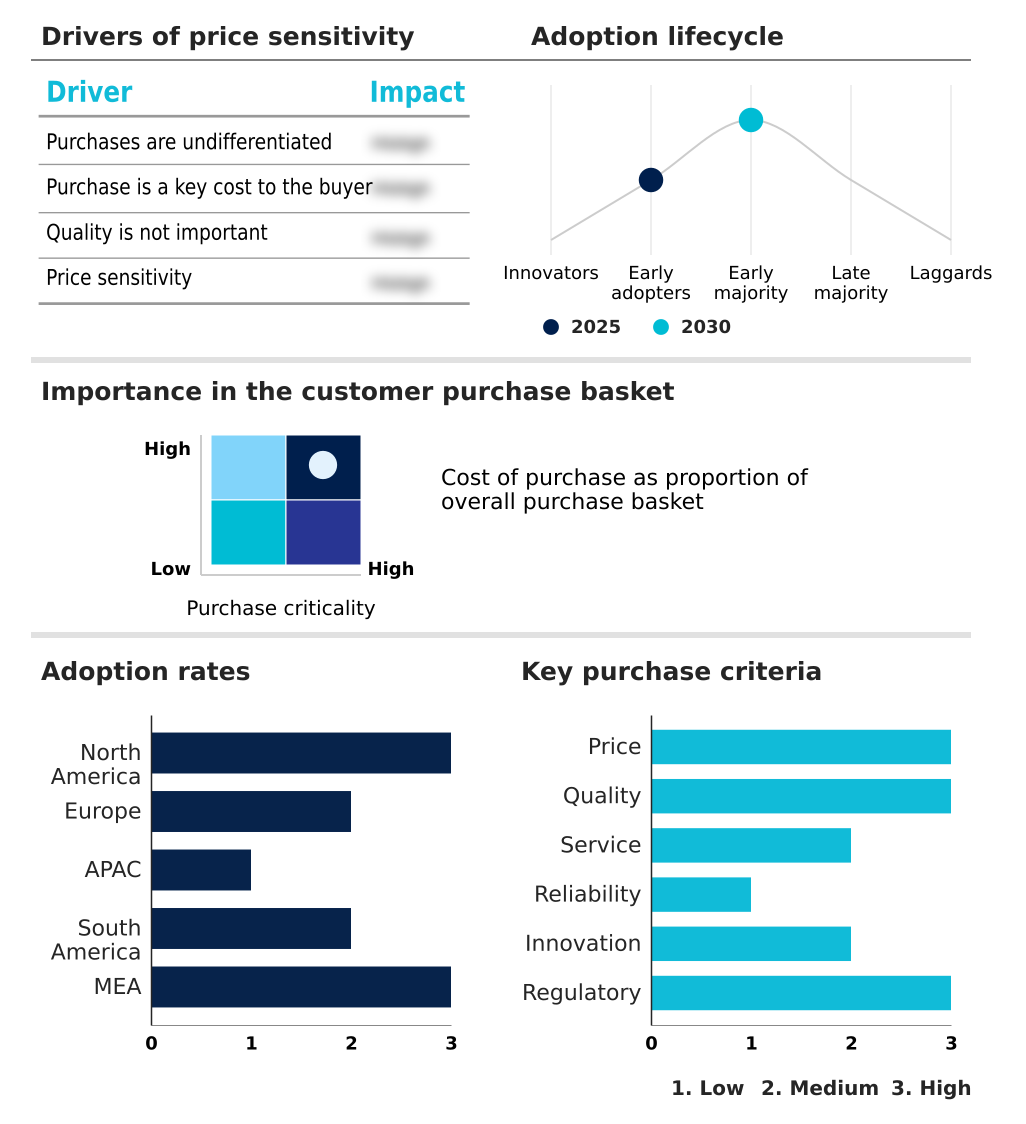
Customer Landscape of Display For Avionics Applications Industry

Competitive Landscape

Companies are implementing various strategies, such as strategic alliances, display for avionics applications market forecast, partnerships, mergers and acquisitions, geographical expansion, and product/service launches, to enhance their presence in the industry.

Aspen Avionics Inc. - The company specializes in engineering electronic flight instrument systems, advanced multifunction screens, and robust cockpit visual solutions tailored for mission-critical aerospace requirements and modernized flight deck integrations.

The industry research and growth report includes detailed analyses of the competitive landscape of the market and information about key companies, including:

  • Aspen Avionics Inc.
  • Astronautics Corp. of America
  • Avidyne Corp.
  • BAE Systems Plc
  • Collins Aerospace
  • Curtiss Wright Corp.
  • Diehl Stiftung and Co. KG
  • Dynon Avionics
  • Elbit Systems Ltd.
  • Garmin Ltd.
  • Genesys Aerosystems
  • Honeywell International Inc.
  • Korry Electronics Co.
  • L3Harris Technologies Inc.
  • Leonardo S.p.A.
  • Northrop Grumman Corp.
  • Parker Hannifin Corp.
  • Safran SA
  • Samtel HAL Display Systems Ltd.
  • ScioTeq BV
  • Thales Group
  • TransDigm Group Inc.
  • Universal Avionics Systems Corp

Qualitative and quantitative analysis of companies has been conducted to help clients understand the wider business environment as well as the strengths and weaknesses of key industry players. Data is qualitatively analyzed to categorize companies as pure play, category-focused, industry-focused, and diversified; it is quantitatively analyzed to categorize companies as dominant, leading, strong, tentative, and weak.

Recent Development and News in Display for avionics applications market

  • In the Electronic Equipment and Instruments industry, the transition toward high-density micro-LED panel manufacturing has significantly reduced component weight and power consumption, directly impacting Display For Avionics Applications demand by enabling more energy-efficient glass cockpit configurations.
  • The widespread adoption of AS9100 quality management standards for aerospace electronic component fabrication has enforced stricter avionics software verification processes, increasing the reliability and lifecycle of primary flight displays deployed in commercial aircraft retrofits.
  • Global semiconductor supply chain diversification into domestic fabrication facilities has stabilized the availability of advanced graphics processing units, directly accelerating the production volume of multi-function displays for military cockpit upgrades.
  • The integration of multi-core processing architectures in embedded industrial electronics has enhanced computational bandwidth, allowing Display For Avionics Applications to seamlessly render three-dimensional spatial representations and support complex sensor fusion architecture.

Dive into Technavio’s robust research methodology, blending expert interviews, extensive data synthesis, and validated models for unparalleled Display For Avionics Applications Market insights. See full methodology.

Market Scope
Page number 315
Base year 2025
Historic period 2020-2024
Forecast period 2026-2030
Growth momentum & CAGR Accelerate at a CAGR of 4.6%
Market growth 2026-2030 USD 1493.4 million
Market structure Fragmented
YoY growth 2025-2026(%) 4.4%
Key countries US, Canada, Mexico, Germany, UK, France, Italy, Spain, The Netherlands, China, Japan, India, South Korea, Australia, Indonesia, Brazil, Argentina, Chile, Saudi Arabia, UAE, South Africa, Israel and Turkey
Competitive landscape Leading Companies, Market Positioning of Companies, Competitive Strategies, and Industry Risks

Request Free Sample

Research Analyst Overview

  • The Display For Avionics Applications architecture continuously evolves to meet the stringent demands of modern aerospace operations, integrating vast arrays of sensor data into cohesive visual interfaces. The transition from fragmented analog dials to unified digital canvases drastically enhances spatial orientation for flight crews navigating congested global airspace.
  • Aerospace original equipment manufacturers prioritize the deployment of emissive screen technologies to reduce total aircraft weight and lower electrical power consumption. Airlines implementing consolidated flight management displays report a 15% reduction in pilot training time due to highly intuitive graphical user interfaces.
  • This shift directly influences compliance strategies, as fleet operators must upgrade legacy systems to meet modern satellite-based navigation mandates. The incorporation of synthetic vision overlays and real-time meteorological radar into multi-function screens ensures that aircrews can execute precise maneuvers during severe weather disruptions.
  • Consequently, advanced display systems act as the central node for network-centric warfare and commercial flight optimization, streamlining complex human-machine interactions while securing robust operational continuity across all aviation sectors.

What are the Key Data Covered in this Display For Avionics Applications Market Research and Growth Report?

  • What is the expected growth of the Display For Avionics Applications Market between 2026 and 2030?

    • USD 1.49 billion, at a CAGR of 4.6%

  • What segmentation does the market report cover?

    • The report is segmented by End-user (Civil aviation, and Military aviation), Type (In-flight display, and Heads-up display), Technology (EFIS, GNSS integration, EVS, SVS, and Touchscreen and gesture-controlled displays) and Geography (North America, Europe, APAC, South America, Middle East and Africa)

  • Which regions are analyzed in the report?

    • North America, Europe, APAC, South America and Middle East and Africa

  • What are the key growth drivers and market challenges?

    • Increasing demand for enhanced situational awareness systems, High development and certification costs inhibit market

  • Who are the major players in the Display For Avionics Applications Market?

    • Aspen Avionics Inc., Astronautics Corp. of America, Avidyne Corp., BAE Systems Plc, Collins Aerospace, Curtiss Wright Corp., Diehl Stiftung and Co. KG, Dynon Avionics, Elbit Systems Ltd., Garmin Ltd., Genesys Aerosystems, Honeywell International Inc., Korry Electronics Co., L3Harris Technologies Inc., Leonardo S.p.A., Northrop Grumman Corp., Parker Hannifin Corp., Safran SA, Samtel HAL Display Systems Ltd., ScioTeq BV, Thales Group, TransDigm Group Inc. and Universal Avionics Systems Corp

Market Research Insights

  • The Display For Avionics Applications sector undergoes rapid transformation as aerospace operators prioritize flight deck modernization to enhance operational safety. Integrating advanced panoramic display surfaces allows commercial airlines to achieve a 25% improvement in critical data processing speeds during high-stress maneuvers compared to traditional discrete instrument layouts.
  • This shift directly supports cognitive workload reduction, lowering pilot response times to automated alerts by 18%. Furthermore, the implementation of robust aerospace environmental sealing ensures system longevity, reducing hardware replacement costs by 12% across aging fleets.
  • By optimizing human-machine interface design and emphasizing situational awareness optimization, avionics manufacturers enable flight crews to navigate congested airspaces with unprecedented precision, fundamentally elevating the resilience and efficiency of global aviation networks.

We can help! Our analysts can customize this display for avionics applications market research report to meet your requirements.

Get in touch

1. Executive Summary

1.1 Market overview

Executive Summary - Chart on Market Overview
Executive Summary - Data Table on Market Overview
Executive Summary - Chart on Global Market Characteristics
Executive Summary - Chart on Market by Geography
Executive Summary - Chart on Market Segmentation by End-user
Executive Summary - Chart on Market Segmentation by Type
Executive Summary - Chart on Market Segmentation by Technology
Executive Summary - Chart on Incremental Growth
Executive Summary - Data Table on Incremental Growth
Executive Summary - Chart on Company Market Positioning

2. Technavio Analysis

2.1 Analysis of price sensitivity, lifecycle, customer purchase basket, adoption rates, and purchase criteria

2.2 Criticality of inputs and Factors of differentiation

Chart on Overview on criticality of inputs and factors of differentiation

2.3 Factors of disruption

Chart on Overview on factors of disruption

2.4 Impact of drivers and challenges

Chart on Impact of drivers and challenges in 2025 and 2030

3. Market Landscape

3.1 Market ecosystem

Chart on Parent Market
Data Table on - Parent Market

3.2 Market characteristics

Chart on Market characteristics analysis

3.3 Value chain analysis

Chart on Value chain analysis

4. Market Sizing

4.1 Market definition

Data Table on Offerings of companies included in the market definition

4.2 Market segment analysis

Market segments

4.3 Market size 2025

4.4 Market outlook: Forecast for 2025-2030

Chart on Global - Market size and forecast 2025-2030 ($ million)
Data Table on Global - Market size and forecast 2025-2030 ($ million)
Chart on Global Market: Year-over-year growth 2025-2030 (%)
Data Table on Global Market: Year-over-year growth 2025-2030 (%)

5. Historic Market Size

5.1 Global Display For Avionics Applications Market 2020 - 2024

Historic Market Size - Data Table on Global Display For Avionics Applications Market 2020 - 2024 ($ million)

5.2 End-user segment analysis 2020 - 2024

Historic Market Size - End-user Segment 2020 - 2024 ($ million)

5.3 Type segment analysis 2020 - 2024

Historic Market Size - Type Segment 2020 - 2024 ($ million)

5.4 Technology segment analysis 2020 - 2024

Historic Market Size - Technology Segment 2020 - 2024 ($ million)

5.5 Geography segment analysis 2020 - 2024

Historic Market Size - Geography Segment 2020 - 2024 ($ million)

5.6 Country segment analysis 2020 - 2024

Historic Market Size - Country Segment 2020 - 2024 ($ million)

6. Qualitative Analysis

6.1 Impact of AI on Global Display for Avionics Applications Market

6.2 Impact of geopolitical conflicts on Global Display for Avionics Applications Market

7. Five Forces Analysis

7.1 Five forces summary

Five forces analysis - Comparison between 2025 and 2030

7.2 Bargaining power of buyers

Bargaining power of buyers - Impact of key factors 2025 and 2030

7.3 Bargaining power of suppliers

Bargaining power of suppliers - Impact of key factors in 2025 and 2030

7.4 Threat of new entrants

Threat of new entrants - Impact of key factors in 2025 and 2030

7.5 Threat of substitutes

Threat of substitutes - Impact of key factors in 2025 and 2030

7.6 Threat of rivalry

Threat of rivalry - Impact of key factors in 2025 and 2030

7.7 Market condition

Chart on Market condition - Five forces 2025 and 2030

8. Market Segmentation by End-user

8.1 Market segments

Chart on End-user - Market share 2025-2030 (%)
Data Table on End-user - Market share 2025-2030 (%)

8.2 Comparison by End-user

Chart on Comparison by End-user
Data Table on Comparison by End-user

8.3 Civil aviation - Market size and forecast 2025-2030

Chart on Civil aviation - Market size and forecast 2025-2030 ($ million)
Data Table on Civil aviation - Market size and forecast 2025-2030 ($ million)
Chart on Civil aviation - Year-over-year growth 2025-2030 (%)
Data Table on Civil aviation - Year-over-year growth 2025-2030 (%)

8.4 Military aviation - Market size and forecast 2025-2030

Chart on Military aviation - Market size and forecast 2025-2030 ($ million)
Data Table on Military aviation - Market size and forecast 2025-2030 ($ million)
Chart on Military aviation - Year-over-year growth 2025-2030 (%)
Data Table on Military aviation - Year-over-year growth 2025-2030 (%)

8.5 Market opportunity by End-user

Market opportunity by End-user ($ million)
Data Table on Market opportunity by End-user ($ million)

9. Market Segmentation by Type

9.1 Market segments

Chart on Type - Market share 2025-2030 (%)
Data Table on Type - Market share 2025-2030 (%)

9.2 Comparison by Type

Chart on Comparison by Type
Data Table on Comparison by Type

9.3 In-flight display - Market size and forecast 2025-2030

Chart on In-flight display - Market size and forecast 2025-2030 ($ million)
Data Table on In-flight display - Market size and forecast 2025-2030 ($ million)
Chart on In-flight display - Year-over-year growth 2025-2030 (%)
Data Table on In-flight display - Year-over-year growth 2025-2030 (%)

9.4 Heads-up display - Market size and forecast 2025-2030

Chart on Heads-up display - Market size and forecast 2025-2030 ($ million)
Data Table on Heads-up display - Market size and forecast 2025-2030 ($ million)
Chart on Heads-up display - Year-over-year growth 2025-2030 (%)
Data Table on Heads-up display - Year-over-year growth 2025-2030 (%)

9.5 Market opportunity by Type

Market opportunity by Type ($ million)
Data Table on Market opportunity by Type ($ million)

10. Market Segmentation by Technology

10.1 Market segments

Chart on Technology - Market share 2025-2030 (%)
Data Table on Technology - Market share 2025-2030 (%)

10.2 Comparison by Technology

Chart on Comparison by Technology
Data Table on Comparison by Technology

10.3 EFIS - Market size and forecast 2025-2030

Chart on EFIS - Market size and forecast 2025-2030 ($ million)
Data Table on EFIS - Market size and forecast 2025-2030 ($ million)
Chart on EFIS - Year-over-year growth 2025-2030 (%)
Data Table on EFIS - Year-over-year growth 2025-2030 (%)

10.4 GNSS integration - Market size and forecast 2025-2030

Chart on GNSS integration - Market size and forecast 2025-2030 ($ million)
Data Table on GNSS integration - Market size and forecast 2025-2030 ($ million)
Chart on GNSS integration - Year-over-year growth 2025-2030 (%)
Data Table on GNSS integration - Year-over-year growth 2025-2030 (%)

10.5 EVS - Market size and forecast 2025-2030

Chart on EVS - Market size and forecast 2025-2030 ($ million)
Data Table on EVS - Market size and forecast 2025-2030 ($ million)
Chart on EVS - Year-over-year growth 2025-2030 (%)
Data Table on EVS - Year-over-year growth 2025-2030 (%)

10.6 SVS - Market size and forecast 2025-2030

Chart on SVS - Market size and forecast 2025-2030 ($ million)
Data Table on SVS - Market size and forecast 2025-2030 ($ million)
Chart on SVS - Year-over-year growth 2025-2030 (%)
Data Table on SVS - Year-over-year growth 2025-2030 (%)

10.7 Touchscreen and gesture-controlled displays - Market size and forecast 2025-2030

Chart on Touchscreen and gesture-controlled displays - Market size and forecast 2025-2030 ($ million)
Data Table on Touchscreen and gesture-controlled displays - Market size and forecast 2025-2030 ($ million)
Chart on Touchscreen and gesture-controlled displays - Year-over-year growth 2025-2030 (%)
Data Table on Touchscreen and gesture-controlled displays - Year-over-year growth 2025-2030 (%)

10.8 Market opportunity by Technology

Market opportunity by Technology ($ million)
Data Table on Market opportunity by Technology ($ million)

11. Customer Landscape

11.1 Customer landscape overview

Analysis of price sensitivity, lifecycle, customer purchase basket, adoption rates, and purchase criteria

12. Geographic Landscape

12.1 Geographic segmentation

Chart on Market share by geography 2025-2030 (%)
Data Table on Market share by geography 2025-2030 (%)

12.2 Geographic comparison

Chart on Geographic comparison
Data Table on Geographic comparison

12.3 North America - Market size and forecast 2025-2030

Chart on North America - Market size and forecast 2025-2030 ($ million)
Data Table on North America - Market size and forecast 2025-2030 ($ million)
Chart on North America - Year-over-year growth 2025-2030 (%)
Data Table on North America - Year-over-year growth 2025-2030 (%)
Chart on Regional Comparison - North America
Data Table on Regional Comparison - North America

12.3.1 US - Market size and forecast 2025-2030

Chart on US - Market size and forecast 2025-2030 ($ million)
Data Table on US - Market size and forecast 2025-2030 ($ million)
Chart on US - Year-over-year growth 2025-2030 (%)
Data Table on US - Year-over-year growth 2025-2030 (%)

12.3.2 Canada - Market size and forecast 2025-2030

Chart on Canada - Market size and forecast 2025-2030 ($ million)
Data Table on Canada - Market size and forecast 2025-2030 ($ million)
Chart on Canada - Year-over-year growth 2025-2030 (%)
Data Table on Canada - Year-over-year growth 2025-2030 (%)

12.3.3 Mexico - Market size and forecast 2025-2030

Chart on Mexico - Market size and forecast 2025-2030 ($ million)
Data Table on Mexico - Market size and forecast 2025-2030 ($ million)
Chart on Mexico - Year-over-year growth 2025-2030 (%)
Data Table on Mexico - Year-over-year growth 2025-2030 (%)

12.4 Europe - Market size and forecast 2025-2030

Chart on Europe - Market size and forecast 2025-2030 ($ million)
Data Table on Europe - Market size and forecast 2025-2030 ($ million)
Chart on Europe - Year-over-year growth 2025-2030 (%)
Data Table on Europe - Year-over-year growth 2025-2030 (%)
Chart on Regional Comparison - Europe
Data Table on Regional Comparison - Europe

12.4.1 Germany - Market size and forecast 2025-2030

Chart on Germany - Market size and forecast 2025-2030 ($ million)
Data Table on Germany - Market size and forecast 2025-2030 ($ million)
Chart on Germany - Year-over-year growth 2025-2030 (%)
Data Table on Germany - Year-over-year growth 2025-2030 (%)

12.4.2 UK - Market size and forecast 2025-2030

Chart on UK - Market size and forecast 2025-2030 ($ million)
Data Table on UK - Market size and forecast 2025-2030 ($ million)
Chart on UK - Year-over-year growth 2025-2030 (%)
Data Table on UK - Year-over-year growth 2025-2030 (%)

12.4.3 France - Market size and forecast 2025-2030

Chart on France - Market size and forecast 2025-2030 ($ million)
Data Table on France - Market size and forecast 2025-2030 ($ million)
Chart on France - Year-over-year growth 2025-2030 (%)
Data Table on France - Year-over-year growth 2025-2030 (%)

12.4.4 Italy - Market size and forecast 2025-2030

Chart on Italy - Market size and forecast 2025-2030 ($ million)
Data Table on Italy - Market size and forecast 2025-2030 ($ million)
Chart on Italy - Year-over-year growth 2025-2030 (%)
Data Table on Italy - Year-over-year growth 2025-2030 (%)

12.4.5 Spain - Market size and forecast 2025-2030

Chart on Spain - Market size and forecast 2025-2030 ($ million)
Data Table on Spain - Market size and forecast 2025-2030 ($ million)
Chart on Spain - Year-over-year growth 2025-2030 (%)
Data Table on Spain - Year-over-year growth 2025-2030 (%)

12.4.6 The Netherlands - Market size and forecast 2025-2030

Chart on The Netherlands - Market size and forecast 2025-2030 ($ million)
Data Table on The Netherlands - Market size and forecast 2025-2030 ($ million)
Chart on The Netherlands - Year-over-year growth 2025-2030 (%)
Data Table on The Netherlands - Year-over-year growth 2025-2030 (%)

12.5 APAC - Market size and forecast 2025-2030

Chart on APAC - Market size and forecast 2025-2030 ($ million)
Data Table on APAC - Market size and forecast 2025-2030 ($ million)
Chart on APAC - Year-over-year growth 2025-2030 (%)
Data Table on APAC - Year-over-year growth 2025-2030 (%)
Chart on Regional Comparison - APAC
Data Table on Regional Comparison - APAC

12.5.1 China - Market size and forecast 2025-2030

Chart on China - Market size and forecast 2025-2030 ($ million)
Data Table on China - Market size and forecast 2025-2030 ($ million)
Chart on China - Year-over-year growth 2025-2030 (%)
Data Table on China - Year-over-year growth 2025-2030 (%)

12.5.2 Japan - Market size and forecast 2025-2030

Chart on Japan - Market size and forecast 2025-2030 ($ million)
Data Table on Japan - Market size and forecast 2025-2030 ($ million)
Chart on Japan - Year-over-year growth 2025-2030 (%)
Data Table on Japan - Year-over-year growth 2025-2030 (%)

12.5.3 India - Market size and forecast 2025-2030

Chart on India - Market size and forecast 2025-2030 ($ million)
Data Table on India - Market size and forecast 2025-2030 ($ million)
Chart on India - Year-over-year growth 2025-2030 (%)
Data Table on India - Year-over-year growth 2025-2030 (%)

12.5.4 South Korea - Market size and forecast 2025-2030

Chart on South Korea - Market size and forecast 2025-2030 ($ million)
Data Table on South Korea - Market size and forecast 2025-2030 ($ million)
Chart on South Korea - Year-over-year growth 2025-2030 (%)
Data Table on South Korea - Year-over-year growth 2025-2030 (%)

12.5.5 Australia - Market size and forecast 2025-2030

Chart on Australia - Market size and forecast 2025-2030 ($ million)
Data Table on Australia - Market size and forecast 2025-2030 ($ million)
Chart on Australia - Year-over-year growth 2025-2030 (%)
Data Table on Australia - Year-over-year growth 2025-2030 (%)

12.5.6 Indonesia - Market size and forecast 2025-2030

Chart on Indonesia - Market size and forecast 2025-2030 ($ million)
Data Table on Indonesia - Market size and forecast 2025-2030 ($ million)
Chart on Indonesia - Year-over-year growth 2025-2030 (%)
Data Table on Indonesia - Year-over-year growth 2025-2030 (%)

12.6 South America - Market size and forecast 2025-2030

Chart on South America - Market size and forecast 2025-2030 ($ million)
Data Table on South America - Market size and forecast 2025-2030 ($ million)
Chart on South America - Year-over-year growth 2025-2030 (%)
Data Table on South America - Year-over-year growth 2025-2030 (%)
Chart on Regional Comparison - South America
Data Table on Regional Comparison - South America

12.6.1 Brazil - Market size and forecast 2025-2030

Chart on Brazil - Market size and forecast 2025-2030 ($ million)
Data Table on Brazil - Market size and forecast 2025-2030 ($ million)
Chart on Brazil - Year-over-year growth 2025-2030 (%)
Data Table on Brazil - Year-over-year growth 2025-2030 (%)

12.6.2 Argentina - Market size and forecast 2025-2030

Chart on Argentina - Market size and forecast 2025-2030 ($ million)
Data Table on Argentina - Market size and forecast 2025-2030 ($ million)
Chart on Argentina - Year-over-year growth 2025-2030 (%)
Data Table on Argentina - Year-over-year growth 2025-2030 (%)

12.6.3 Chile - Market size and forecast 2025-2030

Chart on Chile - Market size and forecast 2025-2030 ($ million)
Data Table on Chile - Market size and forecast 2025-2030 ($ million)
Chart on Chile - Year-over-year growth 2025-2030 (%)
Data Table on Chile - Year-over-year growth 2025-2030 (%)

12.7 Middle East and Africa - Market size and forecast 2025-2030

Chart on Middle East and Africa - Market size and forecast 2025-2030 ($ million)
Data Table on Middle East and Africa - Market size and forecast 2025-2030 ($ million)
Chart on Middle East and Africa - Year-over-year growth 2025-2030 (%)
Data Table on Middle East and Africa - Year-over-year growth 2025-2030 (%)
Chart on Regional Comparison - Middle East and Africa
Data Table on Regional Comparison - Middle East and Africa

12.7.1 Saudi Arabia - Market size and forecast 2025-2030

Chart on Saudi Arabia - Market size and forecast 2025-2030 ($ million)
Data Table on Saudi Arabia - Market size and forecast 2025-2030 ($ million)
Chart on Saudi Arabia - Year-over-year growth 2025-2030 (%)
Data Table on Saudi Arabia - Year-over-year growth 2025-2030 (%)

12.7.2 UAE - Market size and forecast 2025-2030

Chart on UAE - Market size and forecast 2025-2030 ($ million)
Data Table on UAE - Market size and forecast 2025-2030 ($ million)
Chart on UAE - Year-over-year growth 2025-2030 (%)
Data Table on UAE - Year-over-year growth 2025-2030 (%)

12.7.3 South Africa - Market size and forecast 2025-2030

Chart on South Africa - Market size and forecast 2025-2030 ($ million)
Data Table on South Africa - Market size and forecast 2025-2030 ($ million)
Chart on South Africa - Year-over-year growth 2025-2030 (%)
Data Table on South Africa - Year-over-year growth 2025-2030 (%)

12.7.4 Israel - Market size and forecast 2025-2030

Chart on Israel - Market size and forecast 2025-2030 ($ million)
Data Table on Israel - Market size and forecast 2025-2030 ($ million)
Chart on Israel - Year-over-year growth 2025-2030 (%)
Data Table on Israel - Year-over-year growth 2025-2030 (%)

12.7.5 Turkey - Market size and forecast 2025-2030

Chart on Turkey - Market size and forecast 2025-2030 ($ million)
Data Table on Turkey - Market size and forecast 2025-2030 ($ million)
Chart on Turkey - Year-over-year growth 2025-2030 (%)
Data Table on Turkey - Year-over-year growth 2025-2030 (%)

12.8 Market opportunity by geography

Market opportunity by geography ($ million)
Data Tables on Market opportunity by geography ($ million)

13. Drivers, Challenges, and Opportunity

13.1 Market drivers

Increasing demand for enhanced situational awareness systems
Accelerated modernization of commercial aircraft fleets globally
Rising military expenditures and defense cockpit upgrades

13.2 Market challenges

High development and certification costs inhibit market
Severe semiconductor and supply chain disruptions delay deliveries
Escalating cybersecurity vulnerabilities in modern glass cockpits

13.3 Impact of drivers and challenges

Impact of drivers and challenges in 2025 and 2030

13.4 Market opportunities

Widespread migration toward large area panoramic cockpit displays
Accelerated integration of MicroLED and OLED hardware architectures
Growth of connected avionics driving aftermarket glass retrofits

14. Competitive Landscape

14.1 Overview

14.2

Overview on criticality of inputs and factors of differentiation

14.3 Landscape disruption

Overview on factors of disruption

14.4 Industry risks

Impact of key risks on business

15. Competitive Analysis

15.1 Companies profiled

Companies covered

15.2 Company ranking index

15.3 Market positioning of companies

Matrix on companies position and classification

15.4 Astronautics Corp. of America

Astronautics Corp. of America - Overview
Astronautics Corp. of America - Product / Service
Astronautics Corp. of America - Key offerings
SWOT

15.5 Avidyne Corp.

Avidyne Corp. - Overview
Avidyne Corp. - Product / Service
Avidyne Corp. - Key offerings
SWOT

15.6 BAE Systems Plc

BAE Systems Plc - Overview
BAE Systems Plc - Business segments
BAE Systems Plc - Key news
BAE Systems Plc - Key offerings
BAE Systems Plc - Segment focus
SWOT

15.7 Collins Aerospace

Collins Aerospace - Overview
Collins Aerospace - Product / Service
Collins Aerospace - Key offerings
SWOT

15.8 Curtiss Wright Corp.

Curtiss Wright Corp. - Overview
Curtiss Wright Corp. - Business segments
Curtiss Wright Corp. - Key offerings
Curtiss Wright Corp. - Segment focus
SWOT

15.9 Elbit Systems Ltd.

Elbit Systems Ltd. - Overview
Elbit Systems Ltd. - Business segments
Elbit Systems Ltd. - Key offerings
Elbit Systems Ltd. - Segment focus
SWOT

15.10 Garmin Ltd.

Garmin Ltd. - Overview
Garmin Ltd. - Business segments
Garmin Ltd. - Key news
Garmin Ltd. - Key offerings
Garmin Ltd. - Segment focus
SWOT

15.11 Honeywell International Inc.

Honeywell International Inc. - Overview
Honeywell International Inc. - Business segments
Honeywell International Inc. - Key news
Honeywell International Inc. - Key offerings
Honeywell International Inc. - Segment focus
SWOT

15.12 L3Harris Technologies Inc.

L3Harris Technologies Inc. - Overview
L3Harris Technologies Inc. - Business segments
L3Harris Technologies Inc. - Key offerings
L3Harris Technologies Inc. - Segment focus
SWOT

15.13 Leonardo S.p.A.

Leonardo S.p.A. - Overview
Leonardo S.p.A. - Business segments
Leonardo S.p.A. - Key news
Leonardo S.p.A. - Key offerings
Leonardo S.p.A. - Segment focus
SWOT

15.14 Northrop Grumman Corp.

Northrop Grumman Corp. - Overview
Northrop Grumman Corp. - Business segments
Northrop Grumman Corp. - Key offerings
Northrop Grumman Corp. - Segment focus
SWOT

15.15 Parker Hannifin Corp.

Parker Hannifin Corp. - Overview
Parker Hannifin Corp. - Business segments
Parker Hannifin Corp. - Key news
Parker Hannifin Corp. - Key offerings
Parker Hannifin Corp. - Segment focus
SWOT

15.16 Safran SA

Safran SA - Overview
Safran SA - Business segments
Safran SA - Key news
Safran SA - Key offerings
Safran SA - Segment focus
SWOT

15.17 Thales Group

Thales Group - Overview
Thales Group - Business segments
Thales Group - Key news
Thales Group - Key offerings
Thales Group - Segment focus
SWOT

15.18 TransDigm Group Inc.

TransDigm Group Inc. - Overview
TransDigm Group Inc. - Business segments
TransDigm Group Inc. - Key news
TransDigm Group Inc. - Key offerings
TransDigm Group Inc. - Segment focus
SWOT

16. Appendix

16.1 Scope of the report

Market definition
Objectives
Notes and caveats

16.2 Inclusions and exclusions checklist

Inclusions checklist
Exclusions checklist

16.3 Currency conversion rates for US$

16.4 Research methodology

16.5 Data procurement

Information sources

16.6 Data validation

16.7 Validation techniques employed for market sizing

16.8 Data synthesis

16.9 360 degree market analysis

16.10 List of abbreviations

Research Methodology

Technavio presents a detailed picture of the market by way of study, synthesis, and summation of data from multiple sources. The analysts have presented the various facets of the market with a particular focus on identifying the key industry influencers. The data thus presented is comprehensive, reliable, and the result of extensive research, both primary and secondary.

INFORMATION SOURCES

Primary sources

  • Manufacturers and suppliers
  • Channel partners
  • Industry experts
  • Strategic decision makers

Secondary sources

  • Industry journals and periodicals
  • Government data
  • Financial reports of key industry players
  • Historical data
  • Press releases

DATA ANALYSIS

Data Synthesis

  • Collation of data
  • Estimation of key figures
  • Analysis of derived insights

Data Validation

  • Triangulation with data models
  • Reference against proprietary databases
  • Corroboration with industry experts

REPORT WRITING

Qualitative

  • Market drivers
  • Market challenges
  • Market trends
  • Five forces analysis

Quantitative

  • Market size and forecast
  • Market segmentation
  • Geographical insights
  • Competitive landscape

Interested in this report?

Get your sample now to see our research methodology and insights!

Download Now

Frequently Asked Questions

Display For Avionics Applications market growth will increase by USD 1493.4 million during 2026-2030.

The Display For Avionics Applications market is expected to grow at a CAGR of 4.6% during 2026-2030.

Display For Avionics Applications market is segmented by End-user (Civil aviation, Military aviation) Type (In-flight display, Heads-up display) Technology (EFIS, GNSS integration, EVS, SVS, Touchscreen and gesture-controlled displays)

Aspen Avionics Inc., Astronautics Corp. of America, Avidyne Corp., BAE Systems Plc, Collins Aerospace, Curtiss Wright Corp., Diehl Stiftung and Co. KG, Dynon Avionics, Elbit Systems Ltd., Garmin Ltd., Genesys Aerosystems, Honeywell International Inc., Korry Electronics Co., L3Harris Technologies Inc., Leonardo S.p.A., Northrop Grumman Corp., Parker Hannifin Corp., Safran SA, Samtel HAL Display Systems Ltd., ScioTeq BV, Thales Group, TransDigm Group Inc., Universal Avionics Systems Corp are a few of the key vendors in the Display For Avionics Applications market.

North America will register the highest growth rate of 43% among the other regions. Therefore, the Display For Avionics Applications market in North America is expected to garner significant business opportunities for the vendors during the forecast period.

US, Canada, Mexico, Germany, UK, France, Italy, Spain, The Netherlands, China, Japan, India, South Korea, Australia, Indonesia, Brazil, Argentina, Chile, Saudi Arabia, UAE, South Africa, Israel, Turkey

  • Increasing demand for enhanced situational awareness systems is the driving factor this market.

The Display For Avionics Applications market vendors should focus on grabbing business opportunities from the End-user segment as it accounted for the largest market share in the base year.
RIA - Research AI Assistant
Ask RIA
