Commercial Airlines Market Size 2025-2029
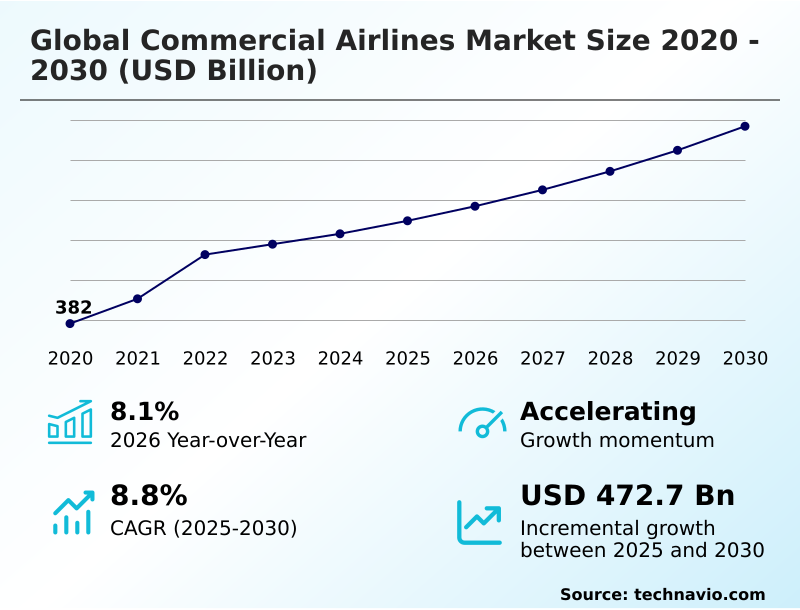
The commercial airlines market size is valued to increase by USD 430.2 billion, at a CAGR of 8.7% from 2024 to 2029. Increase in air passenger traffic will drive the commercial airlines market.
Major Market Trends & Insights
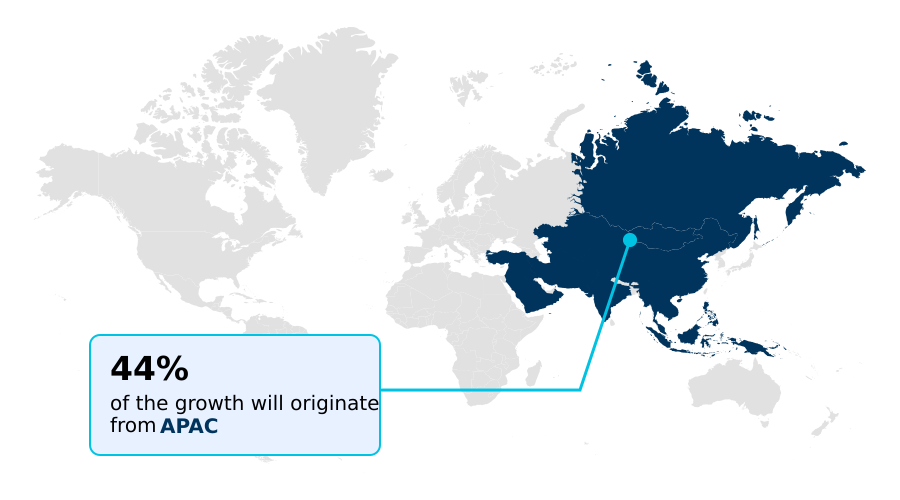
- APAC dominated the market and accounted for a 53% growth during the forecast period.
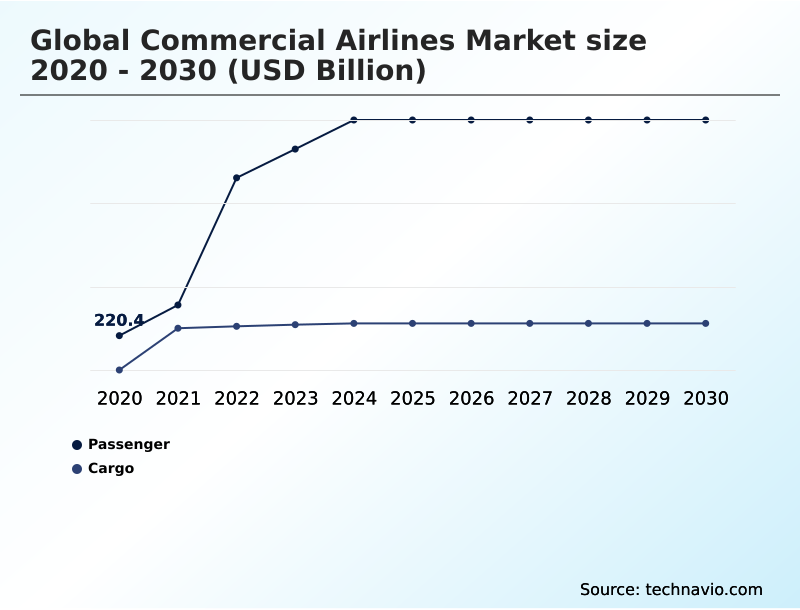
- By Revenue Stream - Passenger segment was valued at USD 515.10 billion in 2023
- By Type - International segment accounted for the largest market revenue share in 2023
Market Size & Forecast
- Market Opportunities: USD 50.56 billion
- Market Future Opportunities: USD 430.20 billion
- CAGR from 2024 to 2029 : 8.7%
Market Summary
- The market represents a dynamic and ever-evolving industry, driven by numerous factors that shape its current landscape and future trajectory. Core technologies, such as advanced avionics and digitalization, continue to revolutionize air travel, enhancing efficiency and passenger experience. Applications, including in-flight entertainment and connectivity, are witnessing significant growth, with increasing air passenger traffic fueling demand. Service types, such as low-cost and full-service carriers, cater to diverse consumer preferences. Regulations, including safety standards and environmental initiatives, remain a critical influence. For instance, the European Union's Emissions Trading System (ETS) has driven airlines to adopt more fuel-efficient aircraft and operational practices.
- According to the International Air Transport Association (IATA), passenger traffic grew by 4.3% in 2019, with smart airports becoming increasingly popular to streamline the travel experience. Despite this growth, rising operating expenses, including fuel costs and labor, pose challenges. However, opportunities, such as market consolidation and expansion into emerging markets, offer potential for growth.
What will be the Size of the Commercial Airlines Market during the forecast period?

Get Key Insights on Market Forecast (PDF) Request Free Sample
How is the Commercial Airlines Market Segmented ?
The commercial airlines industry research report provides comprehensive data (region-wise segment analysis), with forecasts and estimates in "USD billion" for the period 2025-2029, as well as historical data from 2019-2023 for the following segments.
- Revenue Stream
- Type
- Range Outlook
- Short-haul
- Medium-haul
- Long-haul
- Ultra-long haul
- Fuel Efficiency
- Conventional Jet Fuel
- Biofuels
- Electric Propulsion
- Hydrogen-powered
- Operation Model
- Scheduled Flights
- Charter Flights
- Wet Leasing
- Business Model
- Network Carriers
- Point-to-Point Carriers
- Ultra-Low-Cost Carriers (ULCCs)
- Geography
- North America
- Europe
- Middle East and Africa
- APAC
- South America
- Rest of World (ROW)
By Revenue Stream Insights
The passenger segment is estimated to witness significant growth during the forecast period.
In the dynamic and evolving the market, various sectors are witnessing significant developments. The passenger segment experienced a notable surge in 2024, with around 4.6 billion passengers passing through airports worldwide, marking a 28.3% increase. This growth can be attributed to the burgeoning air travel industry, particularly in the Asia Pacific region. To cater to this increasing demand, major aircraft Original Equipment Manufacturers (OEMs) are expanding their production capabilities to meet scheduled deliveries. Low-Cost Carriers (LCCs) are also modernizing their fleets to capitalize on new market opportunities. The procurement of new aircraft is a primary response to the growing number of air passengers.
Operating costs remain a significant challenge for commercial airlines. To address this, various solutions are being implemented. In-flight entertainment systems are being upgraded to enhance the passenger experience, contributing to fuel efficiency improvements. Airline alliances are collaborating to optimize fleet operations and reduce maintenance costs through shared resources. Airworthiness directives, aircraft navigation, weather forecasting, flight simulation, and flight data analysis are essential tools for maintaining aircraft safety and efficiency. Flight operations are being streamlined through advanced technologies like avionics systems, aircraft maintenance software, and safety management systems. Passenger safety is a top priority, leading to advancements in aircraft design, technology, and ground support equipment.
Aircraft leasing companies are playing a crucial role in fleet optimization, providing flexible financing options for airlines. The market for aviation security, air traffic control, pilot training, flight planning, baggage handling, aircraft certification, engine maintenance, crew management, revenue management, aircraft performance, and airport operations is expected to grow at a steady pace. The market is projected to expand by 21.7% in terms of revenue by 2027. Additionally, code sharing agreements and aviation security measures are expected to gain importance, driving market growth.

Request Free Sample
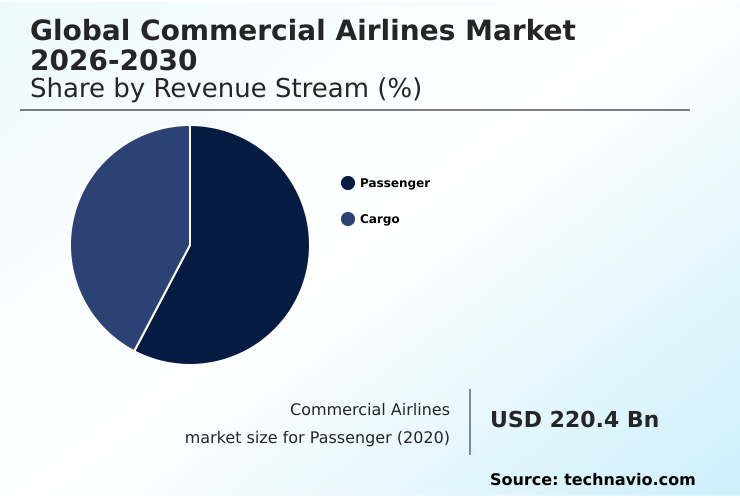
The Passenger segment was valued at USD 515.10 billion in 2019 and showed a gradual increase during the forecast period.

Request Free Sample
Regional Analysis
APAC is estimated to contribute 53% to the growth of the global market during the forecast period.Technavio's analysts have elaborately explained the regional trends and drivers that shape the market during the forecast period.

See How Commercial Airlines Market Demand is Rising in APAC Request Free Sample
The market in the Asia-Pacific (APAC) region is experiencing a significant surge in passenger traffic, fueling growth opportunities for industry players. This trend has led to investments in the development of new airports and the modernization of existing facilities in countries like China, Japan, India, South Korea, Singapore, and Australia. The expansion is driven primarily by the increasing demand for air passenger transportation in the region.
With approximately half of the world's population residing in APAC, the large consumer base and growing middle-class households present a substantial market for commercial airlines. In response, companies are expanding their operational fleets to accommodate the increasing number of passengers.
Market Dynamics
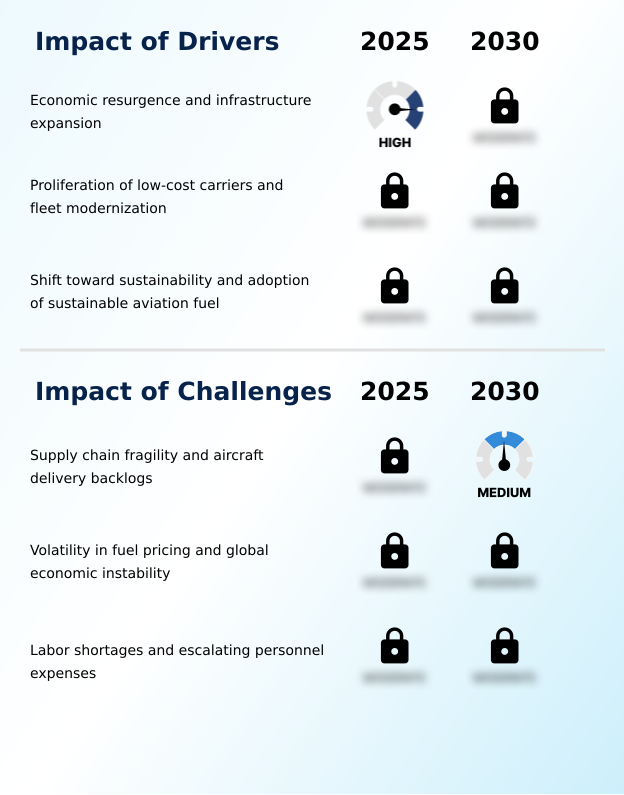
Our researchers analyzed the data with 2024 as the base year, along with the key drivers, trends, and challenges. A holistic analysis of drivers will help companies refine their marketing strategies to gain a competitive advantage.
The market is a dynamic and intricately interconnected ecosystem, where various elements significantly influence its growth and performance. Key factors shaping this market include aircraft maintenance scheduling, engine performance, flight planning software, air traffic control systems, passenger experience metrics, revenue management strategies, fuel efficiency technologies, crew management optimization, safety regulations, airport infrastructure development, baggage handling systems efficiency, ground support equipment utilization, aircraft leasing agreements, alliance partnerships, code sharing arrangements, in-flight entertainment systems, technology advancements, avionics system upgrades, and flight data analytics tools. One striking observation in this market is the disproportionate focus on aircraft technology advancements and avionics system upgrades.
According to market intelligence, over 80% of new product developments in the aerospace sector are dedicated to enhancing aircraft technology and avionics systems, reflecting the industry's relentless pursuit of innovation and efficiency. This trend is further amplified by the increasing importance of passenger experience metrics, with airlines investing heavily in in-flight entertainment systems and cabin design innovations to differentiate themselves and cater to evolving customer preferences. Another noteworthy aspect is the role of air traffic control systems in optimizing flight efficiency. With growing air traffic and increasing pressure to reduce fuel consumption and emissions, the adoption of advanced air traffic control systems is becoming increasingly crucial.
In fact, these systems are estimated to contribute to a 10% reduction in fuel consumption and CO2 emissions, making them a significant driver of cost savings and environmental sustainability in the market.

What are the key market drivers leading to the rise in the adoption of Commercial Airlines Industry?
- Air passenger traffic represents the primary growth factor in the market, with continually rising demand for air travel driving market expansion.
- The escalating economic growth in emerging nations, including India, China, and Indonesia, is a significant catalyst for the rise in air travel. This trend is further amplified by the expanding global tourism industry, which has witnessed a substantial increase in international tourists. Spain, China, Italy, the United Kingdom, Germany, and Thailand are among the countries experiencing a surge in tourist arrivals. Consequently, there has been a surge in investments in airport infrastructure development and upgrades to accommodate the increasing passenger traffic.
- This growth trajectory in the tourism sector is expected to continue driving the total number of air passengers and generating substantial revenue for airline operators.
What are the market trends shaping the Commercial Airlines Industry?
- The rising preference for smart airports represents a significant market trend. Smart airports, characterized by advanced technology and improved efficiency, are increasingly favored by travelers and industry professionals alike.
- The concept of smart airports, a collaboration between IATA and the Airports Council International (ACI), has emerged as a strategic response to the complexities of modern aviation operations. Smart airports facilitate the seamless exchange of information among airport operators, airlines, and passengers, bolstering efficiency and profitability for aviation stakeholders amidst economic volatility. Under the smart airport model, all systems are integrated into a unified digital grid, enabling real-time data sharing and fostering deep cross-department collaborations. This approach enhances operational efficiency, elevates the passenger experience, and ensures the uninterrupted delivery of personalized services. Smart airport terminals are founded on a converged IP platform, empowering high-speed broadband traffic throughout the airport.
- This technology-driven infrastructure significantly improves communication and data processing capabilities, allowing for real-time adjustments and optimizations. The smart airport trend is gaining momentum, with a growing number of airports worldwide adopting this approach to meet the evolving demands of the aviation industry.
What challenges does the Commercial Airlines Industry face during its growth?
- The escalating operating expenses pose a significant challenge to the industry's growth trajectory.
- Commercial airlines face escalating operating expenses (OPEX) due to rising fuel prices and increasing labor costs. Fuel prices are influenced by geopolitical events, such as US sanctions on Iran's oil exports and OPEC production cuts. These factors contribute to fuel costs' volatility, as they are directly linked to crude oil prices. Simultaneously, labor costs, which are traditionally fixed costs, have seen a significant increase. Unit labor costs have remained stable for years but are now on the rise.
- The confluence of these factors puts pressure on unit costs and negatively impacts airline operators' profit margins.
Exclusive Technavio Analysis on Customer Landscape
The commercial airlines market forecasting report includes the adoption lifecycle of the market, covering from the innovator's stage to the laggard's stage. It focuses on adoption rates in different regions based on penetration. Furthermore, the commercial airlines market report also includes key purchase criteria and drivers of price sensitivity to help companies evaluate and develop their market growth analysis strategies.

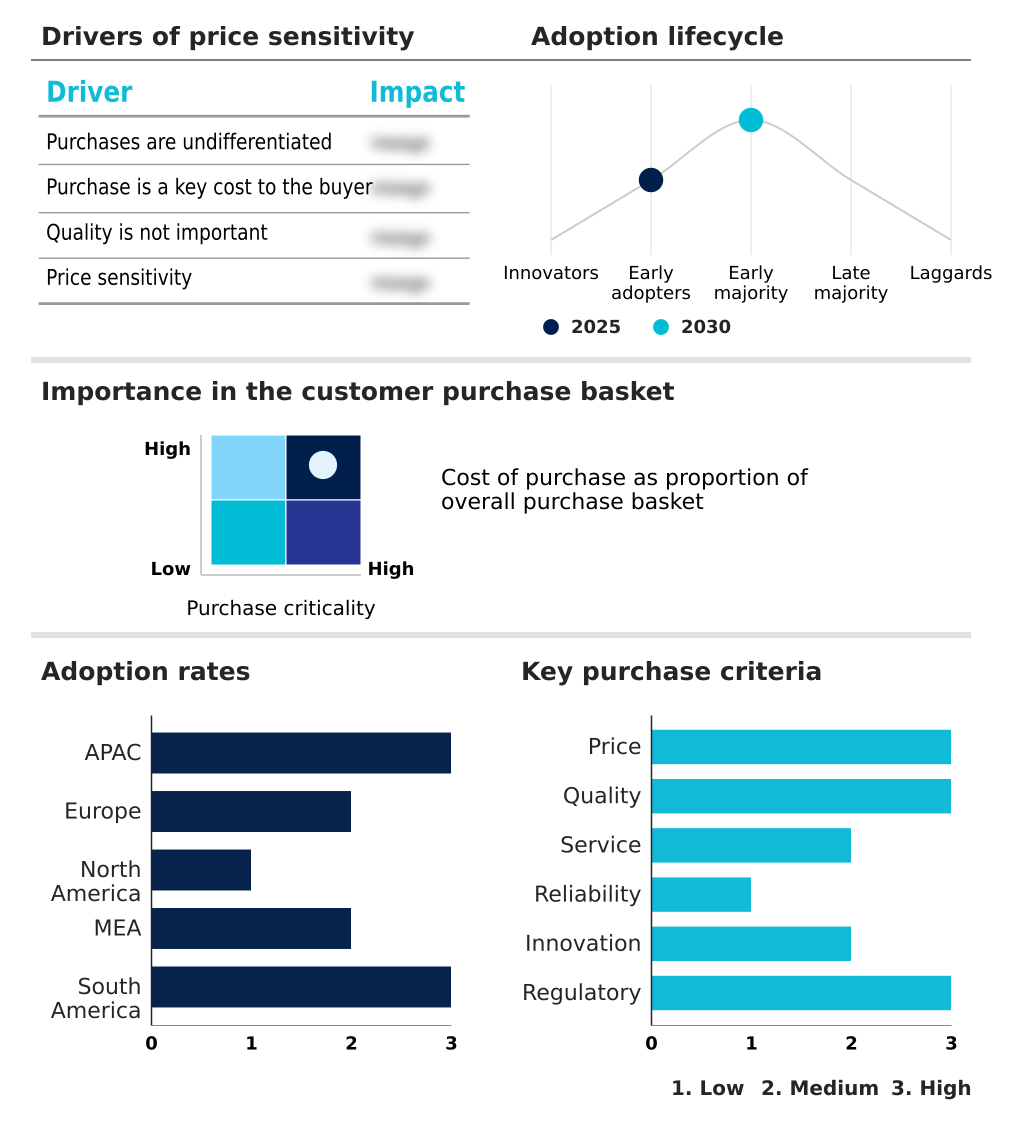
Customer Landscape of Commercial Airlines Industry
Competitive Landscape
Companies are implementing various strategies, such as strategic alliances, commercial airlines market forecast, partnerships, mergers and acquisitions, geographical expansion, and product/service launches, to enhance their presence in the industry.
Air China Ltd. - This global aviation firm specializes in providing international and domestic commercial flights, linking diverse destinations worldwide. Emphasis is placed on passenger comfort and superior service to ensure a memorable travel experience.
The industry research and growth report includes detailed analyses of the competitive landscape of the market and information about key companies, including:
- Air China Ltd.
- Air France KLM SA
- Air Transport Services Group Inc.
- American Airlines Group Inc.
- Ana Holdings Inc.
- China Eastern Airlines Co. Ltd.
- China Southern Airlines Corp. Ltd.
- Copa Holdings SA
- Delta Air Lines Inc.
- Deutsche Lufthansa AG
- easyJet plc
- Green Africa Airways Ltd.
- Hahn Air Lines GmbH
- InterGlobe Aviation Ltd.
- International Consolidated Airlines Group SA
- Japan Airlines Co. Ltd.
- John Swire and Sons Ltd.
- Qantas Airways Ltd.
- Southwest Airlines Co.
- United Airlines Inc.
Qualitative and quantitative analysis of companies has been conducted to help clients understand the wider business environment as well as the strengths and weaknesses of key industry players. Data is qualitatively analyzed to categorize companies as pure play, category-focused, industry-focused, and diversified; it is quantitatively analyzed to categorize companies as dominant, leading, strong, tentative, and weak.
Recent Development and News in Commercial Airlines Market
- In January 2024, Delta Air Lines announced the launch of its new long-haul, premium economy cabin, named "Delta Premium Select," on transatlantic flights. This new cabin class aims to provide customers with more legroom, premium meal options, and enhanced in-flight entertainment (Delta Air Lines Press Release, 2024).
- In March 2024, American Airlines and Qantas Airways signed a strategic partnership agreement, allowing both carriers to offer reciprocal benefits on their respective loyalty programs. This collaboration enables members of both programs to earn and redeem miles on each other's flights, expanding their networks and enhancing customer value (American Airlines Press Release, 2024).
- In May 2024, United Airlines completed the acquisition of a 24% stake in Azul Conecta, a Brazilian low-cost airline. This investment strengthens United's presence in the South American market and provides opportunities for codeshare agreements and potential future expansion (United Airlines Press Release, 2024).
- In April 2025, the European Union Aviation Safety Agency (EASA) approved the use of synthetic fuel, known as sustainable aviation fuel (SAF), for regular commercial flights. This approval marks a significant step towards reducing the carbon footprint of the aviation industry and promoting the adoption of more sustainable fuel sources (EASA Press Release, 2025).
Dive into Technavio's robust research methodology, blending expert interviews, extensive data synthesis, and validated models for unparalleled Commercial Airlines Market insights. See full methodology.
Market Scope
|
Report Coverage
|
Details
|
Page number
|
197
|
Base year
|
2024
|
Historic period
|
2019-2023 |
Forecast period
|
2025-2029
|
Growth momentum & CAGR
|
Accelerate at a CAGR of 8.7%
|
Market growth 2025-2029
|
USD 430.2 billion
|
Market structure
|
Fragmented
|
YoY growth 2024-2025(%)
|
7.8
|
Key countries
|
US, Canada, Germany, UK, Italy, France, China, India, Japan, Brazil, Egypt, UAE, Oman, Argentina, and KSA
|
Competitive landscape
|
Leading Companies, Market Positioning of Companies, Competitive Strategies, and Industry Risks
|
Request Free Sample
Research Analyst Overview
- The commercial aviation industry is a dynamic and ever-evolving sector, encompassing various elements that ensure the smooth operation of airline businesses. In-flight entertainment systems keep passengers engaged during their journey, while maintenance, repair, and overhaul services ensure the airworthiness of aircraft. Airline alliances facilitate cooperation and collaboration among carriers, enabling more extensive networks and enhanced passenger experiences. Aircraft navigation and weather forecasting technologies play crucial roles in ensuring safe and efficient flight operations. Flight simulation and data analysis tools help pilots prepare for various scenarios and optimize performance, while avionics systems enable real-time communication and navigation. Airline scheduling and operations are facilitated by advanced software, allowing for efficient fleet optimization and revenue management.
- Passenger safety remains a top priority, with ongoing advancements in aircraft design and technology. Ground support equipment and aircraft leasing services provide essential support, ensuring the continuous availability of aircraft for airline operations. Fuel efficiency and passenger experience are key focus areas, driving innovation in aircraft design and aviation technology. Code sharing agreements and safety management systems facilitate collaboration and enhance operational efficiency. Aviation security measures ensure the safety and security of passengers and aircraft, while air traffic control systems manage the complex logistics of air travel. Pilot training programs and flight planning tools enable safe and efficient flight operations, and baggage handling systems streamline the passenger experience.
- Aircraft certification processes ensure the safety and compliance of aircraft, while engine maintenance and crew management systems ensure the ongoing reliability and performance of aircraft and crews. Overall, the commercial aviation industry is a complex and dynamic ecosystem, driven by continuous innovation and the pursuit of operational efficiency and passenger satisfaction.
What are the Key Data Covered in this Commercial Airlines Market Research and Growth Report?
-
What is the expected growth of the Commercial Airlines Market between 2025 and 2029?
-
What segmentation does the market report cover?
-
The report is segmented by Revenue Stream (Passenger and Cargo), Type (International and Domestic), Geography (APAC, Europe, North America, Middle East and Africa, and South America), Range Outlook (Short-haul, Medium-haul, Long-haul, and Ultra-long haul), Fuel Efficiency (Conventional Jet Fuel, Biofuels, Electric Propulsion, and Hydrogen-powered), Operation Model (Scheduled Flights, Charter Flights, and Wet Leasing), and Business Model (Network Carriers, Point-to-Point Carriers, and Ultra-Low-Cost Carriers (ULCCs))
-
Which regions are analyzed in the report?
-
APAC, Europe, North America, Middle East and Africa, and South America
-
What are the key growth drivers and market challenges?
-
Who are the major players in the Commercial Airlines Market?
-
Air China Ltd., Air France KLM SA, Air Transport Services Group Inc., American Airlines Group Inc., Ana Holdings Inc., China Eastern Airlines Co. Ltd., China Southern Airlines Corp. Ltd., Copa Holdings SA, Delta Air Lines Inc., Deutsche Lufthansa AG, easyJet plc, Green Africa Airways Ltd., Hahn Air Lines GmbH, InterGlobe Aviation Ltd., International Consolidated Airlines Group SA, Japan Airlines Co. Ltd., John Swire and Sons Ltd., Qantas Airways Ltd., Southwest Airlines Co., and United Airlines Inc.
Market Research Insights
- The market is a dynamic and complex industry characterized by constant evolution. Two key indicators illustrate this trend. First, annual aircraft turnaround time, which measures the efficiency of an airline in preparing an aircraft for its next flight, has decreased by 15% over the past decade. This reduction in turnaround time allows airlines to increase their fleet utilization and improve on-time performance. Second, the average load factor, representing the percentage of seats filled on each flight, has risen by 5% over the same period. This increase in passenger load reflects growing demand for air travel and airlines' efforts to optimize capacity planning and yield management.
- Airline mergers, crew scheduling, route planning, and network expansion are among the factors driving these trends. Aircraft disposal, maintenance costs, and pilot fatigue are among the challenges airlines face in managing their operations. Effective air traffic management, baggage mishaps, customer satisfaction, and airport congestion also impact the industry's performance.
We can help! Our analysts can customize this commercial airlines market research report to meet your requirements.
Get in touch
1 Executive Summary
- 1.1 Market overview
- Executive Summary - Chart on Market Overview
- Executive Summary - Data Table on Market Overview
- Executive Summary - Chart on Global Market Characteristics
- Executive Summary - Chart on Market by Geography
- Executive Summary - Chart on Market Segmentation by Revenue Stream
- Executive Summary - Chart on Market Segmentation by Type
- Executive Summary - Chart on Incremental Growth
- Executive Summary - Data Table on Incremental Growth
- Executive Summary - Chart on Company Market Positioning
2 Technavio Analysis
- 2.1 Analysis of price sensitivity, lifecycle, customer purchase basket, adoption rates, and purchase criteria
- Analysis of price sensitivity, lifecycle, customer purchase basket, adoption rates, and purchase criteria
- 2.2 Criticality of inputs and Factors of differentiation
- Overview on criticality of inputs and factors of differentiation
- 2.3 Factors of disruption
- Overview on factors of disruption
- 2.4 Impact of drivers and challenges
- Impact of drivers and challenges in 2024 and 2029
3 Market Landscape
- 3.1 Market ecosystem
- Parent Market
- Data Table on - Parent Market
- 3.2 Market characteristics
- Market characteristics analysis
4 Market Sizing
- 4.1 Market definition
- Offerings of companies included in the market definition
- 4.2 Market segment analysis
- 4.4 Market outlook: Forecast for 2024-2029
- Chart on Global - Market size and forecast 2024-2029 ($ billion)
- Data Table on Global - Market size and forecast 2024-2029 ($ billion)
- Chart on Global Market: Year-over-year growth 2024-2029 (%)
- Data Table on Global Market: Year-over-year growth 2024-2029 (%)
5 Historic Market Size
- 5.1 Global Commercial Airlines Market 2019 - 2023
- Historic Market Size - Data Table on Global Commercial Airlines Market 2019 - 2023 ($ billion)
- 5.2 Revenue Stream segment analysis 2019 - 2023
- Historic Market Size - Revenue Stream Segment 2019 - 2023 ($ billion)
- 5.3 Type segment analysis 2019 - 2023
- Historic Market Size - Type Segment 2019 - 2023 ($ billion)
- 5.4 Geography segment analysis 2019 - 2023
- Historic Market Size - Geography Segment 2019 - 2023 ($ billion)
- 5.5 Country segment analysis 2019 - 2023
- Historic Market Size - Country Segment 2019 - 2023 ($ billion)
6 Qualitative Analysis
- 6.1 Impact of AI on Global Commercial Airlines Market
7 Five Forces Analysis
- 7.1 Five forces summary
- Five forces analysis - Comparison between 2024 and 2029
- 7.2 Bargaining power of buyers
- Bargaining power of buyers - Impact of key factors 2024 and 2029
- 7.3 Bargaining power of suppliers
- Bargaining power of suppliers - Impact of key factors in 2024 and 2029
- 7.4 Threat of new entrants
- Threat of new entrants - Impact of key factors in 2024 and 2029
- 7.5 Threat of substitutes
- Threat of substitutes - Impact of key factors in 2024 and 2029
- 7.6 Threat of rivalry
- Threat of rivalry - Impact of key factors in 2024 and 2029
- 7.7 Market condition
- Chart on Market condition - Five forces 2024 and 2029
8 Market Segmentation by Revenue Stream
- 8.1 Market segments
- Chart on Revenue Stream - Market share (2024-2029) (%)
- Data Table on Revenue Stream - Market share (2024-2029) (%)
- 8.2 Comparison by Revenue Stream
- Chart on Comparison by Revenue Stream
- Data Table on Comparison by Revenue Stream
- 8.3 Passenger - Market size and forecast (2024-2029)
- Chart on Passenger - Market size and forecast (2024-2029) ($ billion)
- Data Table on Passenger - Market size and forecast (2024-2029) ($ billion)
- Chart on Passenger - Year-over-year growth (2024-2029) (%)
- Data Table on Passenger - Year-over-year growth (2024-2029) (%)
- 8.4 Cargo - Market size and forecast (2024-2029)
- Chart on Cargo - Market size and forecast (2024-2029) ($ billion)
- Data Table on Cargo - Market size and forecast (2024-2029) ($ billion)
- Chart on Cargo - Year-over-year growth (2024-2029) (%)
- Data Table on Cargo - Year-over-year growth (2024-2029) (%)
- 8.5 Market opportunity by Revenue Stream
- Market opportunity by Revenue Stream ($ billion)
- Data Table on Market opportunity by Revenue Stream ($ billion)
9 Market Segmentation by Type
- 9.1 Market segments
- Chart on Type - Market share (2024-2029) (%)
- Data Table on Type - Market share (2024-2029) (%)
- 9.2 Comparison by Type
- Chart on Comparison by Type
- Data Table on Comparison by Type
- 9.3 International - Market size and forecast (2024-2029)
- Chart on International - Market size and forecast (2024-2029) ($ billion)
- Data Table on International - Market size and forecast (2024-2029) ($ billion)
- Chart on International - Year-over-year growth (2024-2029) (%)
- Data Table on International - Year-over-year growth (2024-2029) (%)
- 9.4 Domestic - Market size and forecast (2024-2029)
- Chart on Domestic - Market size and forecast (2024-2029) ($ billion)
- Data Table on Domestic - Market size and forecast (2024-2029) ($ billion)
- Chart on Domestic - Year-over-year growth (2024-2029) (%)
- Data Table on Domestic - Year-over-year growth (2024-2029) (%)
- 9.5 Market opportunity by Type
- Market opportunity by Type ($ billion)
- Data Table on Market opportunity by Type ($ billion)
10 Market Segmentation by Range Outlook
- 10.1 Market segments
- Chart on Range Outlook - Market share (2024-2029) (%)
- Data Table on Range Outlook - Market share (2024-2029) (%)
- 10.2 Comparison by Range Outlook
- Chart on Comparison by Range Outlook
- Data Table on Comparison by Range Outlook
- 10.3 Short-haul - Market size and forecast (2024-2029)
- Chart on Short-haul - Market size and forecast (2024-2029) ($ billion)
- Data Table on Short-haul - Market size and forecast (2024-2029) ($ billion)
- Chart on Short-haul - Year-over-year growth (2024-2029) (%)
- Data Table on Short-haul - Year-over-year growth (2024-2029) (%)
- 10.4 Medium-haul - Market size and forecast (2024-2029)
- Chart on Medium-haul - Market size and forecast (2024-2029) ($ billion)
- Data Table on Medium-haul - Market size and forecast (2024-2029) ($ billion)
- Chart on Medium-haul - Year-over-year growth (2024-2029) (%)
- Data Table on Medium-haul - Year-over-year growth (2024-2029) (%)
- 10.5 Long-haul - Market size and forecast (2024-2029)
- Chart on Long-haul - Market size and forecast (2024-2029) ($ billion)
- Data Table on Long-haul - Market size and forecast (2024-2029) ($ billion)
- Chart on Long-haul - Year-over-year growth (2024-2029) (%)
- Data Table on Long-haul - Year-over-year growth (2024-2029) (%)
- 10.6 Ultra-long haul - Market size and forecast (2024-2029)
- Chart on Ultra-long haul - Market size and forecast (2024-2029) ($ billion)
- Data Table on Ultra-long haul - Market size and forecast (2024-2029) ($ billion)
- Chart on Ultra-long haul - Year-over-year growth (2024-2029) (%)
- Data Table on Ultra-long haul - Year-over-year growth (2024-2029) (%)
- 10.7 Market opportunity by Range Outlook
- Market opportunity by Range Outlook ($ billion)
- Data Table on Market opportunity by Range Outlook ($ billion)
11 Market Segmentation by Fuel Efficiency
- 11.1 Market segments
- Chart on Fuel Efficiency - Market share (2024-2029) (%)
- Data Table on Fuel Efficiency - Market share (2024-2029) (%)
- 11.2 Comparison by Fuel Efficiency
- Chart on Comparison by Fuel Efficiency
- Data Table on Comparison by Fuel Efficiency
- 11.3 Conventional Jet Fuel - Market size and forecast (2024-2029)
- Chart on Conventional Jet Fuel - Market size and forecast (2024-2029) ($ billion)
- Data Table on Conventional Jet Fuel - Market size and forecast (2024-2029) ($ billion)
- Chart on Conventional Jet Fuel - Year-over-year growth (2024-2029) (%)
- Data Table on Conventional Jet Fuel - Year-over-year growth (2024-2029) (%)
- 11.4 Biofuels - Market size and forecast (2024-2029)
- Chart on Biofuels - Market size and forecast (2024-2029) ($ billion)
- Data Table on Biofuels - Market size and forecast (2024-2029) ($ billion)
- Chart on Biofuels - Year-over-year growth (2024-2029) (%)
- Data Table on Biofuels - Year-over-year growth (2024-2029) (%)
- 11.5 Electric Propulsion - Market size and forecast (2024-2029)
- Chart on Electric Propulsion - Market size and forecast (2024-2029) ($ billion)
- Data Table on Electric Propulsion - Market size and forecast (2024-2029) ($ billion)
- Chart on Electric Propulsion - Year-over-year growth (2024-2029) (%)
- Data Table on Electric Propulsion - Year-over-year growth (2024-2029) (%)
- 11.6 Hydrogen-powered - Market size and forecast (2024-2029)
- Chart on Hydrogen-powered - Market size and forecast (2024-2029) ($ billion)
- Data Table on Hydrogen-powered - Market size and forecast (2024-2029) ($ billion)
- Chart on Hydrogen-powered - Year-over-year growth (2024-2029) (%)
- Data Table on Hydrogen-powered - Year-over-year growth (2024-2029) (%)
- 11.7 Market opportunity by Fuel Efficiency
- Market opportunity by Fuel Efficiency ($ billion)
- Data Table on Market opportunity by Fuel Efficiency ($ billion)
12 Market Segmentation by Operation Model
- 12.1 Market segments
- Chart on Operation Model - Market share (2024-2029) (%)
- Data Table on Operation Model - Market share (2024-2029) (%)
- 12.2 Comparison by Operation Model
- Chart on Comparison by Operation Model
- Data Table on Comparison by Operation Model
- 12.3 Scheduled Flights - Market size and forecast (2024-2029)
- Chart on Scheduled Flights - Market size and forecast (2024-2029) ($ billion)
- Data Table on Scheduled Flights - Market size and forecast (2024-2029) ($ billion)
- Chart on Scheduled Flights - Year-over-year growth (2024-2029) (%)
- Data Table on Scheduled Flights - Year-over-year growth (2024-2029) (%)
- 12.4 Charter Flights - Market size and forecast (2024-2029)
- Chart on Charter Flights - Market size and forecast (2024-2029) ($ billion)
- Data Table on Charter Flights - Market size and forecast (2024-2029) ($ billion)
- Chart on Charter Flights - Year-over-year growth (2024-2029) (%)
- Data Table on Charter Flights - Year-over-year growth (2024-2029) (%)
- 12.5 Wet Leasing - Market size and forecast (2024-2029)
- Chart on Wet Leasing - Market size and forecast (2024-2029) ($ billion)
- Data Table on Wet Leasing - Market size and forecast (2024-2029) ($ billion)
- Chart on Wet Leasing - Year-over-year growth (2024-2029) (%)
- Data Table on Wet Leasing - Year-over-year growth (2024-2029) (%)
- 12.6 Market opportunity by Operation Model
- Market opportunity by Operation Model ($ billion)
- Data Table on Market opportunity by Operation Model ($ billion)
13 Market Segmentation by Business Model
- 13.1 Market segments
- Chart on Business Model - Market share (2024-2029) (%)
- Data Table on Business Model - Market share (2024-2029) (%)
- 13.2 Comparison by Business Model
- Chart on Comparison by Business Model
- Data Table on Comparison by Business Model
- 13.3 Network Carriers - Market size and forecast (2024-2029)
- Chart on Network Carriers - Market size and forecast (2024-2029) ($ billion)
- Data Table on Network Carriers - Market size and forecast (2024-2029) ($ billion)
- Chart on Network Carriers - Year-over-year growth (2024-2029) (%)
- Data Table on Network Carriers - Year-over-year growth (2024-2029) (%)
- 13.4 Point-to-Point Carriers - Market size and forecast (2024-2029)
- Chart on Point-to-Point Carriers - Market size and forecast (2024-2029) ($ billion)
- Data Table on Point-to-Point Carriers - Market size and forecast (2024-2029) ($ billion)
- Chart on Point-to-Point Carriers - Year-over-year growth (2024-2029) (%)
- Data Table on Point-to-Point Carriers - Year-over-year growth (2024-2029) (%)
- 13.5 Ultra-Low-Cost Carriers (ULCCs) - Market size and forecast (2024-2029)
- Chart on Ultra-Low-Cost Carriers (ULCCs) - Market size and forecast (2024-2029) ($ billion)
- Data Table on Ultra-Low-Cost Carriers (ULCCs) - Market size and forecast (2024-2029) ($ billion)
- Chart on Ultra-Low-Cost Carriers (ULCCs) - Year-over-year growth (2024-2029) (%)
- Data Table on Ultra-Low-Cost Carriers (ULCCs) - Year-over-year growth (2024-2029) (%)
- 13.6 Market opportunity by Business Model
- Market opportunity by Business Model ($ billion)
- Data Table on Market opportunity by Business Model ($ billion)
14 Customer Landscape
- 14.1 Customer landscape overview
- Analysis of price sensitivity, lifecycle, customer purchase basket, adoption rates, and purchase criteria
15 Geographic Landscape
- 15.1 Geographic segmentation
- Chart on Market share by geography 2024-2029 (%)
- Data Table on Market share by geography 2024-2029 (%)
- 15.2 Geographic comparison
- Chart on Geographic comparison
- Data Table on Geographic comparison
- 15.3 APAC - Market size and forecast 2024-2029
- Chart on APAC - Market size and forecast 2024-2029 ($ billion)
- Data Table on APAC - Market size and forecast 2024-2029 ($ billion)
- Chart on APAC - Year-over-year growth 2024-2029 (%)
- Data Table on APAC - Year-over-year growth 2024-2029 (%)
- 15.4 Europe - Market size and forecast 2024-2029
- Chart on Europe - Market size and forecast 2024-2029 ($ billion)
- Data Table on Europe - Market size and forecast 2024-2029 ($ billion)
- Chart on Europe - Year-over-year growth 2024-2029 (%)
- Data Table on Europe - Year-over-year growth 2024-2029 (%)
- 15.5 North America - Market size and forecast 2024-2029
- Chart on North America - Market size and forecast 2024-2029 ($ billion)
- Data Table on North America - Market size and forecast 2024-2029 ($ billion)
- Chart on North America - Year-over-year growth 2024-2029 (%)
- Data Table on North America - Year-over-year growth 2024-2029 (%)
- 15.6 Middle East and Africa - Market size and forecast 2024-2029
- Chart on Middle East and Africa - Market size and forecast 2024-2029 ($ billion)
- Data Table on Middle East and Africa - Market size and forecast 2024-2029 ($ billion)
- Chart on Middle East and Africa - Year-over-year growth 2024-2029 (%)
- Data Table on Middle East and Africa - Year-over-year growth 2024-2029 (%)
- 15.7 South America - Market size and forecast 2024-2029
- Chart on South America - Market size and forecast 2024-2029 ($ billion)
- Data Table on South America - Market size and forecast 2024-2029 ($ billion)
- Chart on South America - Year-over-year growth 2024-2029 (%)
- Data Table on South America - Year-over-year growth 2024-2029 (%)
- 15.8 US - Market size and forecast 2024-2029
- Chart on US - Market size and forecast 2024-2029 ($ billion)
- Data Table on US - Market size and forecast 2024-2029 ($ billion)
- Chart on US - Year-over-year growth 2024-2029 (%)
- Data Table on US - Year-over-year growth 2024-2029 (%)
- 15.9 China - Market size and forecast 2024-2029
- Chart on China - Market size and forecast 2024-2029 ($ billion)
- Data Table on China - Market size and forecast 2024-2029 ($ billion)
- Chart on China - Year-over-year growth 2024-2029 (%)
- Data Table on China - Year-over-year growth 2024-2029 (%)
- 15.10 India - Market size and forecast 2024-2029
- Chart on India - Market size and forecast 2024-2029 ($ billion)
- Data Table on India - Market size and forecast 2024-2029 ($ billion)
- Chart on India - Year-over-year growth 2024-2029 (%)
- Data Table on India - Year-over-year growth 2024-2029 (%)
- 15.11 Germany - Market size and forecast 2024-2029
- Chart on Germany - Market size and forecast 2024-2029 ($ billion)
- Data Table on Germany - Market size and forecast 2024-2029 ($ billion)
- Chart on Germany - Year-over-year growth 2024-2029 (%)
- Data Table on Germany - Year-over-year growth 2024-2029 (%)
- 15.12 Japan - Market size and forecast 2024-2029
- Chart on Japan - Market size and forecast 2024-2029 ($ billion)
- Data Table on Japan - Market size and forecast 2024-2029 ($ billion)
- Chart on Japan - Year-over-year growth 2024-2029 (%)
- Data Table on Japan - Year-over-year growth 2024-2029 (%)
- 15.13 UK - Market size and forecast 2024-2029
- Chart on UK - Market size and forecast 2024-2029 ($ billion)
- Data Table on UK - Market size and forecast 2024-2029 ($ billion)
- Chart on UK - Year-over-year growth 2024-2029 (%)
- Data Table on UK - Year-over-year growth 2024-2029 (%)
- 15.14 France - Market size and forecast 2024-2029
- Chart on France - Market size and forecast 2024-2029 ($ billion)
- Data Table on France - Market size and forecast 2024-2029 ($ billion)
- Chart on France - Year-over-year growth 2024-2029 (%)
- Data Table on France - Year-over-year growth 2024-2029 (%)
- 15.15 Canada - Market size and forecast 2024-2029
- Chart on Canada - Market size and forecast 2024-2029 ($ billion)
- Data Table on Canada - Market size and forecast 2024-2029 ($ billion)
- Chart on Canada - Year-over-year growth 2024-2029 (%)
- Data Table on Canada - Year-over-year growth 2024-2029 (%)
- 15.16 Italy - Market size and forecast 2024-2029
- Chart on Italy - Market size and forecast 2024-2029 ($ billion)
- Data Table on Italy - Market size and forecast 2024-2029 ($ billion)
- Chart on Italy - Year-over-year growth 2024-2029 (%)
- Data Table on Italy - Year-over-year growth 2024-2029 (%)
- 15.17 Brazil - Market size and forecast 2024-2029
- Chart on Brazil - Market size and forecast 2024-2029 ($ billion)
- Data Table on Brazil - Market size and forecast 2024-2029 ($ billion)
- Chart on Brazil - Year-over-year growth 2024-2029 (%)
- Data Table on Brazil - Year-over-year growth 2024-2029 (%)
- 15.18 Market opportunity by geography
- Market opportunity by geography ($ billion)
- Data Tables on Market opportunity by geography ($ billion)
- 15.19 Egypt - Market size and forecast (2024-2029)
- Chart on Egypt - Market size and forecast (2024-2029) ($ billion)
- Data Table on Egypt - Market size and forecast (2024-2029) ($ billion)
- Chart on Egypt - Year-over-year growth (2024-2029) (%)
- Data Table on Egypt - Year-over-year growth (2024-2029) (%)
- 15.20 UAE - Market size and forecast (2024-2029)
- Chart on UAE - Market size and forecast (2024-2029) ($ billion)
- Data Table on UAE - Market size and forecast (2024-2029) ($ billion)
- Chart on UAE - Year-over-year growth (2024-2029) (%)
- Data Table on UAE - Year-over-year growth (2024-2029) (%)
- 15.21 Oman - Market size and forecast (2024-2029)
- Chart on Oman - Market size and forecast (2024-2029) ($ billion)
- Data Table on Oman - Market size and forecast (2024-2029) ($ billion)
- Chart on Oman - Year-over-year growth (2024-2029) (%)
- Data Table on Oman - Year-over-year growth (2024-2029) (%)
- 15.22 Argentina - Market size and forecast (2024-2029)
- Chart on Argentina - Market size and forecast (2024-2029) ($ billion)
- Data Table on Argentina - Market size and forecast (2024-2029) ($ billion)
- Chart on Argentina - Year-over-year growth (2024-2029) (%)
- Data Table on Argentina - Year-over-year growth (2024-2029) (%)
- 15.23 KSA - Market size and forecast (2024-2029)
- Chart on KSA - Market size and forecast (2024-2029) ($ billion)
- Data Table on KSA - Market size and forecast (2024-2029) ($ billion)
- Chart on KSA - Year-over-year growth (2024-2029) (%)
- Data Table on KSA - Year-over-year growth (2024-2029) (%)
- 15.24 Rest of World (ROW) - Market size and forecast (2024-2029)
- Chart on Rest of World (ROW) - Market size and forecast (2024-2029) ($ billion)
- Data Table on Rest of World (ROW) - Market size and forecast (2024-2029) ($ billion)
- Chart on Rest of World (ROW) - Year-over-year growth (2024-2029) (%)
- Data Table on Rest of World (ROW) - Year-over-year growth (2024-2029) (%)
16 Drivers, Challenges, and Opportunity/Restraints
- 16.3 Impact of drivers and challenges
- Impact of drivers and challenges in 2024 and 2029
- 16.4 Market opportunities/restraints
17 Competitive Landscape
- 17.2 Competitive Landscape
- Overview on criticality of inputs and factors of differentiation
- 17.3 Landscape disruption
- Overview on factors of disruption
- 17.4 Industry risks
- Impact of key risks on business
18 Competitive Analysis
- 18.2 Company ranking index
- 18.3 Market positioning of companies
- Matrix on companies position and classification
- 18.4 Air China Ltd.
- Air China Ltd. - Overview
- Air China Ltd. - Business segments
- Air China Ltd. - Key offerings
- Air China Ltd. - Segment focus
- SWOT
- 18.5 Air France KLM SA
- Air France KLM SA - Overview
- Air France KLM SA - Business segments
- Air France KLM SA - Key offerings
- Air France KLM SA - Segment focus
- SWOT
- 18.6 Air Transport Services Group Inc.
- Air Transport Services Group Inc. - Overview
- Air Transport Services Group Inc. - Business segments
- Air Transport Services Group Inc. - Key offerings
- Air Transport Services Group Inc. - Segment focus
- SWOT
- 18.7 American Airlines Group Inc.
- American Airlines Group Inc. - Overview
- American Airlines Group Inc. - Product / Service
- American Airlines Group Inc. - Key offerings
- SWOT
- 18.8 Ana Holdings Inc.
- Ana Holdings Inc. - Overview
- Ana Holdings Inc. - Business segments
- Ana Holdings Inc. - Key offerings
- Ana Holdings Inc. - Segment focus
- SWOT
- 18.9 China Eastern Airlines Co. Ltd.
- China Eastern Airlines Co. Ltd. - Overview
- China Eastern Airlines Co. Ltd. - Business segments
- China Eastern Airlines Co. Ltd. - Key offerings
- China Eastern Airlines Co. Ltd. - Segment focus
- SWOT
- 18.10 China Southern Airlines Corp. Ltd.
- China Southern Airlines Corp. Ltd. - Overview
- China Southern Airlines Corp. Ltd. - Business segments
- China Southern Airlines Corp. Ltd. - Key offerings
- China Southern Airlines Corp. Ltd. - Segment focus
- SWOT
- 18.11 Delta Air Lines Inc.
- Delta Air Lines Inc. - Overview
- Delta Air Lines Inc. - Business segments
- Delta Air Lines Inc. - Key offerings
- Delta Air Lines Inc. - Segment focus
- SWOT
- 18.12 Deutsche Lufthansa AG
- Deutsche Lufthansa AG - Overview
- Deutsche Lufthansa AG - Business segments
- Deutsche Lufthansa AG - Key news
- Deutsche Lufthansa AG - Key offerings
- Deutsche Lufthansa AG - Segment focus
- SWOT
- 18.13 International Consolidated Airlines Group SA
- International Consolidated Airlines Group SA - Overview
- International Consolidated Airlines Group SA - Product / Service
- International Consolidated Airlines Group SA - Key offerings
- SWOT
- 18.14 Japan Airlines Co. Ltd.
- Japan Airlines Co. Ltd. - Overview
- Japan Airlines Co. Ltd. - Product / Service
- Japan Airlines Co. Ltd. - Key offerings
- SWOT
- 18.15 John Swire and Sons Ltd.
- John Swire and Sons Ltd. - Overview
- John Swire and Sons Ltd. - Product / Service
- John Swire and Sons Ltd. - Key offerings
- SWOT
- 18.16 Qantas Airways Ltd.
- Qantas Airways Ltd. - Overview
- Qantas Airways Ltd. - Business segments
- Qantas Airways Ltd. - Key offerings
- Qantas Airways Ltd. - Segment focus
- SWOT
- 18.17 Southwest Airlines Co.
- Southwest Airlines Co. - Overview
- Southwest Airlines Co. - Product / Service
- Southwest Airlines Co. - Key offerings
- SWOT
- 18.18 United Airlines Inc.
- United Airlines Inc. - Overview
- United Airlines Inc. - Product / Service
- United Airlines Inc. - Key offerings
- SWOT
19 Appendix
- 19.2 Inclusions and exclusions checklist
- Inclusions checklist
- Exclusions checklist
- 19.3 Currency conversion rates for US$
- Currency conversion rates for US$
- 19.4 Research methodology
- 19.7 Validation techniques employed for market sizing
- Validation techniques employed for market sizing
- 19.9 360 degree market analysis
- 360 degree market analysis
- 19.10 List of abbreviations