Nonwoven Filter Media Market Size 2024-2028
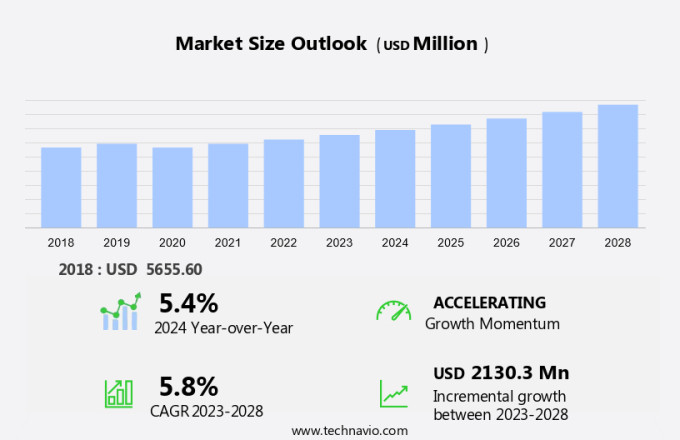
The nonwoven filter media market size is forecast to increase by USD 2.13 billion at a CAGR of 5.8% between 2023 and 2028.
- The market is experiencing significant growth due to its increasing utilization in various filtration applications, particularly in the HVAC industry and hygiene sectors. These filters are essential components in air filtration systems used in HVAC units, industrial processes, and automotive applications. The advancement of nonwoven technology, such as electrostatic filtration and nano-fiber-based media, has led to enhanced filtration performance, making it a preferred choice over traditional filter media. However, the market faces challenges in energy applications due to the limitations of nonwoven filter media in terms of energy efficiency. In the food and beverage industry, nonwoven filter media is gaining popularity as a solution for liquid filtration systems, ensuring product purity and safety. Overall, the market's growth is driven by the demand for high-performance filtration solutions and the continuous development of innovative nonwoven filter media technologies.
What will be the Size of the Market During the Forecast Period?
- Nonwoven filter media have gained significant importance in various industries due to their ability to provide efficient filtration solutions. In addition, they play a crucial role in water filtration systems, including reverse osmosis and clean water supply. The market caters to diverse sectors such as residential, industrial, healthcare, personal care, geotextiles, and others. In the industrial sector, these filters are extensively used in air and water filtration systems to ensure optimal operating conditions and maintain product quality.
- In the healthcare sector, nonwoven filter media are used to ensure clean air and water in hospitals and laboratories. Nonwoven filter media are made from raw materials such as polymers, resins, fibers, and additives. Meltblown technology is a popular method used to manufacture these filters, which results in high filtration efficiency and excellent air and water flow rates. The versatility of nonwoven filter media makes them suitable for various applications, including municipal water treatment and chemical processing. Water pollution and air pollution are major environmental concerns, and nonwoven filter media play a vital role in mitigating these issues.
- In water filtration, these filters help remove impurities, including heavy metals, bacteria, and other contaminants, ensuring clean drinking water. In air filtration, nonwoven filter media trap particles and pollutants, improving indoor air quality and reducing the risk of respiratory diseases. The market is driven by the increasing demand for clean air and water in various industries and applications. The rising awareness of environmental issues and stringent regulations are also contributing to the growth of this market. However, the market is influenced by factors such as oil prices and the availability of raw materials, which can impact the cost of production and, consequently, the price of nonwoven filter media.
How is this market segmented and which is the largest segment?
The market research report provides comprehensive data (region-wise segment analysis), with forecasts and estimates in "USD billion" for the period 2024-2028, as well as historical data from 2018-2022 for the following segments.
- End-user
- Transportation
- Water
- HVAC
- Food and beverage
- Others
- Geography
- APAC
- China
- India
- Japan
- South Korea
- North America
- Canada
- US
- Europe
- Germany
- UK
- France
- Italy
- South America
- Middle East and Africa
- APAC
By End-user Insights
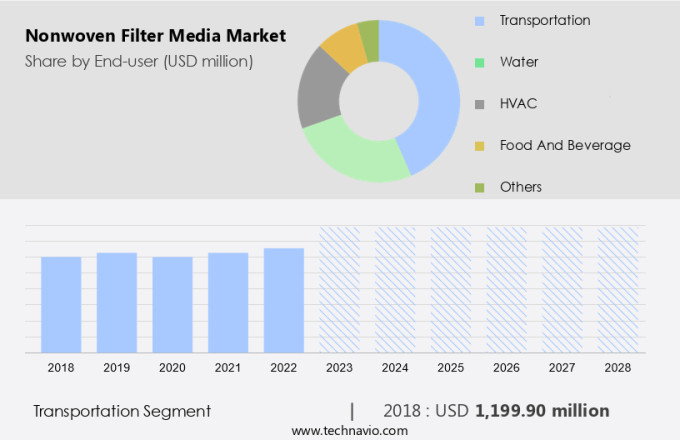
- The transportation segment is estimated to witness significant growth during the forecast period.
The market in the United States is expected to grow significantly during the forecast period, driven by the extensive use of these media in various industries, particularly in filtration solutions for chemicals, food and beverages, and transportation. Nonwoven technology, including electrostatic filtration and nano-fiber-based media, offers superior filtration performance, making it an ideal choice for numerous applications. In the transportation sector, nonwoven filter media are widely utilized in vehicles for engine air, cabin air, lubricants, and fuel filtration. The increasing production and sales of vehicles, coupled with growing environmental concerns and stringent emissions regulations, are major factors driving the demand for nonwoven filter media.
Moreover, the expansion of the electric vehicle market and advancements in automotive technology are expected to further boost the demand for high-performance filtration solutions. The Asia Pacific region, including countries like China and India, is expected to dominate the global market due to rapid industrialization, urbanization, and the growing automotive industry. In the chemicals industry, nonwoven filter media are used extensively in various processes to remove impurities and contaminants, ensuring the production of high-quality products. In the food and beverages sector, these media are used in liquid filtration systems to ensure the purity and safety of consumables. In conclusion, the market in the United States is poised for significant growth due to its extensive use in various industries, particularly in filtration solutions for chemicals, food and beverages, and transportation.
The Asia Pacific region is expected to lead the market, driven by industrialization, urbanization, and the growing automotive industry. The use of advanced filtration technologies, such as electrostatic filtration and nano-fiber-based media, is expected to further boost the demand for nonwoven filter media.
Get a glance at the market report of share of various segments Request Free Sample
The transportation segment was valued at USD 1.19 billion in 2018 and showed a gradual increase during the forecast period.
Regional Analysis
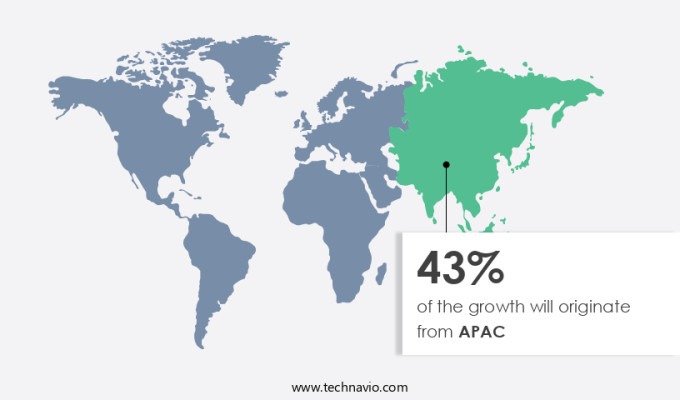
- APAC is estimated to contribute 43% to the growth of the global market during the forecast period.
Technavio's analysts have elaborately explained the regional trends and drivers that shape the market during the forecast period.
For more insights on the market share of various regions Request Free Sample
Nonwoven filter media have gained significant traction in various industries due to their effectiveness in filtration applications. In the healthcare sector, these media are extensively used in the production of personal protective equipment, medical wipes, and air purification systems. In the oil and gas industry, nonwoven filter media are utilized in dust collection and smoke filtration systems. The chemical industry also relies on nonwoven filter media for air purification in clean rooms and ventilation systems, ensuring indoor air quality. APAC, comprising countries like China, India, Bangladesh, and Vietnam, is witnessing rapid industrialization and urbanization. This trend is leading to a surge in demand for nonwoven filter media in industries such as water treatment, food and beverage, and healthcare.
The industrial water treatment market in APAC is expanding at a faster pace than in North America and Europe. China, in particular, is a major player in the industrial wastewater treatment equipment market, driven by industrialization, urbanization, and the need to address heavy metal waste. Nonwoven filter media are integral to filtration systems in these industries, enabling efficient separation of particles and pollutants. Their versatility and high filtration efficiency make them an indispensable component in various applications, including air and water filtration. The increasing focus on improving indoor air quality, particularly in commercial and residential buildings, is also fueling the demand for nonwoven filter media.
In conclusion, the market is poised for growth, driven by the expanding applications in various industries, particularly in APAC. The demand for cleaner air and water, coupled with the increasing awareness of indoor air quality, presents significant opportunities for market participants. Companies in this space are focusing on innovation and product development to cater to the evolving needs of their customers. China is a major player in the industrial wastewater treatment equipment market, driving the demand for nonwoven filter media. Improve indoor air quality and ensure water filtration efficiency with nonwoven filter media.
Market Dynamics
Our researchers analyzed the data with 2023 as the base year, along with the key drivers, trends, and challenges. A holistic analysis of drivers will help companies refine their marketing strategies to gain a competitive advantage.
What are the key market drivers leading to the rise in adoption of Nonwoven Filter Media Market?
Increasing use in HVAC systems is the key driver of the market.
- Nonwoven filter media play a crucial role in enhancing filtration efficiency, particularly in fine particle filtration applications. These filters are extensively utilized in various industries, including healthcare and personal care, to ensure the purity of air and water. In healthcare settings, nonwoven filters are employed to maintain sterile environments and protect against the spread of airborne diseases. In personal care, they are used in masks and filters for air purifiers. Beyond these industries, nonwoven filter media find extensive applications in geotextiles for soil stabilization and water pollution control. They also contribute significantly to mitigating air pollution by trapping particulate matter in industrial processes and vehicular emissions.
- The raw materials used in producing nonwoven filter media include polymers, resins, fibers, and additives. Polymers and resins serve as binders to hold the fibers together, while fibers provide the filter medium. Additives enhance the filter's performance, such as increasing filtration efficiency or reducing moisture absorption. The demand for nonwoven filter media is driven by the growing concern for environmental sustainability and the need for energy-efficient solutions. In the US, there is a significant market for these filters, particularly in HVAC systems for air filtration. HVAC systems ensure thermal balance and maintain high indoor air quality. The choice of HVAC system depends on factors like heating and cooling requirements and the air quality of the environment. Energy-efficient and sustainable HVAC systems, such as chillers, variable refrigerant flow (VRF), and air handling units (AHUs), are gaining popularity due to their lower energy consumption and cost-effectiveness. These systems are increasingly being adopted in both residential and commercial establishments, further boosting the demand for nonwoven filter media.
What are the market trends shaping the Nonwoven Filter Media Market?
Development of high-efficiency filters is the upcoming trend in the market.
- Nonwoven filter media plays a crucial role in various applications, including air filtration systems for HVAC units and industrial processes, as well as automotive air filters and water filtration systems. In the context of air filtration, extended filtration cycles and reduced cleaning frequency contribute to the longevity of the filter media. Freudenberg Filtration Technologies GmbH & Co. KG offers innovative filter solutions that deliver long service life and cost savings.
- For example, their sinTexx Plus filter media, featuring a corrugated polyester base with a nanofiber layer, effectively captures fine smoke particles generated during welding, cutting, and coating processes. Compared to conventional polyester media or ePTFE membrane media, this system boasts enhanced performance, resulting in improved energy efficiency and overall filter system efficiency. In the realm of water filtration, nonwoven filter media is integral to technologies like reverse osmosis and clean drinking water supply for residential, industrial, and municipal applications.
What challenges does Nonwoven Filter Media Market face during the growth?
Limitations of nonwoven filter media products in energy applications is a key challenge affecting the market growth.
- Nonwoven filter media plays a crucial role in the filtration of air intake for gas turbines, which are widely used in power generation and industrial processes, as well as in compressors for pipelines, refineries, and chemical plants. The significant volume of air intake in these applications necessitates effective filtration to ensure optimal performance and efficiency of the turbines. However, the use of nonwoven filter media in these applications can lead to frequent filter replacements, necessitating system shutdowns. This can result in substantial costs for operators, particularly in industries such as LNG production. Nonwoven filter media may not be the most cost-effective solution for filtration applications in offshore platforms, such as those in the oil and gas industry.
Meltblown technology, Wetlaid technology, and Needlepunch technology are alternative filter media technologies that offer extended filter life and reduced maintenance requirements. In the transportation sector, nonwoven filter media is extensively used in cabin air filtration, oil filtration, engine air filtration, and fuel filtration. HVAC systems in buildings also utilize nonwoven filter media for air filtration. The high demand for these applications is driven by the need for clean air and efficient filtration systems.
Exclusive Customer Landscape
The market forecasting report includes the adoption lifecycle of the market, covering from the innovator's stage to the laggard's stage. It focuses on adoption rates in different regions based on penetration. Furthermore, the market report also includes key purchase criteria and drivers of price sensitivity to help companies evaluate and develop their market growth analysis strategies.

Customer Landscape
Key Companies & Market Insights
Companies are implementing various strategies, such as strategic alliances, market forecast, partnerships, mergers and acquisitions, geographical expansion, and product/service launches, to enhance their presence in the market.
The market research and growth report includes detailed analyses of the competitive landscape of the market and information about key companies, including:
- 3M Co.
- Ahlstrom Munksjo Oyj
- Aim Nonwovens and Interiors Pvt. Ltd.
- Apextech Fiber Corp.
- Arrow Technical Textiles Pvt. Ltd.
- Berry Global Inc.
- Cerex Advanced Fabrics Inc.
- DuPont de Nemours Inc.
- Fitesa S.A. and Affiliates
- Freudenberg and Co. KG
- Ginni Spectra Pvt. Ltd.
- Johns Manville Corp.
- Kimberly Clark Corp.
- Lydall Inc.
- M M HYDRO PNEUMATICS Pvt. Ltd.
- Park Industries
- Sandler AG
- Schweitzer Mauduit International Inc.
- Tulip Fabrics Pvt. Ltd.
- TWE GmbH and Co. KG
Qualitative and quantitative analysis of companies has been conducted to help clients understand the wider business environment as well as the strengths and weaknesses of key market players. Data is qualitatively analyzed to categorize companies as pure play, category-focused, industry-focused, and diversified; it is quantitatively analyzed to categorize companies as dominant, leading, strong, tentative, and weak.
Research Analyst Overview
Nonwoven filter media is a vital component in various filtration systems, including air filtration systems for HVAC units and industrial applications, as well as automotive air filters. This media plays a significant role in ensuring clean water supply through water filtration systems, such as reverse osmosis and nanofiber-based media for clean drinking water. The market caters to diverse filtration applications, ranging from residential and industrial to municipal, in sectors like chemicals, food and beverages, and healthcare. The technology behind nonwoven filter media includes electrostatic filtration, carded nonwovens, wetlaid nonwovens, meltblown nonwovens, spunbonded nonwovens, airlaid nonwovens, and nano-fiber-based media. These filtration solutions are essential in various industries, including healthcare, where they are used in personal protective equipment, medical wipes, and air purification systems for hospitals and clean rooms.
In the oil and gas industry, nonwoven filter media is used for dust collection, smoke filtration, and oil filtration. The raw materials used in producing nonwoven filter media include polymers, resins, fibers, and additives. The filtration performance of nonwoven filter media is crucial in various applications, such as HEPA filters, liquid filtration systems, and fine particle filtration. Nonwoven filter media is also used in geotextiles for water pollution control and air pollution abatement.
|
Market Scope |
|
|
Report Coverage |
Details |
|
Page number |
182 |
|
Base year |
2023 |
|
Historic period |
2018-2022 |
|
Forecast period |
2024-2028 |
|
Growth momentum & CAGR |
Accelerate at a CAGR of 5.8% |
|
Market growth 2024-2028 |
USD 2.13 billion |
|
Market structure |
Fragmented |
|
YoY growth 2023-2024(%) |
5.4 |
|
Key countries |
US, China, Japan, Germany, UK, India, South Korea, Canada, France, and Italy |
|
Competitive landscape |
Leading Companies, Market Positioning of Companies, Competitive Strategies, and Industry Risks |
What are the Key Data Covered in this Market Research and Growth Report?
- CAGR of the market during the forecast period
- Detailed information on factors that will drive the market growth and forecasting between 2024 and 2028
- Precise estimation of the size of the market and its contribution of the market in focus to the parent market
- Accurate predictions about upcoming market growth and trends and changes in consumer behaviour
- Growth of the market across APAC, North America, Europe, South America, and Middle East and Africa
- Thorough analysis of the market's competitive landscape and detailed information about companies
- Comprehensive analysis of factors that will challenge the growth of market companies
We can help! Our analysts can customize this market research report to meet your requirements. Get in touch