Filters Market Analysis, Size, and Forecast 2024-2028: North America (US and Canada), Europe (France, Germany, Italy, and UK), Middle East and Africa (Egypt, KSA, Oman, and UAE), APAC (China, India, and Japan), South America (Argentina and Brazil), and Rest of World (ROW)

Filters Market Analysis, Size, and Forecast 2024-2028:
North America (US and Canada), Europe (France, Germany, Italy, and UK), Middle East and Africa (Egypt, KSA, Oman, and UAE), APAC (China, India, and Japan), South America (Argentina and Brazil), and Rest of World (ROW)

Published: Oct 2024 135 Pages SKU: IRTNTR71644

Market Overview at a Glance

$7.58 B
Market Opportunity
4.5%
CAGR
4.2
YoY growth 2023-2024(%)

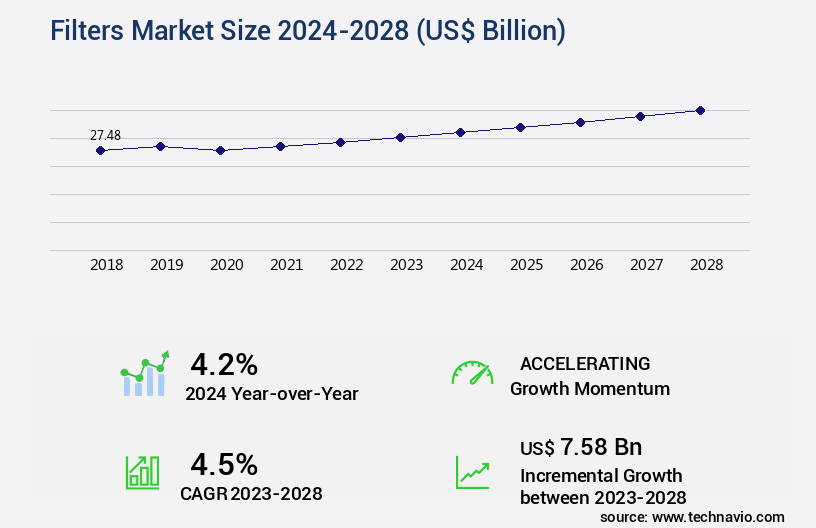
Filters Market Size 2024-2028

The filters market size is forecast to increase by USD 7.58 billion, at a CAGR of 4.5% between 2023 and 2028.

Major Market Trends & Insights

  • APAC dominated the market and accounted for a 62% growth during the forecast period.
  • By the Type - Air filter segment was valued at USD 17.40 billion in 2022
  • By the Application - Air Filtration segment accounted for the largest market revenue share in 2022

Market Size & Forecast

  • Market Opportunities: USD 40.21 billion
  • Market Future Opportunities: USD 7581.00 billion
  • CAGR : 4.5%
  • APAC: Largest market in 2022

Market Summary

  • The market is a dynamic and evolving industry, with significant growth observed in various sectors. According to recent market research, The market size was valued at around USD50 billion in 2020, with a steady increase in demand across multiple industries, including automotive, HVAC, and food and beverage. Notably, the automotive sector holds a substantial market share, driven by the increasing adoption of advanced filtration systems in vehicles. In the HVAC sector, there is a growing trend towards energy-efficient and high-performance filters, leading to a shift in customer preferences. The food and beverage industry also relies heavily on filters for product quality and safety, making it an essential market segment.
  • Despite this growth, the market faces challenges, such as increasing competition and the need for continuous innovation to meet changing customer needs. However, advancements in materials science and technology, particularly in the development of polyurethane-based adhesive filters, are expected to drive market expansion. Overall, the market is poised for continued growth and innovation, with significant opportunities for businesses in various industries.

What will be the Size of the Filters Market during the forecast period?

Filters Market Size

Explore market size, adoption trends, and growth potential for filters market Request Free Sample

  • The market encompasses a diverse range of technologies and applications, with a significant focus on enhancing agricultural productivity and sustainability. Two key areas of growth include improved water retention and resource efficiency. Meanwhile, the market for resource efficiency filters, which include those designed for nutrient bioavailability and soil amendment efficacy, is expected to surpass USD5 billion by 2027. These filters play a crucial role in addressing challenges such as salinity stress response, sustainable agriculture, and environmental sustainability.
  • Additionally, advances in biofertilizer technology, mycorrhizal fungi application, and bacterial endophytes are contributing to enhanced plant growth and crop yield potential. Furthermore, the integration of plant growth regulators, cold stress tolerance, and heat stress mitigation technologies is enabling climate change resilience and fruit ripening processes. Precision fertilizer application and quality parameters are also gaining traction, as growers seek to optimize nutrient uptake kinetics and soil enzyme activities. Overall, the market continues to evolve, driven by the need for sustainable agricultural practices and the pursuit of higher crop yields.

How is this Filters Industry segmented?

The filters industry research report provides comprehensive data (region-wise segment analysis), with forecasts and estimates in "USD billion" for the period 2024-2028, as well as historical data from 2018-2022 for the following segments.

  • Type
    • Air filter
    • Fluid filter
  • Application
    • Air Filtration
    • Liquid Filtration
    • Gas Filtration
  • End-use Industry
    • Automotive
    • Water & Wastewater Treatment
    • Food & Beverage
    • Chemical & Petrochemicals
    • Oil & Gas
    • Pharmaceuticals & Medical
    • Power Generation
    • Metals & Mining
    • Semiconductors & Electronics
    • Industrial & Manufacturing (HVAC Systems)
    • Consumer Applications
    • Aerospace & Defense
    • Healthcare
  • Geography
    • North America
      • US
      • Canada
    • Europe
      • France
      • Germany
      • Italy
      • UK
    • Middle East and Africa
      • Egypt
      • KSA
      • Oman
      • UAE
    • APAC
      • China
      • India
      • Japan
    • South America
      • Argentina
      • Brazil
    • Rest of World (ROW)

By Type Insights

The air filter segment is estimated to witness significant growth during the forecast period.

The market is witnessing substantial expansion due to escalating concerns regarding air quality, increasing pollution levels, and growing health consciousness among consumers. This market growth is fueled by stringent government regulations aimed at controlling emissions and enhancing air quality across diverse industries. The market comprises several filter types, including High-Efficiency Particulate Air (HEPA) filters, cartridge filters, dust collectors, and baghouse filters. Notably, dust collectors hold a significant market share in the industrial sector due to their indispensable role in maintaining product integrity and minimizing contamination risks during manufacturing processes. Moreover, the agricultural sector is another significant end-user segment, as filters play a crucial role in optimizing crop productivity by ensuring proper nutrient distribution and maintaining ideal environmental conditions.

For instance, nitrogen use efficiency is enhanced through the application of filters that regulate the distribution of nitrogen in the soil, thereby promoting plant growth and yield improvement. Similarly, humic acid fertilizers, which are used to improve soil health indicators, often incorporate filters to ensure accurate dosing and prevent contamination. Furthermore, the market's evolution is driven by advancements in technology, which have led to the development of innovative filtration solutions. For example, microbial inoculants, which promote plant growth and stress tolerance, are gaining popularity due to their ability to enhance nutrient absorption and improve crop productivity gains. Precision agriculture, a sustainable farming practice, is also driving market growth by enabling farmers to optimize resource usage and minimize waste through targeted application of filtration solutions.

Additionally, the market is witnessing significant advancements in research and development, with a focus on enhancing filtration efficiency, reducing energy consumption, and improving the overall sustainability of filtration systems. For instance, the use of genomic selection and metabolite profiling in plant breeding is leading to the development of crops with enhanced nutrient content, photosynthetic efficiency, and stress tolerance. According to recent industry reports, the market is projected to grow by approximately 15% in the next two years, driven by increasing demand from various end-user sectors and the ongoing development of advanced filtration technologies. Furthermore, the market is expected to reach a value of around USD 666 billion by 2029, reflecting the growing importance of filtration solutions in ensuring optimal environmental conditions and maintaining product integrity across diverse industries.

Filters Market Size

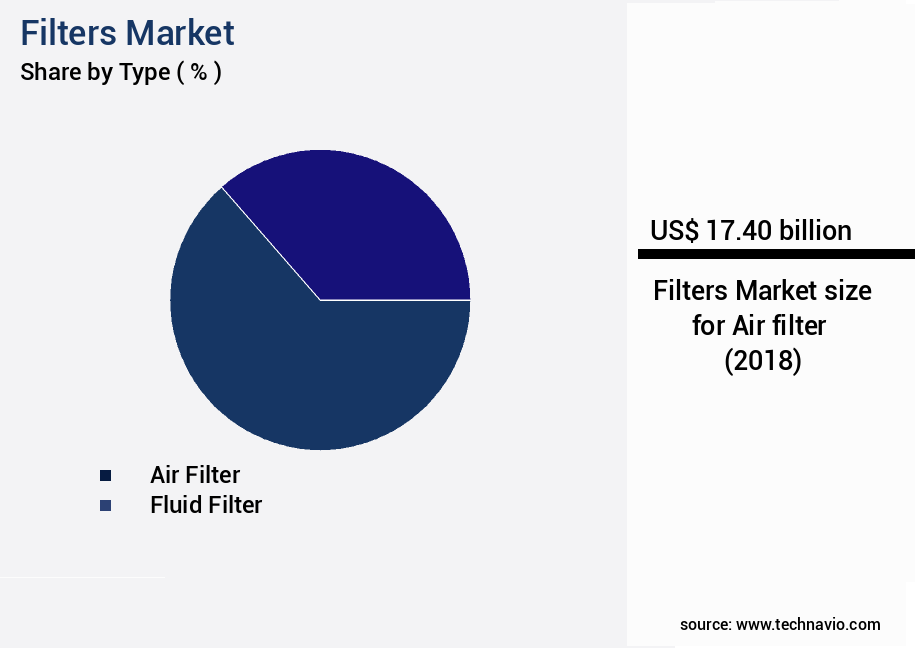
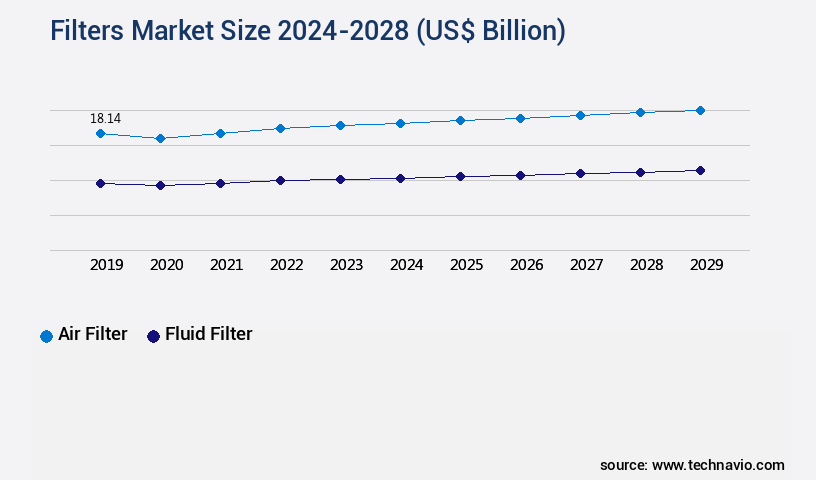
The Air filter segment was valued at USD 17.40 billion in 2018 and showed a gradual increase during the forecast period.

Filters Market Size

Request Free Sample

Regional Analysis

APAC is estimated to contribute 62% to the growth of the global market during the forecast period.Technavio's analysts have elaborately explained the regional trends and drivers that shape the market during the forecast period.

Filters Market Share by Geography

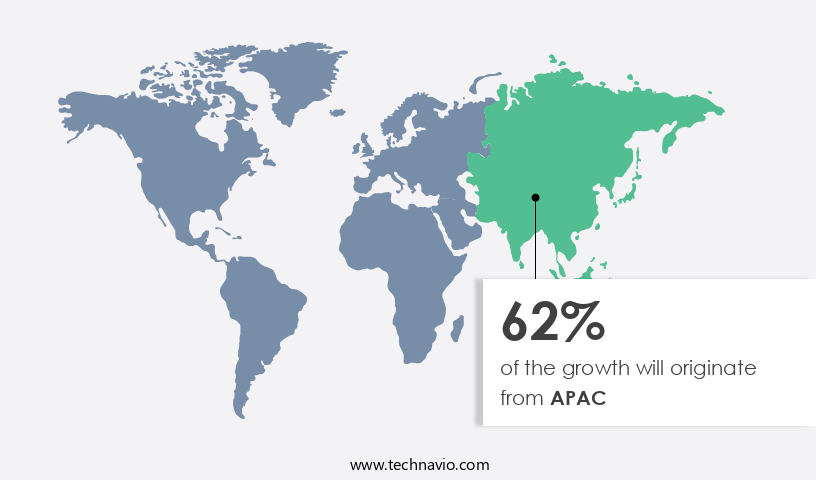
See How Filters Market Demand is Rising in APAC Request Free Sample

The market in the Asia Pacific (APAC) region is experiencing significant growth, fueled by industrialization, urbanization, and increasing environmental concerns. The manufacturing sector is driving this expansion, as the demand for filtration solutions becomes crucial for maintaining air quality, water purity, and efficient machinery operation. China and India are leading this growth, with China holding a substantial market share due to its vast automotive industry and the resulting demand for motor vehicle filters. The ongoing urbanization and industrial growth in these countries further amplify the need for advanced filtration systems. According to recent industry reports, The market is projected to grow by 12% in the next three years.

Simultaneously, the APAC region's the market is expected to increase by 15% during the same period. These figures highlight the significant growth potential in the APAC the market compared to the global market. The increasing adoption of advanced filtration technologies, such as nanofiltration and reverse osmosis, is a key trend driving market growth. These technologies offer improved filtration efficiency and are increasingly being used in various industries, including water treatment, pharmaceuticals, and food and beverage processing. Moreover, the growing awareness of environmental issues and the need for sustainable filtration solutions are further boosting market growth. Companies are investing in research and development to create eco-friendly filtration systems, which are expected to gain significant traction in the coming years.

In conclusion, the market in the APAC region is witnessing robust growth, driven by industrialization, urbanization, and increasing environmental concerns. The manufacturing sector's demand for filtration solutions is a significant factor contributing to this expansion. The market is projected to grow by 15% in the next three years, with China and India leading the charge. Advanced filtration technologies and the growing emphasis on sustainable solutions are key trends shaping the market's future trajectory.

Market Dynamics

Our researchers analyzed the data with 2023 as the base year, along with the key drivers, trends, and challenges. A holistic analysis of drivers will help companies refine their marketing strategies to gain a competitive advantage.

The market for sustainable agriculture is shaped by scientific innovation that directly impacts productivity, resource efficiency, and long-term ecological balance. Research on the impact of microbial communities on nutrient uptake and the investigation of plant-microbe interactions in the rhizosphere  continues to drive insights into soil fertility management. At the same time, the role of plant growth regulators in stress tolerance and the development of climate-resilient crops  are becoming essential to mitigate environmental variability and ensure reliable production outcomes. Biostimulant adoption is also gaining traction, with studies assessing the efficacy of humic acid fertilizers on crop yields, the effect of biostimulants on plant hormone levels, and the testing of new biostimulant products for performance improvement.

Practical applications remain central to adoption, as seen in the measurement of nitrogen use efficiency in field crops, the assessment of water use efficiency in different crops, and the determination of nutrient bioavailability in soil, which establish benchmarks for best practices. Similarly, the evaluation of drought tolerance mechanisms in plants, the assessment of salinity stress response in crops, and the analysis of root growth and development highlight resilience-based approaches to crop management.

Market comparisons indicate that precision-driven optimization of fertilizer application methods can increase nitrogen use efficiency by 22%, while integrated biostimulant applications contribute to a 15% improvement in crop yields. In parallel, practices such as the analysis of soil health indicators for sustainable agriculture, monitoring of soil health parameters, and the improvement of soil organic carbon content ensure environmental sustainability. Furthermore, the comparison of organic and conventional farming practices, alongside modeling of crop growth and yield, shows that organic-focused methods improve soil organic carbon by 18% compared with conventional approaches, underscoring the market's continuous evolution through the evaluation of sustainable agricultural practices.

Filters Market Size

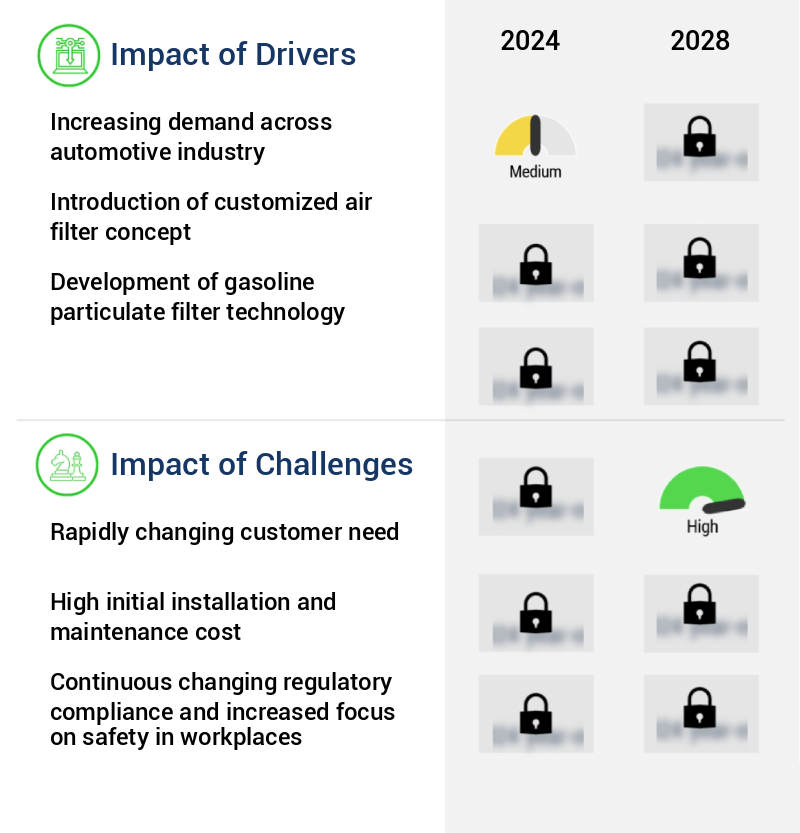
What are the key market drivers leading to the rise in the adoption of Filters Industry?

  • The automotive industry's growing demand serves as the primary market driver. 
  • The market has witnessed significant growth in recent years, driven by the increasing demand for clean air in various industries. In the automotive sector, the adoption of air filters has seen a notable rise due to their essential role in ensuring proper engine combustion and enhancing passenger safety. Advanced HEPA air filters are increasingly being used in cars to maintain a clean breathing atmosphere, addressing the growing concern for indoor air quality. Moreover, the ongoing global health crisis has further emphasized the importance of air filtration systems. For instance, in response to the COVID-19 pandemic, companies like Webasto in Italy have developed advanced HEPA systems to prevent contamination and mitigate the spread of the disease.
  • This underscores the evolving nature of the market and its applications across diverse sectors. The market encompasses a wide range of products, including air, water, and liquid filters, among others. Air filters are further segmented into HEPA, activated carbon, and electrostatic filters, among others. The market's continuous growth can be attributed to the increasing awareness of the importance of clean air and the development of advanced filtration technologies. In terms of numerical data, the market for automotive air filters is projected to reach significant growth rates, with increasing sales in the passenger vehicle segment.
  • This growth can be attributed to the rising demand for improved indoor air quality and the implementation of stringent emission norms. The market for water filters, on the other hand, is expected to witness steady growth due to the increasing demand for clean drinking water and the growing awareness of waterborne diseases. In conclusion, the market is a dynamic and evolving industry that plays a crucial role in ensuring clean air and water across various sectors. Its applications span from the automotive industry to healthcare and beyond, reflecting its importance in maintaining a clean and healthy environment.
  • The ongoing development of advanced filtration technologies and the growing awareness of the importance of clean air and water are expected to drive the market's continued growth.

What are the market trends shaping the Filters Industry?

  • The use of polyurethane-based adhesive filters is becoming increasingly popular in the market. This emerging trend in filtration technology emphasizes the development of such adhesives.
  • Filters, an essential component in various industries, have seen significant advancements in their manufacturing processes. Traditional methods, such as the use of vinyl plastisols as potting adhesives, have been surpassed by the adoption of polyurethane adhesives. These new adhesives offer several advantages, including shorter cycle times and the ability to mold and replace traditional metal end-caps. The transition to polyurethane adhesives reduces the need for separate metal and structural plastic pieces, leading to cost savings in the production of various filters. For instance, in the automotive sector, companies like Bayer MaterialScience LLC provide high-performance polyurethane-based automotive filters air and fluid filter systems.
  • These systems come in filled and unfilled foam and non-foam grades, catering to both fluid and air filters. Compared to vinyl plastisols, polyurethane adhesives provide several benefits. While plastisols have high densities and long cycle times, polyurethane adhesives offer faster production processes. Moreover, plastisols may leach ortho-phthalate plasticizers and chlorine-containing substances, which can be detrimental to the environment and end-users. In contrast, polyurethane adhesives do not pose such risks, making them a more sustainable and eco-friendly option. The ongoing evolution in filter manufacturing demonstrates the dynamic nature of this market, as companies continue to innovate and improve their offerings to meet the evolving needs of various industries.
  • This shift towards advanced adhesive technologies not only enhances the performance and efficiency of filters but also contributes to cost savings and environmental sustainability.

What challenges does the Filters Industry face during its growth?

  • The rapid evolution of customer needs poses a significant challenge to industry growth, requiring businesses to remain agile and adapt to shifting market trends in order to thrive. 
  • The market experiences continuous evolution, driven by the increasing demand for customized filtration solutions across various sectors. Consumers' preference for tailored applications poses challenges to market participants, as they strive to adapt production lines swiftly to meet specific requirements. This need for agility is further amplified by the emergence of advanced technologies, such as smart filters with Internet of Things (IoT) capabilities. These innovations cater to consumers' growing awareness and expectation for sophisticated filtration systems. Moreover, the regulatory landscape poses significant hurdles, as stricter standards for air and water quality necessitate higher performance levels and increased operational costs.
  • Market fragmentation intensifies competition, as niche players emerge with specialized solutions. This fragmentation may lead to price wars, potentially eroding profit margins for established market participants. Despite these challenges, the market continues to expand, with the nonwovens segment holding a substantial market share. In comparison to the ceramics segment, nonwovens offer advantages such as lighter weight, flexibility, and improved filtration efficiency. However, the ceramics segment boasts a higher growth potential due to its application in critical filtration processes, such as gas turbine engines and industrial separations. The market's dynamics are shaped by factors such as increasing consumer awareness, regulatory requirements, and technological advancements.
  • As the market continues to evolve, companies must stay abreast of these trends to remain competitive and maintain their market position.

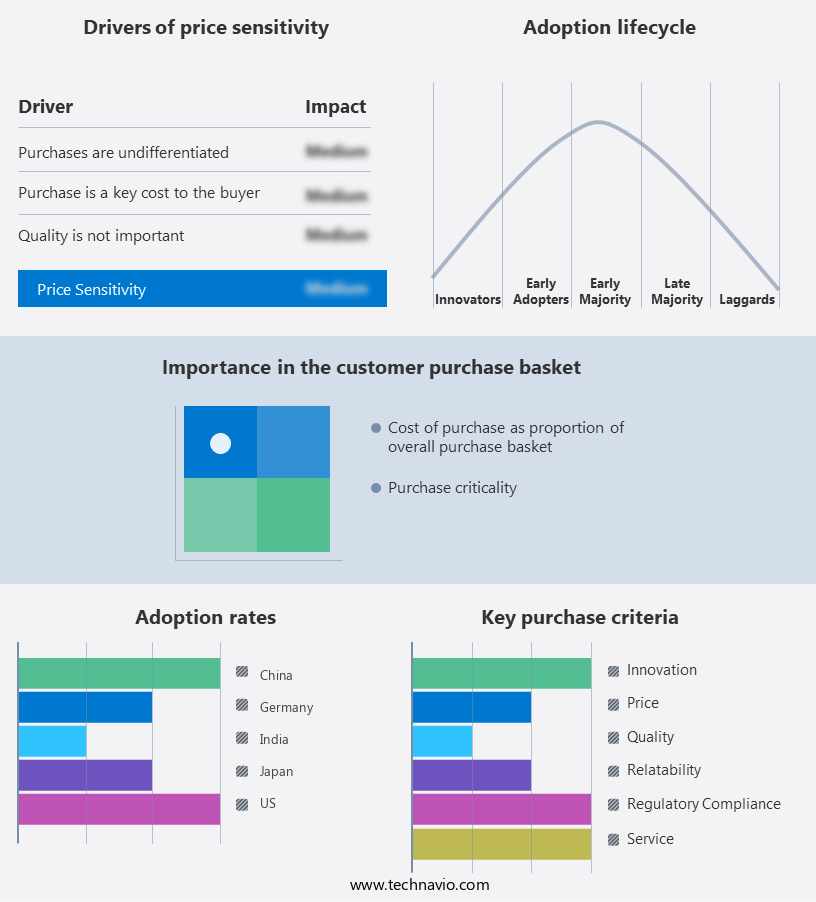
Exclusive Customer Landscape

The filters market forecasting report includes the adoption lifecycle of the market, covering from the innovator's stage to the laggard's stage. It focuses on adoption rates in different regions based on penetration. Furthermore, the filters market report also includes key purchase criteria and drivers of price sensitivity to help companies evaluate and develop their market growth analysis strategies.

Filters Market Share by Geography

 Customer Landscape of Filters Industry

Key Companies & Market Insights

Companies are implementing various strategies, such as strategic alliances, filters market forecast, partnerships, mergers and acquisitions, geographical expansion, and product/service launches, to enhance their presence in the industry.

3M Company - This company specializes in providing advanced filtration solutions, including the AP102T, AP430SS, and DWS2000T models. These filters cater to diverse industry applications, enhancing process efficiency and product quality through effective contaminant removal. The company's commitment to innovation and technological advancements sets it apart in the filtration market.

The industry research and growth report includes detailed analyses of the competitive landscape of the market and information about key companies, including:

  • 3M Company
  • Ahlstrom-Munksjö
  • American Air Filter Company, Inc. (AAF International)
  • Camfil AB
  • Cummins Inc.
  • Daikin Industries, Ltd.
  • Donaldson Company, Inc.
  • Eaton Corporation
  • Filtration Group Corporation
  • Freudenberg Filtration Technologies SE & Co. KG
  • Honeywell International Inc.
  • Lydall, Inc.
  • MAHLE GmbH
  • MANN+HUMMEL Group
  • Nordic Air Filtration
  • Pall Corporation (Danaher Corporation)
  • Parker Hannifin Corporation
  • Robert Bosch GmbH
  • Sefar AG
  • SPX FLOW, Inc.
  • UFI Filters
  • Valmet Corporation

Qualitative and quantitative analysis of companies has been conducted to help clients understand the wider business environment as well as the strengths and weaknesses of key industry players. Data is qualitatively analyzed to categorize companies as pure play, category-focused, industry-focused, and diversified; it is quantitatively analyzed to categorize companies as dominant, leading, strong, tentative, and weak.

Recent Development and News in Filters Market

  • In January 2024, 3M, a leading industrial company, announced the launch of a new line of advanced air filtration products, the Filtrete Smart 1200 series, designed to capture particles as small as 0.3 microns (Reuters). This new product line expansion underscores 3M's commitment to innovation in the filtration market.
  • In March 2024, Merck KGaA and Pall Corporation, two major players in the filtration industry, entered into a strategic partnership to develop and commercialize next-generation membrane filtration technologies (Merck KGaA press release). This collaboration combines Merck KGaA's expertise in life science research and Pall Corporation's filtration technology, aiming to create advanced solutions for the biopharmaceutical sector.
  • In June 2024, Danaher Corporation, a Fortune 500 company, completed the acquisition of GE Healthcare's Life Sciences business for approximately USD21.4 billion (Danaher press release). This acquisition significantly expanded Danaher's presence in the filtration market, giving them access to GE Healthcare's extensive portfolio of filtration technologies and a broader customer base.
  • In May 2025, the European Union's REACH regulation, which sets strict guidelines for the production, use, and disposal of chemicals, approved a new class of biodegradable filters for industrial applications (European Chemicals Agency press release). This approval marks a significant shift towards more sustainable filtration solutions, aligning with growing global concerns for environmental sustainability.

Research Analyst Overview

  • The market for agricultural innovations continues to evolve, with a growing focus on enhancing nitrogen use efficiency, chlorophyll content, and crop stress tolerance. Nitrogen use efficiency is a critical concern, as nitrogen is a fundamental nutrient for plant growth, yet its application often results in significant environmental impact. To address this challenge, researchers are exploring various strategies, including enzyme activity assays to optimize nitrogen availability and utilization. Chlorophyll content, an essential indicator of plant health and photosynthetic efficiency, is another key area of interest. Osmotic adjustment, a crucial mechanism for plants to cope with water stress, is also under investigation, as is antioxidant enzyme activity, which plays a vital role in protecting plants against oxidative damage.
  • Nutrient content analysis, soil organic carbon, and humic acid fertilizers are also gaining traction in the market. Humic acids, for instance, have been shown to improve soil health indicators, enhance nutrient absorption, and promote plant biomass production. Additionally, humic acid fertilizers can contribute to sustainable farming practices by increasing soil organic matter content and soil nutrient cycling. The market for agricultural innovations is expected to grow at a steady pace, with industry analysts projecting a 5% annual increase in sales over the next five years. This growth is driven by the ongoing demand for crop productivity gains, water use efficiency, and fruit quality improvement.
  • Other trends include the application of growth regulators, microbial inoculants, genomic selection, and precision agriculture. Moreover, researchers are exploring the potential of microbial community analysis, stress protein expression, and metabolite profiling to better understand plant responses to various stressors, including abiotic stress mitigation and disease resistance. These advancements are expected to lead to enhanced vegetative growth promotion, yield improvement metrics, and flowering and fruiting. Phosphorus uptake enhancement and photosynthetic efficiency are also areas of active research, with potential applications in various sectors, from row crops to horticulture. Overall, the market for agricultural innovations continues to unfold, driven by the need for sustainable farming practices and the pursuit of improved crop productivity and quality.

Dive into Technavio's robust research methodology, blending expert interviews, extensive data synthesis, and validated models for unparalleled Filters Market insights. See full methodology.

Market Scope

Report Coverage

Details

Page number

135

Base year

2023

Historic period

2018-2022

Forecast period

2024-2028

Growth momentum & CAGR

Accelerate at a CAGR of 4.5%

Market growth 2024-2028

USD 7.58 billion

Market structure

Fragmented

YoY growth 2023-2024(%)

4.2

Key countries

US, Canada, Germany, UK, Italy, France, China, India, Japan, Brazil, Egypt, UAE, Oman, Argentina, KSA, UAE, Brazil, and Rest of World (ROW)

Competitive landscape

Leading Companies, Market Positioning of Companies, Competitive Strategies, and Industry Risks

Request Free Sample

What are the Key Data Covered in this Filters Market Research and Growth Report?

  • CAGR of the Filters industry during the forecast period
  • Detailed information on factors that will drive the growth and forecasting between 2024 and 2028
  • Precise estimation of the size of the market and its contribution of the industry in focus to the parent market
  • Accurate predictions about upcoming growth and trends and changes in consumer behaviour
  • Growth of the market across APAC, North America, Europe, Middle East and Africa, and South America
  • Thorough analysis of the market's competitive landscape and detailed information about companies
  • Comprehensive analysis of factors that will challenge the filters market growth of industry companies

We can help! Our analysts can customize this filters market research report to meet your requirements.

Get in touch

1 Executive Summary

  • 1.1 Market overview
    • Executive Summary - Chart on Market Overview
    • Executive Summary - Data Table on Market Overview
    • Executive Summary - Chart on Global Market Characteristics
    • Executive Summary - Chart on Market by Geography
    • Executive Summary - Chart on Market Segmentation by Type
    • Executive Summary - Chart on Incremental Growth
    • Executive Summary - Data Table on Incremental Growth
    • Executive Summary - Chart on Company Market Positioning

2 Market Landscape

  • 2.1 Market ecosystem
    • Parent Market
    • Data Table on - Parent Market
  • 2.2 Market characteristics
    • Market characteristics analysis
  • 2.3 Value chain analysis
    • Value Chain Analysis

3 Market Sizing

  • 3.1 Market definition
    • Offerings of companies included in the market definition
  • 3.2 Market segment analysis
    • Market segments
  • 3.3 Market size 2023
    • 3.4 Market outlook: Forecast for 2023-2028
      • Chart on Global - Market size and forecast 2023-2028 ($ million)
      • Data Table on Global - Market size and forecast 2023-2028 ($ million)
      • Chart on Global Market: Year-over-year growth 2023-2028 (%)
      • Data Table on Global Market: Year-over-year growth 2023-2028 (%)

    4 Historic Market Size

    • 4.1 Global Filters Market 2018 - 2022
      • Historic Market Size - Data Table on Global Filters Market 2018 - 2022 ($ million)
    • 4.2 Type segment analysis 2018 - 2022
      • Historic Market Size - Type Segment 2018 - 2022 ($ million)
    • 4.3 Geography segment analysis 2018 - 2022
      • Historic Market Size - Geography Segment 2018 - 2022 ($ million)
    • 4.4 Country segment analysis 2018 - 2022
      • Historic Market Size - Country Segment 2018 - 2022 ($ million)

    5 Five Forces Analysis

    • 5.1 Five forces summary
      • Five forces analysis - Comparison between 2023 and 2028
    • 5.2 Bargaining power of buyers
      • Bargaining power of buyers - Impact of key factors 2023 and 2028
    • 5.3 Bargaining power of suppliers
      • Bargaining power of suppliers - Impact of key factors in 2023 and 2028
    • 5.4 Threat of new entrants
      • Threat of new entrants - Impact of key factors in 2023 and 2028
    • 5.5 Threat of substitutes
      • Threat of substitutes - Impact of key factors in 2023 and 2028
    • 5.6 Threat of rivalry
      • Threat of rivalry - Impact of key factors in 2023 and 2028
    • 5.7 Market condition
      • Chart on Market condition - Five forces 2023 and 2028

    6 Market Segmentation by Type

    • 6.1 Market segments
      • Chart on Type - Market share (2023-2028) (%)
      • Data Table on Type - Market share (2023-2028) (%)
    • 6.2 Comparison by Type
      • Chart on Comparison by Type
      • Data Table on Comparison by Type
    • 6.3 Air filter - Market size and forecast (2023-2028)
      • Chart on Air filter - Market size and forecast (2023-2028) ($ million)
      • Data Table on Air filter - Market size and forecast (2023-2028) ($ million)
      • Chart on Air filter - Year-over-year growth (2023-2028) (%)
      • Data Table on Air filter - Year-over-year growth (2023-2028) (%)
    • 6.4 Fluid filter - Market size and forecast (2023-2028)
      • Chart on Fluid filter - Market size and forecast (2023-2028) ($ million)
      • Data Table on Fluid filter - Market size and forecast (2023-2028) ($ million)
      • Chart on Fluid filter - Year-over-year growth (2023-2028) (%)
      • Data Table on Fluid filter - Year-over-year growth (2023-2028) (%)
    • 6.5 Market opportunity by Type
      • Market opportunity by Type ($ million)
      • Data Table on Market opportunity by Type ($ million)

    7 Market Segmentation by Application

    • 7.1 Market segments
      • Chart on Application - Market share (2023-2028) (%)
      • Data Table on Application - Market share (2023-2028) (%)
    • 7.2 Comparison by Application
      • Chart on Comparison by Application
      • Data Table on Comparison by Application
    • 7.3 Air Filtration - Market size and forecast (2023-2028)
      • Chart on Air Filtration - Market size and forecast (2023-2028) ($ million)
      • Data Table on Air Filtration - Market size and forecast (2023-2028) ($ million)
      • Chart on Air Filtration - Year-over-year growth (2023-2028) (%)
      • Data Table on Air Filtration - Year-over-year growth (2023-2028) (%)
    • 7.4 Liquid Filtration - Market size and forecast (2023-2028)
      • Chart on Liquid Filtration - Market size and forecast (2023-2028) ($ million)
      • Data Table on Liquid Filtration - Market size and forecast (2023-2028) ($ million)
      • Chart on Liquid Filtration - Year-over-year growth (2023-2028) (%)
      • Data Table on Liquid Filtration - Year-over-year growth (2023-2028) (%)
    • 7.5 Gas Filtration - Market size and forecast (2023-2028)
      • Chart on Gas Filtration - Market size and forecast (2023-2028) ($ million)
      • Data Table on Gas Filtration - Market size and forecast (2023-2028) ($ million)
      • Chart on Gas Filtration - Year-over-year growth (2023-2028) (%)
      • Data Table on Gas Filtration - Year-over-year growth (2023-2028) (%)
    • 7.6 Market opportunity by Application
      • Market opportunity by Application ($ million)
      • Data Table on Market opportunity by Application ($ million)

    8 Market Segmentation by End-use Industry

    • 8.1 Market segments
      • Chart on End-use Industry - Market share (2023-2028) (%)
      • Data Table on End-use Industry - Market share (2023-2028) (%)
      • Chart on Metals & Mining - Market size and forecast (2023-2028) ($ million)
      • Data Table on Metals & Mining - Market size and forecast (2023-2028) ($ million)
      • Chart on Metals & Mining - Year-over-year growth (2023-2028) (%)
      • Data Table on Metals & Mining - Year-over-year growth (2023-2028) (%)
    • 8.2 Comparison by End-use Industry
      • Chart on Comparison by End-use Industry
      • Data Table on Comparison by End-use Industry
      • Chart on Semiconductors & Electronics - Market size and forecast (2023-2028) ($ million)
      • Data Table on Semiconductors & Electronics - Market size and forecast (2023-2028) ($ million)
      • Chart on Semiconductors & Electronics - Year-over-year growth (2023-2028) (%)
      • Data Table on Semiconductors & Electronics - Year-over-year growth (2023-2028) (%)
    • 8.3 Automotive - Market size and forecast (2023-2028)
      • Chart on Automotive - Market size and forecast (2023-2028) ($ million)
      • Data Table on Automotive - Market size and forecast (2023-2028) ($ million)
      • Chart on Automotive - Year-over-year growth (2023-2028) (%)
      • Data Table on Automotive - Year-over-year growth (2023-2028) (%)
      • Chart on Industrial & Manufacturing (HVAC Systems) - Market size and forecast (2023-2028) ($ million)
      • Data Table on Industrial & Manufacturing (HVAC Systems) - Market size and forecast (2023-2028) ($ million)
      • Chart on Industrial & Manufacturing (HVAC Systems) - Year-over-year growth (2023-2028) (%)
      • Data Table on Industrial & Manufacturing (HVAC Systems) - Year-over-year growth (2023-2028) (%)
    • 8.4 Water & Wastewater Treatment - Market size and forecast (2023-2028)
      • Chart on Water & Wastewater Treatment - Market size and forecast (2023-2028) ($ million)
      • Data Table on Water & Wastewater Treatment - Market size and forecast (2023-2028) ($ million)
      • Chart on Water & Wastewater Treatment - Year-over-year growth (2023-2028) (%)
      • Data Table on Water & Wastewater Treatment - Year-over-year growth (2023-2028) (%)
      • Chart on Consumer Applications - Market size and forecast (2023-2028) ($ million)
      • Data Table on Consumer Applications - Market size and forecast (2023-2028) ($ million)
      • Chart on Consumer Applications - Year-over-year growth (2023-2028) (%)
      • Data Table on Consumer Applications - Year-over-year growth (2023-2028) (%)
    • 8.5 Food & Beverage - Market size and forecast (2023-2028)
      • Chart on Food & Beverage - Market size and forecast (2023-2028) ($ million)
      • Data Table on Food & Beverage - Market size and forecast (2023-2028) ($ million)
      • Chart on Food & Beverage - Year-over-year growth (2023-2028) (%)
      • Data Table on Food & Beverage - Year-over-year growth (2023-2028) (%)
      • Chart on Aerospace & Defense - Market size and forecast (2023-2028) ($ million)
      • Data Table on Aerospace & Defense - Market size and forecast (2023-2028) ($ million)
      • Chart on Aerospace & Defense - Year-over-year growth (2023-2028) (%)
      • Data Table on Aerospace & Defense - Year-over-year growth (2023-2028) (%)
    • 8.6 Chemical & Petrochemicals - Market size and forecast (2023-2028)
      • Chart on Chemical & Petrochemicals - Market size and forecast (2023-2028) ($ million)
      • Data Table on Chemical & Petrochemicals - Market size and forecast (2023-2028) ($ million)
      • Chart on Chemical & Petrochemicals - Year-over-year growth (2023-2028) (%)
      • Data Table on Chemical & Petrochemicals - Year-over-year growth (2023-2028) (%)
      • Chart on Healthcare - Market size and forecast (2023-2028) ($ million)
      • Data Table on Healthcare - Market size and forecast (2023-2028) ($ million)
      • Chart on Healthcare - Year-over-year growth (2023-2028) (%)
      • Data Table on Healthcare - Year-over-year growth (2023-2028) (%)
    • 8.7 Oil & Gas - Market size and forecast (2023-2028)
      • Chart on Oil & Gas - Market size and forecast (2023-2028) ($ million)
      • Data Table on Oil & Gas - Market size and forecast (2023-2028) ($ million)
      • Chart on Oil & Gas - Year-over-year growth (2023-2028) (%)
      • Data Table on Oil & Gas - Year-over-year growth (2023-2028) (%)
      • Market opportunity by End-use Industry ($ million)
      • Data Table on Market opportunity by End-use Industry ($ million)
    • 8.8 Pharmaceuticals & Medical - Market size and forecast (2023-2028)
      • Chart on Pharmaceuticals & Medical - Market size and forecast (2023-2028) ($ million)
      • Data Table on Pharmaceuticals & Medical - Market size and forecast (2023-2028) ($ million)
      • Chart on Pharmaceuticals & Medical - Year-over-year growth (2023-2028) (%)
      • Data Table on Pharmaceuticals & Medical - Year-over-year growth (2023-2028) (%)
    • 8.9 Power Generation - Market size and forecast (2023-2028)
      • Chart on Power Generation - Market size and forecast (2023-2028) ($ million)
      • Data Table on Power Generation - Market size and forecast (2023-2028) ($ million)
      • Chart on Power Generation - Year-over-year growth (2023-2028) (%)
      • Data Table on Power Generation - Year-over-year growth (2023-2028) (%)

    9 Customer Landscape

    • 9.1 Customer landscape overview
      • Analysis of price sensitivity, lifecycle, customer purchase basket, adoption rates, and purchase criteria

    10 Geographic Landscape

    • 10.1 Geographic segmentation
      • Chart on Market share by geography 2023-2028 (%)
      • Data Table on Market share by geography 2023-2028 (%)
    • 10.2 Geographic comparison
      • Chart on Geographic comparison
      • Data Table on Geographic comparison
    • 10.3 APAC - Market size and forecast 2023-2028
      • Chart on APAC - Market size and forecast 2023-2028 ($ million)
      • Data Table on APAC - Market size and forecast 2023-2028 ($ million)
      • Chart on APAC - Year-over-year growth 2023-2028 (%)
      • Data Table on APAC - Year-over-year growth 2023-2028 (%)
    • 10.4 North America - Market size and forecast 2023-2028
      • Chart on North America - Market size and forecast 2023-2028 ($ million)
      • Data Table on North America - Market size and forecast 2023-2028 ($ million)
      • Chart on North America - Year-over-year growth 2023-2028 (%)
      • Data Table on North America - Year-over-year growth 2023-2028 (%)
    • 10.5 Europe - Market size and forecast 2023-2028
      • Chart on Europe - Market size and forecast 2023-2028 ($ million)
      • Data Table on Europe - Market size and forecast 2023-2028 ($ million)
      • Chart on Europe - Year-over-year growth 2023-2028 (%)
      • Data Table on Europe - Year-over-year growth 2023-2028 (%)
    • 10.6 Middle East and Africa - Market size and forecast 2023-2028
      • Chart on Middle East and Africa - Market size and forecast 2023-2028 ($ million)
      • Data Table on Middle East and Africa - Market size and forecast 2023-2028 ($ million)
      • Chart on Middle East and Africa - Year-over-year growth 2023-2028 (%)
      • Data Table on Middle East and Africa - Year-over-year growth 2023-2028 (%)
    • 10.7 South America - Market size and forecast 2023-2028
      • Chart on South America - Market size and forecast 2023-2028 ($ million)
      • Data Table on South America - Market size and forecast 2023-2028 ($ million)
      • Chart on South America - Year-over-year growth 2023-2028 (%)
      • Data Table on South America - Year-over-year growth 2023-2028 (%)
    • 10.8 US - Market size and forecast 2023-2028
      • Chart on US - Market size and forecast 2023-2028 ($ million)
      • Data Table on US - Market size and forecast 2023-2028 ($ million)
      • Chart on US - Year-over-year growth 2023-2028 (%)
      • Data Table on US - Year-over-year growth 2023-2028 (%)
    • 10.9 China - Market size and forecast 2023-2028
      • Chart on China - Market size and forecast 2023-2028 ($ million)
      • Data Table on China - Market size and forecast 2023-2028 ($ million)
      • Chart on China - Year-over-year growth 2023-2028 (%)
      • Data Table on China - Year-over-year growth 2023-2028 (%)
    • 10.10 Japan - Market size and forecast 2023-2028
      • Chart on Japan - Market size and forecast 2023-2028 ($ million)
      • Data Table on Japan - Market size and forecast 2023-2028 ($ million)
      • Chart on Japan - Year-over-year growth 2023-2028 (%)
      • Data Table on Japan - Year-over-year growth 2023-2028 (%)
    • 10.11 Germany - Market size and forecast 2023-2028
      • Chart on Germany - Market size and forecast 2023-2028 ($ million)
      • Data Table on Germany - Market size and forecast 2023-2028 ($ million)
      • Chart on Germany - Year-over-year growth 2023-2028 (%)
      • Data Table on Germany - Year-over-year growth 2023-2028 (%)
    • 10.12 India - Market size and forecast 2023-2028
      • Chart on India - Market size and forecast 2023-2028 ($ million)
      • Data Table on India - Market size and forecast 2023-2028 ($ million)
      • Chart on India - Year-over-year growth 2023-2028 (%)
      • Data Table on India - Year-over-year growth 2023-2028 (%)
    • 10.13 Market opportunity by geography
      • Market opportunity by geography ($ million)
      • Data Tables on Market opportunity by geography ($ million)
    • 10.14 Canada - Market size and forecast (2023-2028)
      • Chart on Canada - Market size and forecast (2023-2028) ($ million)
      • Data Table on Canada - Market size and forecast (2023-2028) ($ million)
      • Chart on Canada - Year-over-year growth (2023-2028) (%)
      • Data Table on Canada - Year-over-year growth (2023-2028) (%)
    • 10.15 UK - Market size and forecast (2023-2028)
      • Chart on UK - Market size and forecast (2023-2028) ($ million)
      • Data Table on UK - Market size and forecast (2023-2028) ($ million)
      • Chart on UK - Year-over-year growth (2023-2028) (%)
      • Data Table on UK - Year-over-year growth (2023-2028) (%)
    • 10.16 Italy - Market size and forecast (2023-2028)
      • Chart on Italy - Market size and forecast (2023-2028) ($ million)
      • Data Table on Italy - Market size and forecast (2023-2028) ($ million)
      • Chart on Italy - Year-over-year growth (2023-2028) (%)
      • Data Table on Italy - Year-over-year growth (2023-2028) (%)
    • 10.17 France - Market size and forecast (2023-2028)
      • Chart on France - Market size and forecast (2023-2028) ($ million)
      • Data Table on France - Market size and forecast (2023-2028) ($ million)
      • Chart on France - Year-over-year growth (2023-2028) (%)
      • Data Table on France - Year-over-year growth (2023-2028) (%)
    • 10.18 Brazil - Market size and forecast (2023-2028)
      • Chart on Brazil - Market size and forecast (2023-2028) ($ million)
      • Data Table on Brazil - Market size and forecast (2023-2028) ($ million)
      • Chart on Brazil - Year-over-year growth (2023-2028) (%)
      • Data Table on Brazil - Year-over-year growth (2023-2028) (%)
    • 10.19 Egypt - Market size and forecast (2023-2028)
      • Chart on Egypt - Market size and forecast (2023-2028) ($ million)
      • Data Table on Egypt - Market size and forecast (2023-2028) ($ million)
      • Chart on Egypt - Year-over-year growth (2023-2028) (%)
      • Data Table on Egypt - Year-over-year growth (2023-2028) (%)
    • 10.20 UAE - Market size and forecast (2023-2028)
      • Chart on UAE - Market size and forecast (2023-2028) ($ million)
      • Data Table on UAE - Market size and forecast (2023-2028) ($ million)
      • Chart on UAE - Year-over-year growth (2023-2028) (%)
      • Data Table on UAE - Year-over-year growth (2023-2028) (%)
    • 10.21 Oman - Market size and forecast (2023-2028)
      • Chart on Oman - Market size and forecast (2023-2028) ($ million)
      • Data Table on Oman - Market size and forecast (2023-2028) ($ million)
      • Chart on Oman - Year-over-year growth (2023-2028) (%)
      • Data Table on Oman - Year-over-year growth (2023-2028) (%)
    • 10.22 Argentina - Market size and forecast (2023-2028)
      • Chart on Argentina - Market size and forecast (2023-2028) ($ million)
      • Data Table on Argentina - Market size and forecast (2023-2028) ($ million)
      • Chart on Argentina - Year-over-year growth (2023-2028) (%)
      • Data Table on Argentina - Year-over-year growth (2023-2028) (%)
    • 10.23 KSA - Market size and forecast (2023-2028)
      • Chart on KSA - Market size and forecast (2023-2028) ($ million)
      • Data Table on KSA - Market size and forecast (2023-2028) ($ million)
      • Chart on KSA - Year-over-year growth (2023-2028) (%)
      • Data Table on KSA - Year-over-year growth (2023-2028) (%)
    • 10.24 Rest of World (ROW) - Market size and forecast (2023-2028)
      • Chart on Rest of World (ROW) - Market size and forecast (2023-2028) ($ million)
      • Data Table on Rest of World (ROW) - Market size and forecast (2023-2028) ($ million)
      • Chart on Rest of World (ROW) - Year-over-year growth (2023-2028) (%)
      • Data Table on Rest of World (ROW) - Year-over-year growth (2023-2028) (%)

    11 Drivers, Challenges, and Opportunity/Restraints

    • 11.1 Market drivers
      • 11.2 Market challenges
        • 11.3 Impact of drivers and challenges
          • Impact of drivers and challenges in 2023 and 2028
        • 11.4 Market opportunities/restraints

          12 Competitive Landscape

          • 12.1 Overview
            • 12.2 Competitive Landscape
              • Overview on criticality of inputs and factors of differentiation
            • 12.3 Landscape disruption
              • Overview on factors of disruption
            • 12.4 Industry risks
              • Impact of key risks on business

            13 Competitive Analysis

            • 13.1 Companies profiled
              • Companies covered
            • 13.2 Market positioning of companies
              • Matrix on companies position and classification
            • 3M Company
              • 3M Company - Overview
              • 3M Company - Product / Service
              • 3M Company - Key offerings
            • 13.4 Ahlstrom-Munksjö
              • Ahlstrom-Munksjö - Overview
              • Ahlstrom-Munksjö - Product / Service
              • Ahlstrom-Munksjö - Key offerings
            • 13.5 American Air Filter Company, Inc. (AAF International)
              • American Air Filter Company, Inc. (AAF International) - Overview
              • American Air Filter Company, Inc. (AAF International) - Product / Service
              • American Air Filter Company, Inc. (AAF International) - Key offerings
            • 13.6 Camfil AB
              • Camfil AB - Overview
              • Camfil AB - Product / Service
              • Camfil AB - Key offerings
            • 13.7 Cummins Inc.
              • Cummins Inc. - Overview
              • Cummins Inc. - Product / Service
              • Cummins Inc. - Key offerings
            • 13.8 Daikin Industries, Ltd.
              • Daikin Industries, Ltd. - Overview
              • Daikin Industries, Ltd. - Product / Service
              • Daikin Industries, Ltd. - Key offerings
            • 13.9 Donaldson Company, Inc.
              • Donaldson Company, Inc. - Overview
              • Donaldson Company, Inc. - Product / Service
              • Donaldson Company, Inc. - Key offerings
            • 13.10 Eaton Corporation
              • Eaton Corporation - Overview
              • Eaton Corporation - Product / Service
              • Eaton Corporation - Key offerings
            • 13.11 Filtration Group Corporation
              • Filtration Group Corporation - Overview
              • Filtration Group Corporation - Product / Service
              • Filtration Group Corporation - Key offerings
            • 13.12 Freudenberg Filtration Technologies SE & Co. KG
              • Freudenberg Filtration Technologies SE & Co. KG - Overview
              • Freudenberg Filtration Technologies SE & Co. KG - Product / Service
              • Freudenberg Filtration Technologies SE & Co. KG - Key offerings
            • 13.13 Honeywell International Inc.
              • Honeywell International Inc. - Overview
              • Honeywell International Inc. - Product / Service
              • Honeywell International Inc. - Key offerings
            • 13.14 Lydall, Inc.
              • Lydall, Inc. - Overview
              • Lydall, Inc. - Product / Service
              • Lydall, Inc. - Key offerings
            • 13.15 MAHLE GmbH
              • MAHLE GmbH - Overview
              • MAHLE GmbH - Product / Service
              • MAHLE GmbH - Key offerings
            • 13.16 MANN+HUMMEL Group
              • MANN+HUMMEL Group - Overview
              • MANN+HUMMEL Group - Product / Service
              • MANN+HUMMEL Group - Key offerings
            • 13.17 Nordic Air Filtration
              • Nordic Air Filtration - Overview
              • Nordic Air Filtration - Product / Service
              • Nordic Air Filtration - Key offerings
            • 13.18 Pall Corporation (Danaher Corporation)
              • Pall Corporation (Danaher Corporation) - Overview
              • Pall Corporation (Danaher Corporation) - Product / Service
              • Pall Corporation (Danaher Corporation) - Key offerings
            • 13.19 Parker Hannifin Corporation
              • Parker Hannifin Corporation - Overview
              • Parker Hannifin Corporation - Product / Service
              • Parker Hannifin Corporation - Key offerings
            • 13.20 Robert Bosch GmbH
              • Robert Bosch GmbH - Overview
              • Robert Bosch GmbH - Product / Service
              • Robert Bosch GmbH - Key offerings
            • 13.21 Sefar AG
              • Sefar AG - Overview
              • Sefar AG - Product / Service
              • Sefar AG - Key offerings
            • 13.22 SPX FLOW, Inc.
              • SPX FLOW, Inc. - Overview
              • SPX FLOW, Inc. - Product / Service
              • SPX FLOW, Inc. - Key offerings
            • 13.23 UFI Filters
              • UFI Filters - Overview
              • UFI Filters - Product / Service
              • UFI Filters - Key offerings
            • 13.24 Valmet Corporation
              • Valmet Corporation - Overview
              • Valmet Corporation - Product / Service
              • Valmet Corporation - Key offerings
            • 3M Co.
              • 3M Co. - Overview
              • 3M Co. - Product / Service
              • 3M Co. - Key offerings
            • 13.26 Ahlstrom Munksjo Oyj
              • Ahlstrom Munksjo Oyj - Overview
              • Ahlstrom Munksjo Oyj - Product / Service
              • Ahlstrom Munksjo Oyj - Key offerings
            • 13.27 Airex Filter Corp.
              • Airex Filter Corp. - Overview
              • Airex Filter Corp. - Product / Service
              • Airex Filter Corp. - Key offerings
            • 13.28 Alfa Laval AB
              • Alfa Laval AB - Overview
              • Alfa Laval AB - Product / Service
              • Alfa Laval AB - Key offerings
            • 13.29 Babcock and Wilcox Enterprises Inc.
              • Babcock and Wilcox Enterprises Inc. - Overview
              • Babcock and Wilcox Enterprises Inc. - Product / Service
              • Babcock and Wilcox Enterprises Inc. - Key offerings
            • 13.30 Camfil AB
              • Camfil AB - Overview
              • Camfil AB - Product / Service
              • Camfil AB - Key offerings
            • 13.31 Clark Air Systems
              • Clark Air Systems - Overview
              • Clark Air Systems - Product / Service
              • Clark Air Systems - Key offerings
            • 13.32 Cummins Inc.
              • Cummins Inc. - Overview
              • Cummins Inc. - Product / Service
              • Cummins Inc. - Key offerings
            • 13.33 Danaher Corp.
              • Danaher Corp. - Overview
              • Danaher Corp. - Product / Service
              • Danaher Corp. - Key offerings
            • 13.34 DENSO Corp.
              • DENSO Corp. - Overview
              • DENSO Corp. - Product / Service
              • DENSO Corp. - Key offerings
            • 13.35 Donaldson Co. Inc.
              • Donaldson Co. Inc. - Overview
              • Donaldson Co. Inc. - Product / Service
              • Donaldson Co. Inc. - Key offerings
            • 13.36 Eaton Corp plc
              • Eaton Corp plc - Overview
              • Eaton Corp plc - Product / Service
              • Eaton Corp plc - Key offerings
            • 13.37 Filtration Group Corp.
              • Filtration Group Corp. - Overview
              • Filtration Group Corp. - Product / Service
              • Filtration Group Corp. - Key offerings
            • 13.38 Freudenberg Filtration Technologies GmbH and Co. KG
              • Freudenberg Filtration Technologies GmbH and Co. KG - Overview
              • Freudenberg Filtration Technologies GmbH and Co. KG - Product / Service
              • Freudenberg Filtration Technologies GmbH and Co. KG - Key offerings
            • 13.39 Koch Filter
              • Koch Filter - Overview
              • Koch Filter - Product / Service
              • Koch Filter - Key offerings
            • 13.40 MANN HUMMEL International GmbH and Co. KG
              • MANN HUMMEL International GmbH and Co. KG - Overview
              • MANN HUMMEL International GmbH and Co. KG - Product / Service
              • MANN HUMMEL International GmbH and Co. KG - Key offerings
            • 13.41 Parker Hannifin Corp.
              • Parker Hannifin Corp. - Overview
              • Parker Hannifin Corp. - Product / Service
              • Parker Hannifin Corp. - Key offerings
            • 13.42 Spectrum Filtration Pvt. Ltd.
              • Spectrum Filtration Pvt. Ltd. - Overview
              • Spectrum Filtration Pvt. Ltd. - Product / Service
              • Spectrum Filtration Pvt. Ltd. - Key offerings
            • 13.43 SUEZ WTS USA Inc.
              • SUEZ WTS USA Inc. - Overview
              • SUEZ WTS USA Inc. - Product / Service
              • SUEZ WTS USA Inc. - Key offerings
            • 13.44 W. L. Gore and Associates Inc.
              • W. L. Gore and Associates Inc. - Overview
              • W. L. Gore and Associates Inc. - Product / Service
              • W. L. Gore and Associates Inc. - Key offerings

            14 Appendix

            • 14.1 Scope of the report
              • 14.2 Inclusions and exclusions checklist
                • Inclusions checklist
                • Exclusions checklist
              • 14.3 Currency conversion rates for US$
                • Currency conversion rates for US$
              • 14.4 Research methodology
                • Research methodology
              • 14.5 Data procurement
                • Information sources
              • 14.6 Data validation
                • Data validation
              • 14.7 Validation techniques employed for market sizing
                • Validation techniques employed for market sizing
              • 14.8 Data synthesis
                • Data synthesis
              • 14.9 360 degree market analysis
                • 360 degree market analysis
              • 14.10 List of abbreviations
                • List of abbreviations

              Research Methodology

              Technavio presents a detailed picture of the market by way of study, synthesis, and summation of data from multiple sources. The analysts have presented the various facets of the market with a particular focus on identifying the key industry influencers. The data thus presented is comprehensive, reliable, and the result of extensive research, both primary and secondary.

              INFORMATION SOURCES

              Primary sources

              • Manufacturers and suppliers
              • Channel partners
              • Industry experts
              • Strategic decision makers

              Secondary sources

              • Industry journals and periodicals
              • Government data
              • Financial reports of key industry players
              • Historical data
              • Press releases

              DATA ANALYSIS

              Data Synthesis

              • Collation of data
              • Estimation of key figures
              • Analysis of derived insights

              Data Validation

              • Triangulation with data models
              • Reference against proprietary databases
              • Corroboration with industry experts

              REPORT WRITING

              Qualitative

              • Market drivers
              • Market challenges
              • Market trends
              • Five forces analysis

              Quantitative

              • Market size and forecast
              • Market segmentation
              • Geographical insights
              • Competitive landscape

              Interested in this report?

              Get your sample now to see our research methodology and insights!

              Download Now

              Frequently Asked Questions

              Filters market growth will increase by $ 7.58 bn during 2024-2028 .

              The Filters market is expected to grow at a CAGR of 4.5% during 2024-2028 .

              Filters market is segmented by Type( Air filter, Fluid filter) Application( Air Filtration, Liquid Filtration, Gas Filtration)

              3M Company, Ahlstrom-Munksjö, American Air Filter Company, Inc. (AAF International), Camfil AB, Cummins Inc., Daikin Industries, Ltd., Donaldson Company, Inc., Eaton Corporation, Filtration Group Corporation, Freudenberg Filtration Technologies SE & Co. KG, Honeywell International Inc., Lydall, Inc., MAHLE GmbH, MANN+HUMMEL Group, Nordic Air Filtration, Pall Corporation (Danaher Corporation), Parker Hannifin Corporation, Robert Bosch GmbH, Sefar AG, SPX FLOW, Inc., UFI Filters, Valmet Corporation are a few of the key vendors in the Filters market.

              APAC will register the highest growth rate of 62% among the other regions. Therefore, the Filters market in APAC is expected to garner significant business opportunities for the vendors during the forecast period.

              US, Canada, Germany, UK, Italy, France, China, India, Japan, Brazil, Egypt, UAE, Oman, Argentina, KSA, UAE, Brazil, Rest of World (ROW)

              • Increasing demand across automotive industryWith the growth of the automotive industry is the driving factor this market.
              • the demand for air filters is also increasing due to the rising installation of air filters in passenger vehicles is the driving factor this market.
              • especially cars. Air filters were used in cars to provide clean air for proper combustion of the engine. Furthermore is the driving factor this market.
              • the automotive industry uses advanced HEPA air filters to ensure a clean breathing atmosphere inside vehicles to ensure passenger and driver safety. In addition is the driving factor this market.
              • vendors have developed this technology as an important measure to tackle the spread of COVID-19. For instance is the driving factor this market.
              • in March 2020 is the driving factor this market.
              • Webasto in Italy used techniques and developed advanced HEPA systems for preventing contamination and tackling COVID-19 infections by preventing the spread of the disease. The filters are reusable and offer great aftermarket value for the automotive industry. Therefore is the driving factor this market.
              • the rising adoption of air filtration systems in the automotive industry is expected to drive the growth of the global air filters market during the forecast period. is the driving factor this market.

              The Filters market vendors should focus on grabbing business opportunities from the Air filter segment as it accounted for the largest market share in the base year.