
Personal Care Market Size 2024-2028
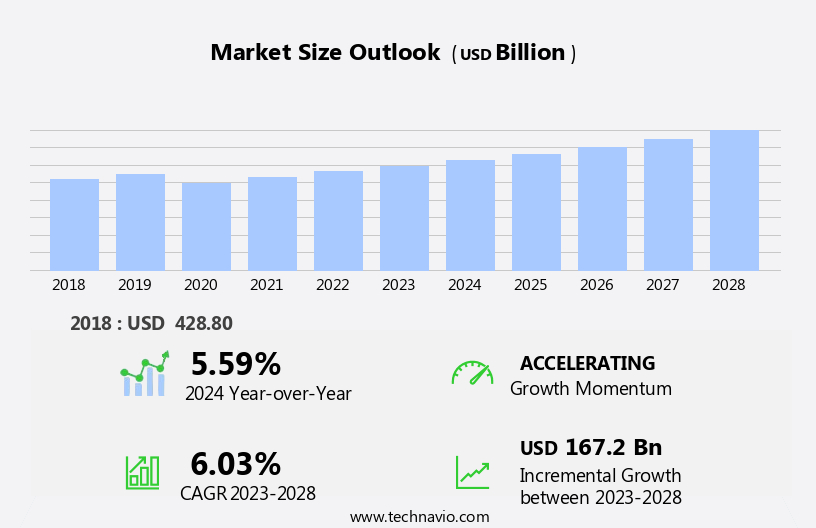
The personal care market size is forecast to increase by USD 167.2 billion, at a CAGR of 6.03% between 2023 and 2028.
- The market is experiencing significant growth due to the increasing number of consumers, both male and female, prioritizing self-care and opting for an expansive range of personal care products. This trend is further fueled by the influence of social media and blogging, which has created a culture of sharing beauty tips and product recommendations. However, this market faces challenges, primarily the high cost of natural and organic personal care products. Manufacturers must navigate this obstacle by offering affordable alternatives or partnering with suppliers to source cost-effective, eco-friendly ingredients. Notably, the skincare segment continues to dominate the market, driven by the rising awareness of the importance of skin health and the availability of advanced technologies.
- In the realm of hair care, the demand for organic and natural shampoos and conditioners is on the rise, as consumers become more conscious of the potential health risks associated with synthetic ingredients. Lastly, the makeup industry remains a key player, with a growing emphasis on clean beauty and sustainable practices. Companies that can effectively address the challenges of affordability and sustainability while catering to evolving consumer preferences will be well-positioned for success in the market.
What will be the Size of the Personal Care Market during the forecast period?
Explore in-depth regional segment analysis with market size data - historical 2018-2022 and forecasts 2024-2028 - in the full report.
Request Free Sample
The market continues to evolve, shaped by dynamic consumer behavior and technological advancements. Cruelty-free products have gained significant traction, with an increasing number of consumers prioritizing ethical sourcing and production methods. In the realm of men's grooming, traditional shaving cream is being challenged by innovative alternatives, such as electric razors and shaving subscriptions. Virtual reality technology is revolutionizing hair styling, allowing customers to experiment with different looks before committing. Influencer marketing and social media platforms are transforming the way brands connect with consumers. Body care trends focus on natural and organic products, catering to various skin concerns and types.
Competitor analysis is crucial in this competitive landscape, with companies continually striving to differentiate through product efficacy, customer experience, and pricing strategies. Augmented reality is playing a role in enhancing the shopping experience, enabling consumers to virtually test products before purchase. Product safety and allergy testing are essential considerations, ensuring consumer trust and satisfaction. Oral care, sun care, and personalized skincare are other sectors experiencing growth, driven by consumer demand for comprehensive self-care solutions. Brand loyalty is fostered through content marketing and data analytics, allowing companies to tailor their offerings and engage with their audience effectively. Machine learning and AI are being integrated into various aspects of the industry, from product development to customer service.
The market is a vibrant and ever-changing landscape, with ongoing innovation and adaptation to consumer preferences and technological advancements. From body wash and bath & shower products to hair color and dental floss, the sector continues to evolve, offering a wealth of opportunities for businesses and consumers alike.
How is this Personal Care Industry segmented?
The personal care industry research report provides comprehensive data (region-wise segment analysis), with forecasts and estimates in "USD billion" for the period 2024-2028, as well as historical data from 2018-2022 for the following segments.
- Distribution Channel
- Offline
- Online
- Product
- Skincare products
- Haircare products
- Color cosmetics
- Oral care products
- Others
- Consumer Type
- Men's Grooming
- Women's Care
- Baby Care
- Senior Care
- Ingredient Focus
- Natural/Organic Products
- Vegan Products
- Sustainable Packaging
- Cruelty-Free Products
- Geography
- North America
- US
- Canada
- Europe
- France
- Germany
- Italy
- UK
- Middle East and Africa
- Egypt
- KSA
- Oman
- UAE
- APAC
- China
- India
- Japan
- South America
- Argentina
- Brazil
- Rest of World (ROW)
- North America
By Distribution Channel Insights
The offline segment is estimated to witness significant growth during the forecast period.
The market is characterized by various trends and dynamics, with consumer behavior playing a significant role in shaping market patterns. Predictive modeling helps businesses anticipate consumer preferences, enabling them to tailor their offerings accordingly. Clinical trials ensure product efficacy and safety, while natural and organic products cater to growing health consciousness. Customer experience is a key differentiator, with augmented reality and virtual reality enhancing the shopping experience. Oral care, hair styling, and hair color continue to dominate the market, with allergy testing and shelf life concerns influencing consumer choices. Artificial intelligence and machine learning facilitate personalized skincare solutions, catering to diverse skin types and concerns.
Product safety, vegan, and cruelty-free options are increasingly popular, reflecting societal values. Brand loyalty is fostered through content marketing, product reviews, and influencer collaborations. Pricing strategies, competitor analysis, and product innovation are crucial for market success. Bath & shower, body care, and men's grooming categories also show strong growth. Dental floss, sun care, and skin analysis tools are essential add-ons. Retail channels, including specialty stores, hypermarkets, and online platforms, offer diverse distribution options. Bathroom essentials, such as shaving cream, body wash, and dental floss, are staples in personal care. Subscription services provide convenience and cost savings, while product safety and shelf life remain critical considerations.
Market trends include the integration of technology, such as data analytics, to improve customer engagement and product development. Skin concerns, including aging, acne, and hyperpigmentation, continue to drive innovation. Brands that prioritize consumer needs and deliver high-quality, effective products will thrive in this dynamic market.
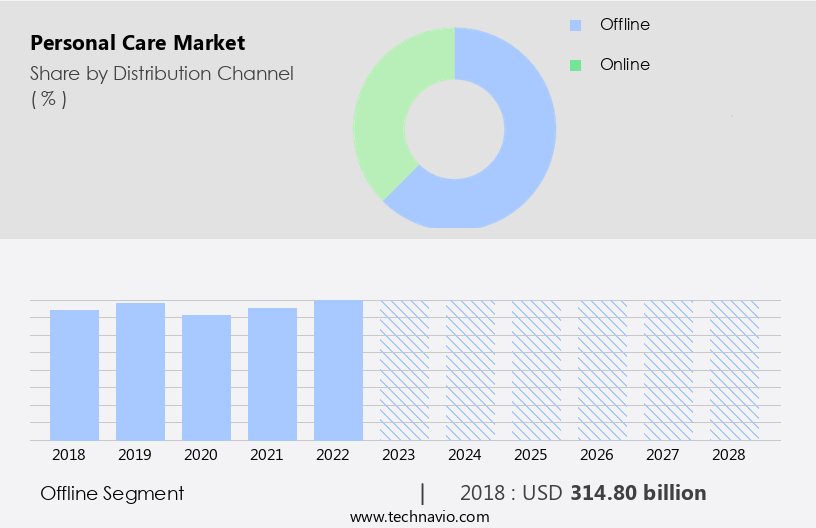
The Offline segment was valued at USD 314.80 billion in 2018 and showed a gradual increase during the forecast period.
Regional Analysis
APAC is estimated to contribute 42% to the growth of the global market during the forecast period. Technavio's analysts have elaborately explained the regional trends and drivers that shape the market during the forecast period.
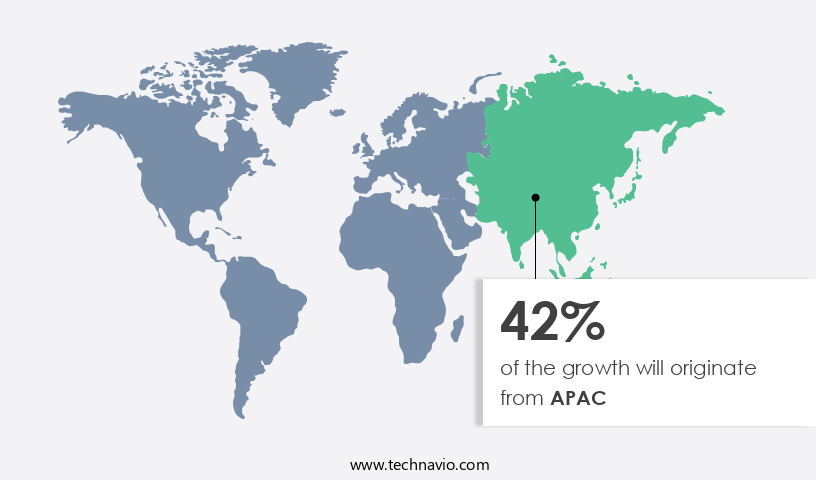
The market in Asia Pacific is marked by intense competition, with key players such as Kao Corp. and Shiseido Co. Ltd. leading the charge. Innovation and the launch of new products are at the forefront of their strategies to cater to evolving consumer preferences. In countries like China, Japan, and South Korea, the millennial working population is driving demand for high-quality, premium, and organic personal care items. Lifestyle changes in developing economies, including India and China, are expanding the reach of premium personal care products from urban to rural areas. Consumer behavior plays a significant role in market trends.
Augmented reality and virtual reality technologies are increasingly being used to enhance the customer experience. Allergy testing and product safety are becoming crucial factors in consumer decision-making. Natural and organic products, vegan and cruelty-free offerings, and personalized skincare solutions are gaining popularity. Clinical trials and dermatological testing are essential in ensuring product efficacy. Shelf life, pricing strategies, and brand loyalty are key considerations for both manufacturers and consumers. Oral care, hair styling, hair color, bath & shower, and body care categories continue to dominate the market. Product reviews and data analytics are critical tools for understanding consumer preferences and influencer marketing is a powerful promotional strategy.
Machine learning and artificial intelligence are being employed to analyze consumer data and optimize marketing efforts. Sun care, men's grooming, and women's grooming are growing segments. Subscription services and dental floss are emerging trends. Competitor analysis and skin concerns are ongoing concerns for market players. Product reviews, data analytics, and content marketing are essential components of marketing strategies. Bath & shower, body care, and skin analysis are popular retail channels. Product safety, product efficacy, and customer experience are key differentiators. Brands are focusing on catering to various skin types and concerns. In summary, the market in Asia Pacific is dynamic and diverse, with a focus on innovation, consumer preferences, and product quality.
The use of technology, data analytics, and influencer marketing is transforming the industry. The market is expected to continue growing, driven by changing consumer behaviors and lifestyle trends.
Market Dynamics
Our researchers analyzed the data with 2023 as the base year, along with the key drivers, trends, and challenges. A holistic analysis of drivers will help companies refine their marketing strategies to gain a competitive advantage.
What are the key market drivers leading to the rise in the adoption of Personal Care Industry?
- The surge in demand from an expanding consumer base of male and female clients is the primary growth factor for the market.
- The market is experiencing significant growth, with a focus on innovation and inclusivity in 2023. Brands are expanding their product offerings beyond traditional men's grooming items, such as dental floss, to include skincare and cosmetics. Product reviews and data analytics play a crucial role in shaping consumer preferences, driving demand for high-quality, effective, and sustainable personal care products. Subscription services have gained popularity, offering customers convenience and cost savings. Pricing strategies vary based on factors such as skin type, dermatological testing, and vegan certifications. Machine learning algorithms are used to analyze consumer behavior and preferences, enabling brands to tailor their marketing efforts and product development.
- Gender-neutral makeup lines are emerging in response to the increasing demand for personal care products from all genders. Brands are recognizing the importance of catering to diverse customer bases and offering products that appeal to both men and women. The use of vegan and eco-friendly ingredients is also a key trend, reflecting consumers' growing concern for animal welfare and the environment. Content marketing is an effective strategy for building brand awareness and engaging customers. Brands are using social media platforms and blogs to share educational articles, product reviews, and tutorials, positioning themselves as trusted sources of information and expertise.
- The market is evolving rapidly, with a focus on innovation, inclusivity, and sustainability. Brands that can effectively leverage data analytics, content marketing, and consumer insights will be well-positioned to succeed in this competitive landscape.
What are the market trends shaping the Personal Care Industry?
- Social media and blogging are emerging as influential marketing trends. Professionals leveraging these platforms can effectively reach and engage audiences.
- Personal care brands are leveraging social media to engage with consumers and promote their cruelty-free products. With the vast array of social media networks available, brands utilize various platforms to showcase and market their offerings. Instagram, Facebook, and YouTube are popular choices due to their large user base and ability to provide immersive visual content. Influencer marketing plays a significant role in personal care sales, with influencers promoting products to their followers, driving consumer interest and sales. Body care and men's grooming are key product categories experiencing growth. Consumers are increasingly concerned with skin issues and seek effective solutions, creating opportunities for brands to address these concerns.
- Competitor analysis is crucial for brands to stay competitive and differentiate themselves in the market. Virtual reality technology may also emerge as a new marketing tool, allowing consumers to experience products in a more interactive and engaging way. Social media marketing, influencer partnerships, and addressing consumer skin concerns are essential strategies for personal care brands to succeed in today's market.
What challenges does the Personal Care Industry face during its growth?
- The escalating costs of producing natural and organic personal care products pose a significant challenge to the industry's growth trajectory.
- The market exhibits a significant focus on consumer preferences for natural and organic products. These items, comprised of plant-based extracts, essential oils, and other naturally derived elements, lack artificial flavors and antibiotics. However, their premium pricing restricts accessibility for some consumers. The production costs for organic personal care products are higher due to the extensive labor inputs required to maintain quality and adhere to stringent government regulations. Advancements in technology, such as predictive modeling and augmented reality, influence consumer behavior. For instance, virtual hair styling and allergy testing through augmented reality applications enhance the customer experience.
- Clinical trials ensure product efficacy, particularly in categories like oral care and hair color. Natural products continue to dominate the market, with a growing emphasis on product innovation and sustainability. Manufacturers prioritize customer experience and satisfaction, emphasizing transparency and trust. Oral care and hair styling categories are experiencing notable growth, driven by increasing consumer awareness and demand for effective, natural solutions. As the market evolves, manufacturers must balance product innovation, sustainability, and regulatory compliance to meet consumer expectations and maintain a competitive edge.
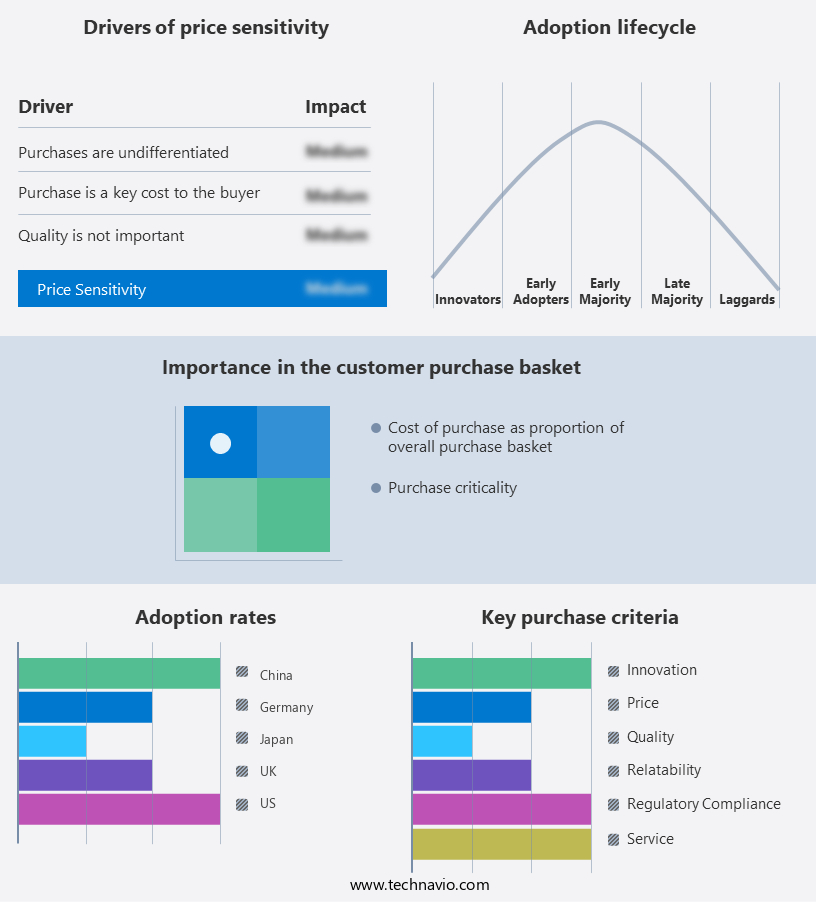
Exclusive Customer Landscape
The personal care market forecasting report includes the adoption lifecycle of the market, covering from the innovator's stage to the laggard's stage. It focuses on adoption rates in different regions based on penetration. Furthermore, the personal care market report also includes key purchase criteria and drivers of price sensitivity to help companies evaluate and develop their market growth analysis strategies.
Customer Landscape
Key Companies & Market Insights
Companies are implementing various strategies, such as strategic alliances, personal care market forecast, partnerships, mergers and acquisitions, geographical expansion, and product/service launches, to enhance their presence in the industry.
Amway Corp. - This company specializes in the production and distribution of high-quality personal care items.
The industry research and growth report includes detailed analyses of the competitive landscape of the market and information about key companies, including:
- Amway Corp.
- Beiersdorf AG
- Colgate-Palmolive Co.
- Coty Inc.
- Edgewell Personal Care Co.
- Emami Ltd.
- Estée Lauder Companies Inc.
- Godrej Consumer Products Ltd.
- Henkel AG & Co. KGaA
- Hindustan Unilever Ltd.
- Johnson & Johnson
- Kao Corp.
- L'Occitane International S.A.
- L'Oréal S.A.
- Natura &Co
- Oriflame Cosmetics AG
- Procter & Gamble Co.
- Revlon Inc.
- Shiseido Co. Ltd.
- Unilever PLC
Qualitative and quantitative analysis of companies has been conducted to help clients understand the wider business environment as well as the strengths and weaknesses of key industry players. Data is qualitatively analyzed to categorize companies as pure play, category-focused, industry-focused, and diversified; it is quantitatively analyzed to categorize companies as dominant, leading, strong, tentative, and weak.
Recent Development and News in Personal Care Market
- In March 2024, L'Oréal, the world's largest cosmetics company, introduced an innovative skincare product line, "Revitalift Derm-Defense," which combines vitamin C and niacinamide to address multiple signs of aging (L'Oréal press release, 2024). This launch represents a significant strategic shift towards addressing the growing demand for multi-functional skincare products.
- In August 2024, Unilever and Google announced a partnership to develop a voice-activated, AI-powered skincare assistant. This collaboration aims to provide personalized skincare recommendations based on individual skin types and conditions, marking a major leap in the use of technology in the personal care industry (Unilever press release, 2024).
- In January 2025, Estée Lauder completed the acquisition of Deciem, a Canadian skincare brand known for its affordable, science-backed products. This strategic move strengthens Estée Lauder's presence in the mid-priced skincare segment and expands its product portfolio (Estée Lauder press release, 2025).
- In May 2025, the European Union passed the new Cosmetics Regulation, which bans over 1,300 ingredients and requires companies to provide more detailed information on product labels. This regulatory change represents a significant shift towards stricter safety standards and increased transparency in the personal care industry (European Commission press release, 2025).
Research Analyst Overview
- The market is experiencing significant shifts as consumers prioritize active ingredients and ethical values in their beauty routines. Green and sustainable beauty trends are on the rise, with an increasing demand for products that cater to various skin concerns, such as dry skin, sensitive skin, acne-prone skin, and skin tone. Color protection and hair damage are key areas of focus, with vitamin C and hyaluronic acid gaining popularity for skincare, while glycolic acid and salicylic acid are favored for addressing acne. Sustainable and clean beauty are becoming essential components of a holistic health approach, with ethical considerations and body image concerns influencing consumer choices.
- Mass market beauty brands are responding by offering more inclusive ranges, catering to diverse hair types and textures, including oily, combination, and curly hair. Luxury beauty brands continue to innovate with advanced formulations, such as color cosmetics infused with skin benefits and scalp care solutions. Hair growth and hair loss are also significant concerns, with consumers exploring options like hair extensions and hair care treatments. The beauty industry's evolving landscape reflects the importance of catering to diverse needs and preferences, as consumers seek effective, sustainable, and ethically-sourced products for their beauty regimens.
Dive into Technavio's robust research methodology, blending expert interviews, extensive data synthesis, and validated models for unparalleled Personal Care Market insights. See full methodology.
|
Market Scope |
|
|
Report Coverage |
Details |
|
Page number |
183 |
|
Base year |
2023 |
|
Historic period |
2018-2022 |
|
Forecast period |
2024-2028 |
|
Growth momentum & CAGR |
Accelerate at a CAGR of 6.03% |
|
Market growth 2024-2028 |
USD 167.2 billion |
|
Market structure |
Fragmented |
|
YoY growth 2023-2024(%) |
5.59 |
|
Key countries |
US, Canada, Germany, UK, Italy, France, China, India, Japan, Brazil, Egypt, UAE, Oman, Argentina, KSA, UAE, Brazil, and Rest of World (ROW) |
|
Competitive landscape |
Leading Companies, Market Positioning of Companies, Competitive Strategies, and Industry Risks |
What are the Key Data Covered in this Personal Care Market Research and Growth Report?
- CAGR of the Personal Care industry during the forecast period
- Detailed information on factors that will drive the growth and forecasting between 2024 and 2028
- Precise estimation of the size of the market and its contribution of the industry in focus to the parent market
- Accurate predictions about upcoming growth and trends and changes in consumer behaviour
- Growth of the market across APAC, Europe, North America, Middle East and Africa, and South America
- Thorough analysis of the market's competitive landscape and detailed information about companies
- Comprehensive analysis of factors that will challenge the personal care market growth of industry companies
We can help! Our analysts can customize this personal care market research report to meet your requirements.
 RIA -
RIA - 
