
Nanofiber Market Size 2024-2028
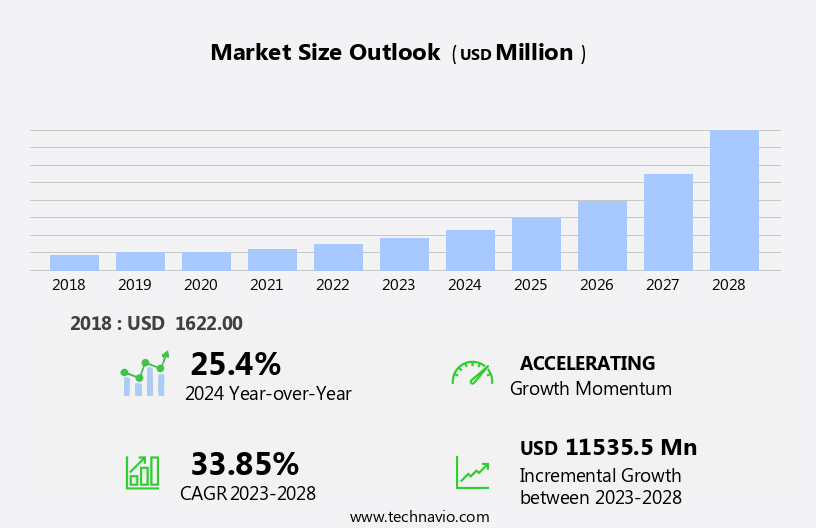
The nanofiber market size is forecast to increase by USD 11.54 billion at a CAGR of 33.85% between 2023 and 2028.
- The market is experiencing significant growth due to the increasing demand for renewable energy and sustainable products. This trend is driven by growing consumer awareness and government initiatives to reduce carbon emissions and promote eco-friendly solutions. Nanofibers, with their unique properties such as high surface area, small size, and superior filtration capabilities, are finding extensive applications in various industries, including energy storage, filtration, and biomedical. However, the production of nanofibers poses several challenges. One of the main obstacles is the high production cost, which is attributed to the complex manufacturing processes and the need for specialized equipment.
- Additionally, ensuring consistent quality and uniformity in nanofiber production remains a significant challenge. These production challenges may hinder the market's growth and require continuous innovation and investment to overcome them. Companies seeking to capitalize on the market opportunities and navigate these challenges effectively must focus on developing cost-effective production methods and ensuring consistent quality in their nanofiber products.
What will be the Size of the Nanofiber Market during the forecast period?
- The market continues to evolve, driven by advancements in nanofiber technology and polymer science. Nanofiber development has led to the production of nanofibrous materials with exceptional mechanical strength and large surface areas, making them ideal for various applications. In the personal care sector, nanofibers are utilized for air filtration in masks, while in water treatment, they offer effective filtration and separation. Nanofiber innovation extends to medical devices, where they are used in drug delivery systems and tissue engineering. The energy industry also benefits from nanofibers, with applications in fuel cells and batteries. Nanofiber processing techniques continue to advance, enabling the production of fibers with precise diameter control and uniformity.
- Regulations and safety standards are crucial in the market, ensuring the production and use of nanofibers meet industry requirements. Research and development efforts are ongoing, with nanofiber characterization techniques and patent filings reflecting the continuous innovation in this field. The market is expected to expand further, with potential applications in wound healing, energy storage, and environmental remediation.
How is this Nanofiber Industry segmented?
The nanofiber industry research report provides comprehensive data (region-wise segment analysis), with forecasts and estimates in "USD million" for the period 2024-2028, as well as historical data from 2018-2022 for the following segments.
- Product
- Polymer
- Carbon
- Glass
- Ceramic
- Others
- Application
- Air and liquid filtration
- Energy
- Electronics
- Medical
- Others
- Geography
- North America
- US
- Europe
- Germany
- APAC
- China
- Japan
- South Korea
- Rest of World (ROW)
- North America
By Product Insights
The polymer segment is estimated to witness significant growth during the forecast period.
Polymer nanofibers, characterized by their small fiber diameters ranging from a few nanometers to over 100 nanometers, offer unique properties due to their large surface area and small pore size. These nanofibers, derived from polymer structures, exhibit enhanced qualities and flexibility, making them valuable in various applications, including composites, biomaterials, and filtration systems. Air and liquid filtration industries have already adopted polymer nanofibers for their effectiveness. The textile industry is projected to experience significant demand for these nanofibers due to their potential in creating lightweight, breathable, and high-performance fabrics.
Material science and polymer science play crucial roles in nanofiber development, enabling advancements in mechanical strength, processing techniques, and surface area characterization. Nanofiber innovation continues to expand, with applications in water treatment, environmental applications, medical devices, drug delivery systems, energy industry, and tissue engineering. Nanofiber regulations ensure safety and manufacturing standards, while ongoing research propels new discoveries and applications.
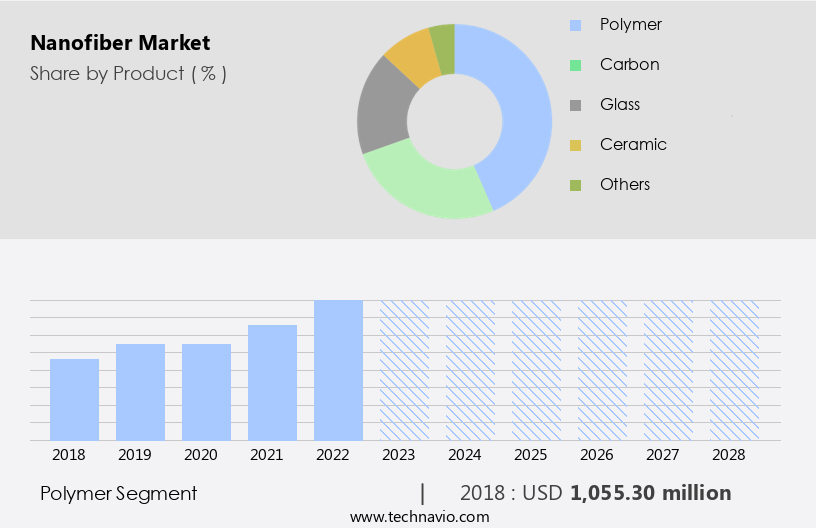
The Polymer segment was valued at USD 1.06 billion in 2018 and showed a gradual increase during the forecast period.
Regional Analysis
APAC is estimated to contribute 51% to the growth of the global market during the forecast period.Technavio’s analysts have elaborately explained the regional trends and drivers that shape the market during the forecast period.
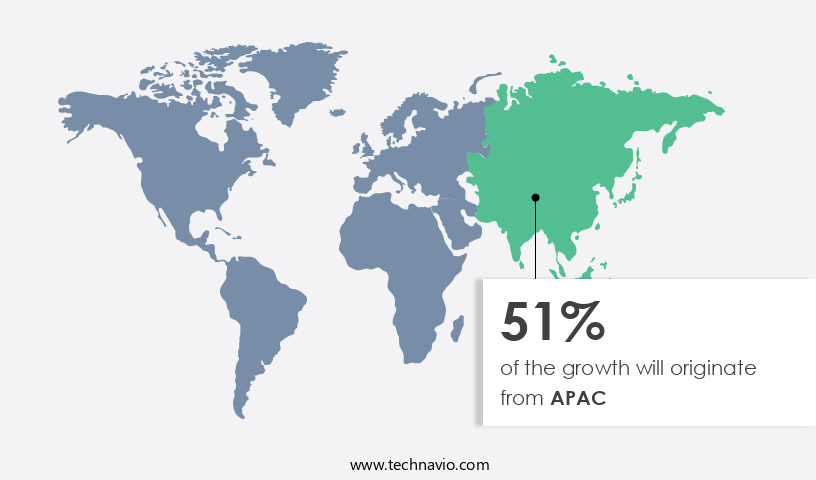
The market in the Asia Pacific region is experiencing significant growth due to increasing investments in countries like Japan, China, and India. Nippon Paper Industries Co. Ltd., a prominent Japanese paper manufacturing company, is a key player in this market. Their nanofiber production facility in Japan has an annual capacity of 500 tons. Notably, Nippon has commercialized cellulose nanofibers for use in deodorant sheets, which are made from wood pulp and processed using the TEMPO catalytic oxidation method. Another notable company, Oji Holdings Corp., offers a cellulose nanofiber product called AUROVISCO. This high-performance nanofiber is manufactured from phosphorylated cellulose nanofibers, which boast high transparency, viscosity, and particle stabilizing properties.
The nanofiber industry encompasses various applications, including personal care, water treatment, environmental applications, medical devices, and tissue engineering. Material science and polymer science play crucial roles in nanofiber development, with advancements in mechanical strength, processing, and characterization driving innovation. Nanofibers are also used in air filtration, drug delivery systems, and energy storage, among other applications. Regulations and safety concerns are essential considerations in the market, with ongoing research focusing on manufacturing standards and performance enhancements.
Market Dynamics
Our researchers analyzed the data with 2023 as the base year, along with the key drivers, trends, and challenges. A holistic analysis of drivers will help companies refine their marketing strategies to gain a competitive advantage.
What are the key market drivers leading to the rise in the adoption of Nanofiber Industry?
- The increasing demand for renewable energy and sustainable products serves as the primary catalyst for market growth.
- Nanofibers, with their unique properties, have gained significant attention in various industries, particularly in renewable energy and sustainable product manufacturing. In the realm of energy, nanofibers are extensively utilized in the production of lithium-ion batteries, serving as effective electrode and separator materials due to their superior power capabilities and excellent kinetic properties. Beyond energy, nanofibers have made a mark in the manufacturing sector by contributing to the creation of eco-friendly products. For instance, cellulose nanofibers have been employed to reduce the environmental footprint of paper production. By incorporating cellulose nanofibers into paper pulp, manufacturers can produce a paper that can be recycled more times than conventional paper, making it a more sustainable choice.
- The interest in producing paper with nanometer-wide cellulose fibers, in addition to regular fibers, has been a focus of research in recent years. This innovative approach can lead to significant advancements in various industries, underscoring the importance of ongoing nanofiber research and development.
What are the market trends shaping the Nanofiber Industry?
- The trend in the market is leaning towards new product developments. As a professional, I can provide you with up-to-date and detailed information on emerging products.
- The nanofiber industry is experiencing significant growth due to the unique properties of nanofibrous materials in various sectors. In personal care, nanofibers are used for filtration in face masks and cosmetics. In the medical field, they are utilized in the production of advanced medical devices. For water treatment, nanofibers offer superior filtration capabilities. Environmental applications include air filtration and soil remediation. New product development is a key driver in the market. Manufacturers and suppliers of nanofiber production equipment, as well as technology providers, are introducing innovative solutions to expand their market shares. For instance, in April 2022, Teijin Ltd.
- Launched an eco-friendly staple polyester nanofiber for use in reinforcing rubber products in industries such as automotive. This development underscores the potential of nanofibers in enhancing product performance while addressing environmental concerns. Material science continues to play a pivotal role in the advancement of nanofiber technology, leading to new applications and markets. As the industry evolves, nanofibers are poised to make a significant impact in various sectors, offering improved filtration, enhanced performance, and sustainable solutions.
What challenges does the Nanofiber Industry face during its growth?
- The production challenges posed in the industry represent a significant hurdle to its growth. By addressing these obstacles, companies can enhance their productivity and contribute to the industry's expansion.
- Nanofiber technology, a significant advancement in polymer science, has gained considerable attention due to its potential applications in various industries. The development of nanofibers through electrospinning involves processing polymers into ultra-thin fibers, which offer enhanced mechanical strength and a large surface area. However, challenges persist in maintaining uniformity during production and eliminating defects, such as beads and pores, in the nanofibers. These issues are primarily influenced by the concentration of polymers used. High polymer concentrations can lead to the formation of spherical or spindle-shaped beads, negatively impacting the quality of nanofibers.
- Research and development efforts are underway to address these challenges, including techniques to reduce surface tension in polymer solutions, resulting in the production of defect-free nanofibers. This innovation holds promise for applications in air filtration, drug delivery, and other industries that require high-performance materials with large surface areas.
Exclusive Customer Landscape
The nanofiber market forecasting report includes the adoption lifecycle of the market, covering from the innovator’s stage to the laggard’s stage. It focuses on adoption rates in different regions based on penetration. Furthermore, the nanofiber market report also includes key purchase criteria and drivers of price sensitivity to help companies evaluate and develop their market growth analysis strategies.

Customer Landscape
Key Companies & Market Insights
Companies are implementing various strategies, such as strategic alliances, nanofiber market forecast, partnerships, mergers and acquisitions, geographical expansion, and product/service launches, to enhance their presence in the industry.
Abalioglu Holding AS - This company specializes in the development and distribution of innovative sports products. Our offerings cater to diverse athletic pursuits, ensuring optimal performance and comfort for consumers. Through rigorous research and development, we continually push the boundaries of sports technology, delivering cutting-edge solutions that enhance the user experience. Our commitment to quality and originality sets us apart, driving increased exposure in search engines and fostering a strong reputation within the industry.
The industry research and growth report includes detailed analyses of the competitive landscape of the market and information about key companies, including:
- Abalioglu Holding AS
- Ahlstrom Holding 3 Oy
- Asahi Kasei Corp.
- Berkshire Hathaway Inc.
- Donaldson Co. Inc.
- DuPont de Nemours Inc.
- eSpin Technologies Inc.
- Freudenberg and Co. KG
- Grupo Antolin Irausa SA
- Hollingsworth and Vose
- Inovenso Inc.
- Mitsubishi Chemical Group Corp.
- Nanolayr Ltd.
- NanoTechLabs Inc.
- Nippon Paper Industries Co. Ltd.
- Oji Holdings Corp.
- Teijin Ltd.
- Toray Industries Inc.
- US Global Nanospace Inc.
- Verdex Technologies Inc.
Qualitative and quantitative analysis of companies has been conducted to help clients understand the wider business environment as well as the strengths and weaknesses of key industry players. Data is qualitatively analyzed to categorize companies as pure play, category-focused, industry-focused, and diversified; it is quantitatively analyzed to categorize companies as dominant, leading, strong, tentative, and weak.
Recent Development and News in Nanofiber Market
- In January 2024, Cabot Corporation, a leading nanotechnology and specialty chemicals company, announced the commercial launch of its new line of nanofibers for filtration applications, marking a significant stride in the nanofiber industry (Cabot Corporation Press Release, 2024). This development underscores the growing demand for advanced filtration solutions in various industries, including healthcare, water treatment, and automotive.
- In March 2025, PepsiCo, a global food and beverage corporation, entered into a strategic partnership with FibroGenesis, a nanofiber technology company, to develop and commercialize nanofiber-based packaging for its beverage products. This collaboration represents a pioneering step in the use of nanofibers for sustainable packaging, addressing the increasing consumer awareness and demand for eco-friendly alternatives (FibroGenesis Press Release, 2025).
- In July 2024, 3M, a prominent industrial company, completed the acquisition of Molex, a leading manufacturer of electronic, electrical, and fiber optic interconnect solutions. The acquisition enabled 3M to integrate Molex's nanofiber technology into its portfolio, expanding its capabilities in advanced materials and enhancing its position in the market (3M Press Release, 2024).
- In October 2025, the European Union granted regulatory approval for the commercial use of nanofibers in food packaging, paving the way for a significant expansion of the market in Europe. This approval is expected to boost the demand for nanofibers in the food industry, particularly for applications such as food contact materials and food preservation (European Commission Press Release, 2025).
Research Analyst Overview
Nanofibers, ultra-thin fibers with dimensions between 100 nanometers and 1 micron, have gained significant attention in various industries due to their unique properties. The market for nanofiber-based catalysts and pharmaceutical products is witnessing growth, as these materials enable efficient catalysis and controlled drug release, respectively. Nanofiber composites, with their tailored fiber alignment and architecture, are revolutionizing industries, from aerospace components to automotive parts. Fiber morphology and orientation play crucial roles in nanofiber-based sensors and scaffolds for medical devices and environmental applications.
Surface functionalization enhances the performance of nanofiber-based electronics, textiles, and cosmetics. Nanofiber-based filters and membranes are essential in water treatment and air purification systems. The integration of nanofibers in therapeutics and diagnostics is paving the way for advanced medical treatments and point-of-care devices.
Dive into Technavio’s robust research methodology, blending expert interviews, extensive data synthesis, and validated models for unparalleled Nanofiber Market insights. See full methodology.
|
Market Scope |
|
|
Report Coverage |
Details |
|
Page number |
192 |
|
Base year |
2023 |
|
Historic period |
2018-2022 |
|
Forecast period |
2024-2028 |
|
Growth momentum & CAGR |
Accelerate at a CAGR of 33.85% |
|
Market growth 2024-2028 |
USD 11535.5 million |
|
Market structure |
Fragmented |
|
YoY growth 2023-2024(%) |
25.4 |
|
Key countries |
US, China, Japan, South Korea, and Germany |
|
Competitive landscape |
Leading Companies, Market Positioning of Companies, Competitive Strategies, and Industry Risks |
What are the Key Data Covered in this Nanofiber Market Research and Growth Report?
- CAGR of the Nanofiber industry during the forecast period
- Detailed information on factors that will drive the growth and forecasting between 2024 and 2028
- Precise estimation of the size of the market and its contribution of the industry in focus to the parent market
- Accurate predictions about upcoming growth and trends and changes in consumer behaviour
- Growth of the market across APAC, North America, Europe, South America, and Middle East and Africa
- Thorough analysis of the market’s competitive landscape and detailed information about companies
- Comprehensive analysis of factors that will challenge the nanofiber market growth of industry companies
We can help! Our analysts can customize this nanofiber market research report to meet your requirements.
 RIA -
RIA - 
