Electric Vehicle (EV) Market Analysis, Size, and Forecast 2026-2030: APAC (China, Japan, and India), Europe (Germany, UK, and France), North America (US, Canada, and Mexico), South America (Brazil and Argentina), Middle East and Africa (UAE, South Africa, and Saudi Arabia), and Rest of World (ROW)

Electric Vehicle (EV) Market Analysis, Size, and Forecast 2026-2030:
APAC (China, Japan, and India), Europe (Germany, UK, and France), North America (US, Canada, and Mexico), South America (Brazil and Argentina), Middle East and Africa (UAE, South Africa, and Saudi Arabia), and Rest of World (ROW)

Published: Mar 2026 303 Pages SKU: IRTNTR70839

Market Overview at a Glance

$521.4 B
Market Opportunity
16.7%
CAGR 2025 - 2030
48.7%
APAC Growth
$249.1 B
BEV segment 2024

Electric Vehicle (EV) Market Size 2026-2030

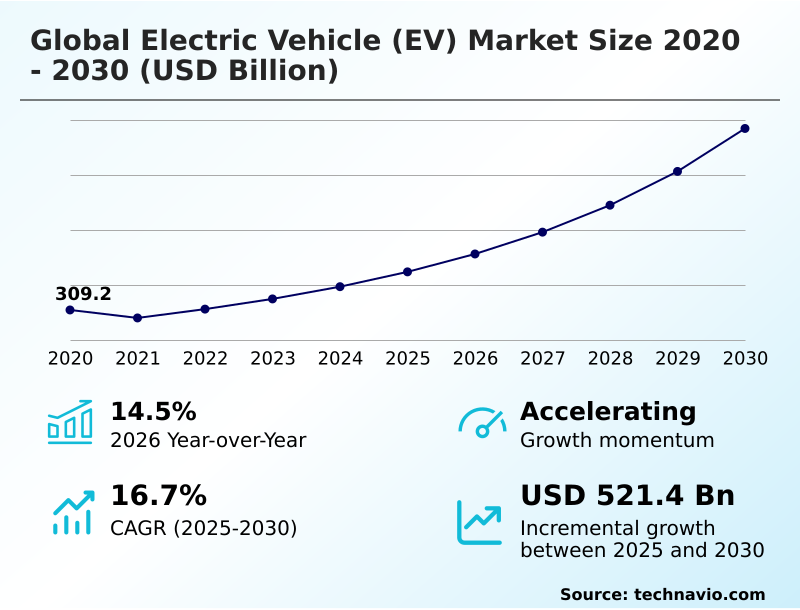
The electric vehicle (ev) market size is valued to increase by USD 521.4 billion, at a CAGR of 16.7% from 2025 to 2030. Stringent government policies, regulations, and financial incentives will drive the electric vehicle (ev) market.

Major Market Trends & Insights

  • APAC dominated the market and accounted for a 48.7% growth during the forecast period.
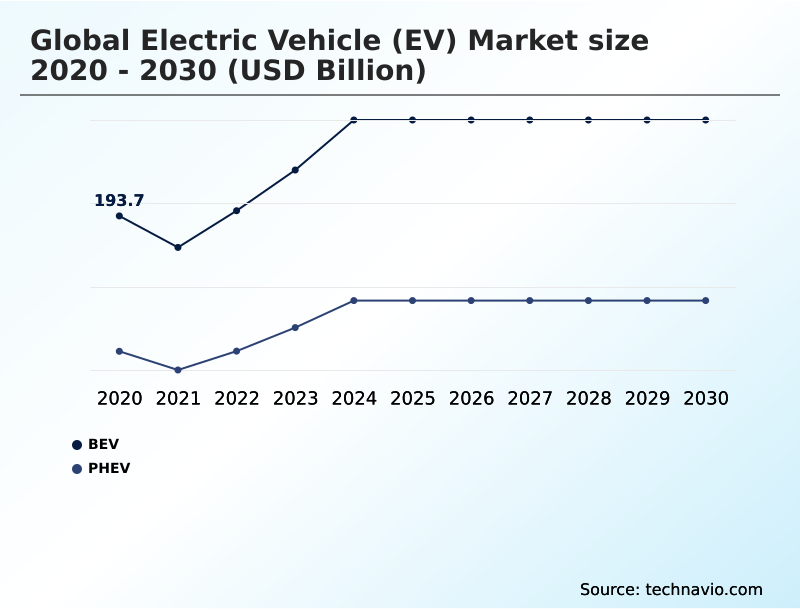
  • By Type - BEV segment was valued at USD 249.1 billion in 2024
  • By Charging - Normal charging segment accounted for the largest market revenue share in 2024

Market Size & Forecast

  • Market Opportunities: USD 660 billion
  • Market Future Opportunities: USD 521.4 billion
  • CAGR from 2025 to 2030 : 16.7%

Market Summary

  • The electric vehicle (ev) market is undergoing a fundamental transformation driven by advancements in battery technology and a global push for decarbonization. The industry is rapidly moving beyond early adoption, focusing on scaling production and enhancing the e-mobility ecosystem. A key dynamic is the development of a resilient supply chain for critical components, as interruptions can significantly impact manufacturing output.
  • For instance, a business scenario involving the implementation of a multi-source strategy for battery cells can reduce production downtime by over 15%, ensuring operational continuity. Core innovations center on improving battery energy density to extend range and reducing the total cost of ownership (tco) to achieve price parity with conventional vehicles.
  • The expansion of the public charging network and the integration of smart charging technology are critical for building consumer confidence and managing grid stability. Concurrently, the evolution of the software-defined vehicle architecture enables continuous improvement through over-the-air (ota) software updates, reshaping the ownership experience.
  • These intersecting forces are creating a highly competitive and rapidly evolving market landscape where technological leadership and supply chain mastery are paramount for success.

What will be the Size of the Electric Vehicle (EV) Market during the forecast period?

Get Key Insights on Market Forecast (PDF) Request Free Sample

How is the Electric Vehicle (EV) Market Segmented?

The electric vehicle (ev) industry research report provides comprehensive data (region-wise segment analysis), with forecasts and estimates in "USD billion" for the period 2026-2030, as well as historical data from 2020-2024 for the following segments.

  • Type
    • BEV
    • PHEV
  • Charging
    • Normal charging
    • Super charging
  • Vehicle type
    • Passenger cars
    • Two wheelers
    • Commercial vehicles
  • Geography
    • APAC
      • China
      • Japan
      • India
    • Europe
      • Germany
      • UK
      • France
    • North America
      • US
      • Canada
      • Mexico
    • South America
      • Brazil
      • Argentina
    • Middle East and Africa
      • UAE
      • South Africa
      • Saudi Arabia
    • Rest of World (ROW)

By Type Insights

The bev segment is estimated to witness significant growth during the forecast period.

The global electric vehicle (ev) market segmentation reflects a decisive shift toward battery-electric platforms, which are central to the industry's automotive electrification strategy.

This segment's expansion, contributing to over 48% of market growth, is propelled by innovations in lithium-ion battery pack design and improved battery energy density.

The development of a supporting e-mobility ecosystem, featuring accessible DC fast charging (DCFC) and advanced battery thermal management systems, is crucial for both electric passenger car models and emerging commercial electric truck applications.

As part of a broader transport decarbonization policy, advancements such as over-the-air (OTA) software updates and vehicle-to-grid (V2G) capabilities are enhancing vehicle value and utility, directly addressing consumer and fleet operator demands while contributing to urban air quality improvement.

Request Free Sample

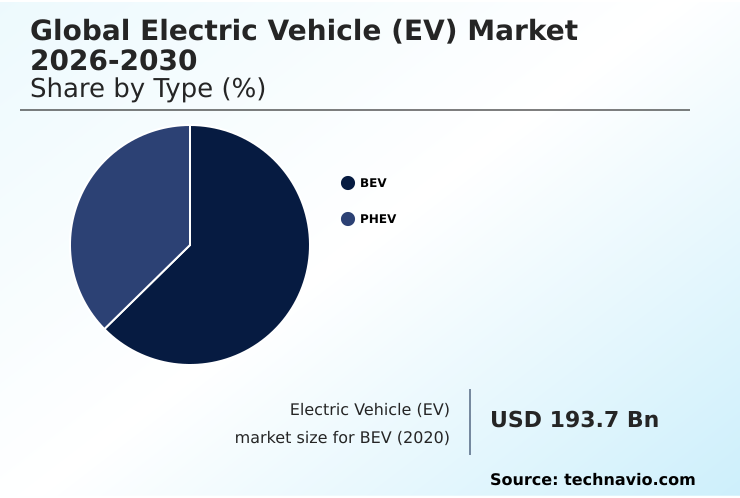
The BEV segment was valued at USD 249.1 billion in 2024 and showed a gradual increase during the forecast period.

Request Free Sample

Regional Analysis

APAC is estimated to contribute 48.7% to the growth of the global market during the forecast period.Technavio’s analysts have elaborately explained the regional trends and drivers that shape the market during the forecast period.

See How Electric Vehicle (EV) Market Demand is Rising in APAC Request Free Sample

The geographic landscape of the market is characterized by varied regional momentum, with APAC leading global expansion by contributing 48.7% of incremental growth, compared to 35.5% from Europe. This disparity is driven by distinct policy frameworks and consumer adoption dynamics.

In leading regions, the focus is on a holistic e-mobility ecosystem, integrating smart charging technology and vehicle-to-home (v2h) power capabilities to enhance grid stability management.

The build-out of battery swapping station networks and support for last-mile delivery van electrification are key priorities. In-cabin infotainment systems are also becoming a major differentiator.

Securing the automotive supply chain security for critical minerals and components remains a universal priority, while low-emission zone access rules create specific demand drivers in urban centers, influencing regional product strategies.

Market Dynamics

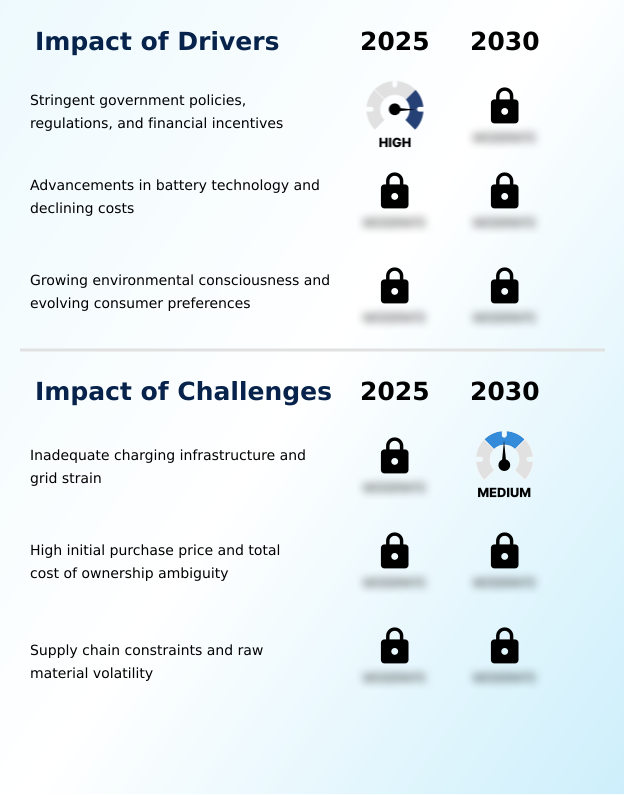
Our researchers analyzed the data with 2025 as the base year, along with the key drivers, trends, and challenges. A holistic analysis of drivers will help companies refine their marketing strategies to gain a competitive advantage.

  • Strategic decision-making in the market hinges on a complex analysis of multiple interconnected factors. The impact of battery cost on ev price remains a central concern, directly influencing the timeline for developing affordable mass-market evs. The role of government policy in ev adoption is critical, as incentives can heavily sway bev vs phev consumer choice factors.
  • At the same time, the challenges of public charging infrastructure and the subsequent impact of ev charging on electricity grid stability require robust solutions, including v2g technology for grid support. Stakeholders are closely watching the solid-state battery commercialization timeline for its potential to revolutionize the industry.
  • For fleet operators, the tco comparison of ev vs ice is a primary driver, while the role of evs in corporate sustainability is becoming a boardroom-level priority. For commercial applications, advancements in megawatt charging for commercial trucks are essential.
  • Operationally, navigating ev manufacturing supply chain bottlenecks is paramount; agile firms that diversify raw material sourcing for ev batteries have demonstrated a 15% greater resilience to price shocks. Furthermore, software updates improving ev performance and enhanced adas integration in electric vehicles are key value propositions.
  • Strategies for mitigating ev range anxiety, such as the battery swapping vs fast charging debate, continue to shape consumer experience. As the market matures, ev battery second-life applications and integrating home energy solutions with evs will become increasingly important, especially for ev adoption in emerging economies where grid constraints are more pronounced.

What are the key market drivers leading to the rise in the adoption of Electric Vehicle (EV) Industry?

  • The market is primarily driven by stringent government policies, regulations, and financial incentives designed to accelerate the transition to electric mobility.

  • Market expansion is fundamentally propelled by financial and technological drivers that make electrification more viable.
  • Central to this is ongoing next-generation battery research, which has led to significant advancements in lithium iron phosphate (lfp) chemistry and nickel manganese cobalt (nmc) chemistry, directly addressing range anxiety mitigation.
  • The methodical charging infrastructure deployment, encompassing both public charging network expansion and accessible home charging solutions, is critical. This infrastructure increasingly supports bidirectional charging capability, enabling new connected vehicle services. For fleet management, lower operational costs are a compelling factor.
  • In the passenger segment, automotive software development is creating new revenue streams. The declining cost of powertrain electrification is also reducing ev resale value depreciation, making ownership more attractive.
  • Moreover, the establishment of a formal ev battery recycling process addresses sustainability concerns.

What are the market trends shaping the Electric Vehicle (EV) Industry?

  • A defining market trend is the rapid proliferation and diversification of electric vehicle models. This expansion spans across various vehicle segments, body styles, and price points.

  • Key market trends are reshaping the automotive industry transformation, centered on the evolution from standalone products to integrated sustainable mobility solutions. The proliferation of both battery electric vehicle (bev) and plug-in hybrid electric vehicle (phev) models is accelerating, supported by ev adoption consumer incentives. This diversification is critical for lowering the total cost of ownership (tco).
  • A pivotal development is the rise of the software-defined vehicle architecture, which allows for continuous enhancement of advanced driver-assistance systems (adas) and performance, with some updates improving efficiency by over 5%. As clean freight corridors are established, the focus on electric bus public transit intensifies.
  • However, ensuring ev charging station reliability remains a priority, as network uptime directly impacts consumer confidence and adoption velocity, which recently saw a 14.5% year-over-year increase.

What challenges does the Electric Vehicle (EV) Industry face during its growth?

  • A key challenge affecting industry growth is the combination of inadequate charging infrastructure and the resulting strain on electricity grids.

  • Significant challenges constrain the market's growth potential, primarily related to industrial scale and economic viability. Achieving ev purchase price parity with conventional vehicles is a major hurdle, complicated by volatile supply chain raw materials and the high capital cost of gigafactory production scale. Ensuring consistent battery cell manufacturing quality and securing semiconductor chip integration are persistent operational issues.
  • The industry must also adhere to the sustainable battery lifecycle directive, which governs ev battery lifecycle management and adds complexity. For commercial applications, the payload limitations of heavy-duty electric trucks and the need for more efficient light-duty electric vans are key concerns.
  • Furthermore, enhancing ev powertrain efficiency, which can vary by up to 20% based on conditions, and optimizing the autonomous driving sensor suite and regenerative braking system are ongoing technical goals.

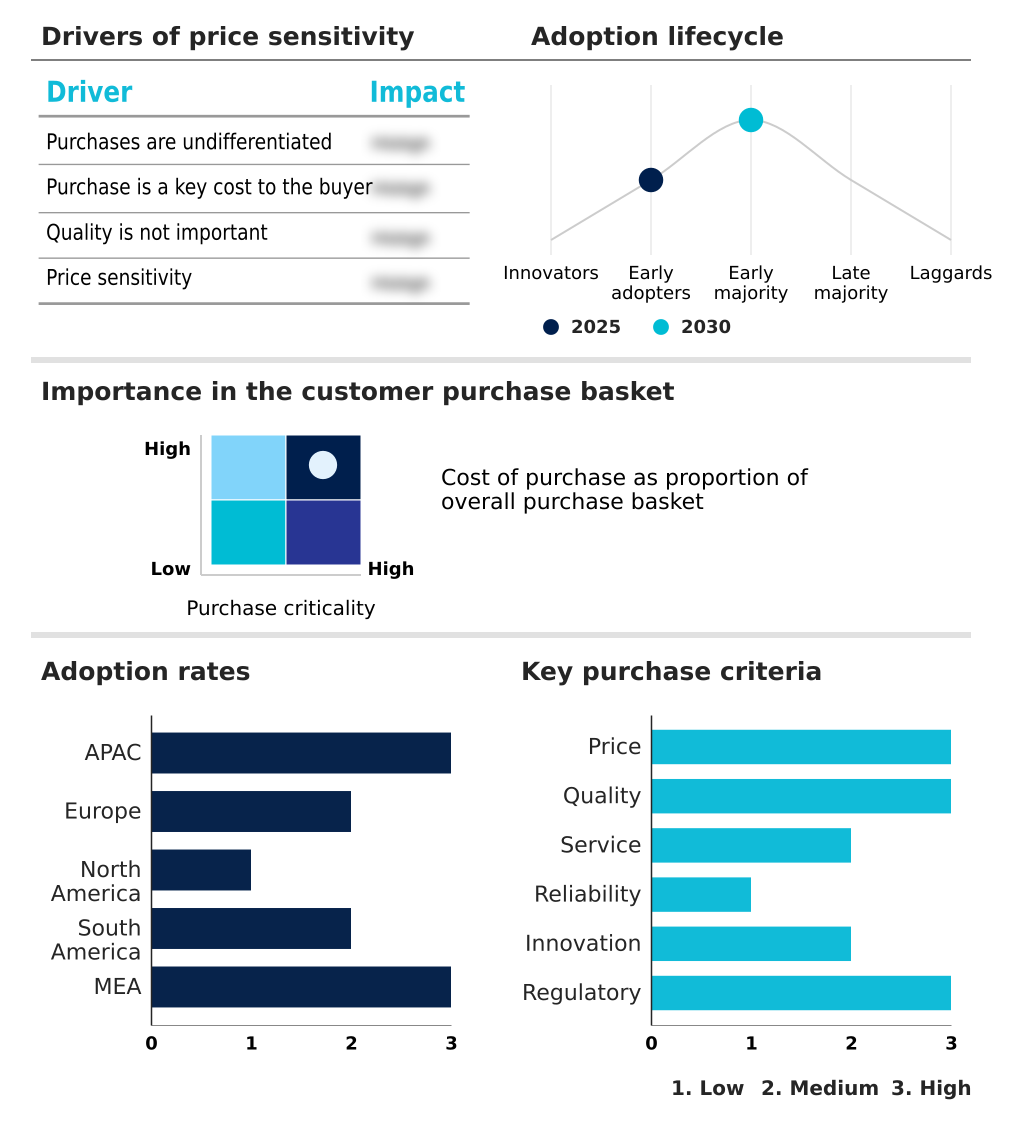
Exclusive Technavio Analysis on Customer Landscape

The electric vehicle (ev) market forecasting report includes the adoption lifecycle of the market, covering from the innovator’s stage to the laggard’s stage. It focuses on adoption rates in different regions based on penetration. Furthermore, the electric vehicle (ev) market report also includes key purchase criteria and drivers of price sensitivity to help companies evaluate and develop their market growth analysis strategies.

Customer Landscape of Electric Vehicle (EV) Industry

Competitive Landscape

Companies are implementing various strategies, such as strategic alliances, electric vehicle (ev) market forecast, partnerships, mergers and acquisitions, geographical expansion, and product/service launches, to enhance their presence in the industry.

Bayerische Motoren Werke AG - Key offerings include a diverse portfolio of electric vehicles, spanning multiple segments from passenger cars to commercial models, driven by advanced battery and powertrain technology.

The industry research and growth report includes detailed analyses of the competitive landscape of the market and information about key companies, including:

  • Bayerische Motoren Werke AG
  • BYD Co. Ltd.
  • Chery Automobile Co. Ltd.
  • Chongqing Changan Auto. Ltd.
  • Dongfeng Motor Corporation Ltd
  • Ford Motor Co.
  • GAC GROUP
  • Geely Auto
  • General Motors Co.
  • Honda Motor Co. Ltd.
  • Hyundai Motor Co.
  • Mahindra and Mahindra Ltd.
  • Mercedes Benz Group AG
  • Nissan Motor Co. Ltd.
  • Renault SAS
  • SAIC Motor Corp. Ltd.
  • Stellantis NV
  • Tesla Inc.
  • Toyota Motor Corp.
  • Volkswagen AG

Qualitative and quantitative analysis of companies has been conducted to help clients understand the wider business environment as well as the strengths and weaknesses of key industry players. Data is qualitatively analyzed to categorize companies as pure play, category-focused, industry-focused, and diversified; it is quantitatively analyzed to categorize companies as dominant, leading, strong, tentative, and weak.

Recent Development and News in Electric vehicle (ev) market

  • In February 2025, the IONNA charging network, a joint venture of several major automakers including BMW, General Motors, and Honda, activated its first wave of high-speed charging stations across North America, marking a significant collaborative effort to build a unified charging ecosystem.
  • In March 2025, Toyota, in partnership with Panasonic and a consortium of Japanese firms, launched the E-Mirai Innovations joint venture with an initial $20 billion commitment to develop and mass-produce solid-state batteries by 2028, aiming to leapfrog current lithium-ion technology.
  • In January 2025, the US Environmental Protection Agency and Environment and Climate Change Canada finalized the Clean Freight Corridors mandate, requiring all new medium- and heavy-duty trucks operating on key trade routes to be zero-emission by 2030.
  • In May 2025, Saudi Arabia's Public Investment Fund launched NEOM Industrial City-Mobility, a $100 billion project to create a fully integrated, carbon-neutral electric vehicle manufacturing ecosystem, including raw material processing, battery production, and vehicle assembly.

Dive into Technavio’s robust research methodology, blending expert interviews, extensive data synthesis, and validated models for unparalleled Electric Vehicle (EV) Market insights. See full methodology.

Market Scope
Page number 303
Base year 2025
Historic period 2020-2024
Forecast period 2026-2030
Growth momentum & CAGR Accelerate at a CAGR of 16.7%
Market growth 2026-2030 USD 521.4 billion
Market structure Fragmented
YoY growth 2025-2026(%) 14.5%
Key countries China, Japan, India, South Korea, Australia, Indonesia, Germany, UK, France, The Netherlands, Norway, Italy, US, Canada, Mexico, Brazil, Argentina, Chile, UAE, South Africa, Saudi Arabia, Egypt and Kenya
Competitive landscape Leading Companies, Market Positioning of Companies, Competitive Strategies, and Industry Risks

Request Free Sample

Research Analyst Overview

  • The market's evolution is driven by the convergence of advanced technologies and stringent regulatory frameworks. Central to this is powertrain electrification, with intense competition in battery cell manufacturing and innovations in both lithium iron phosphate (LFP) chemistry and nickel manganese cobalt (NMC) chemistry to improve battery energy density.
  • The development of a comprehensive e-mobility ecosystem, supported by massive charging infrastructure deployment, is a primary focus. This includes expanding the public charging network with DC fast charging (DCFC) and a future megawatt charging standard, alongside promoting home charging solutions.
  • For boardroom strategy, the zero-emission vehicle mandate directly impacts long-term capital allocation, forcing a pivot in both battery electric vehicle (BEV) and plug-in hybrid electric vehicle (PHEV) development. Firms that effectively integrate a software-defined vehicle architecture for over-the-air (OTA) software updates and advanced driver-assistance systems (ADAS) are gaining a significant competitive edge.
  • Balancing the total cost of ownership (TCO) with performance features like electric motor instant torque from a regenerative braking system and a sophisticated battery thermal management system is key.
  • Success requires managing the supply chain for raw materials at gigafactory production scale, ensuring semiconductor chip integration, and addressing range anxiety mitigation through technologies like a battery swapping station or vehicle-to-grid (V2G) and vehicle-to-home (V2H) power enabled by a robust onboard battery charger and bidirectional charging capability.

What are the Key Data Covered in this Electric Vehicle (EV) Market Research and Growth Report?

  • What is the expected growth of the Electric Vehicle (EV) Market between 2026 and 2030?

    • USD 521.4 billion, at a CAGR of 16.7%

  • What segmentation does the market report cover?

    • The report is segmented by Type (BEV, and PHEV), Charging (Normal charging, and Super charging), Vehicle Type (Passenger cars, Two wheelers, and Commercial vehicles) and Geography (APAC, Europe, North America, South America, Middle East and Africa)

  • Which regions are analyzed in the report?

    • APAC, Europe, North America, South America and Middle East and Africa

  • What are the key growth drivers and market challenges?

    • Stringent government policies, regulations, and financial incentives, Inadequate charging infrastructure and grid strain

  • Who are the major players in the Electric Vehicle (EV) Market?

    • Bayerische Motoren Werke AG, BYD Co. Ltd., Chery Automobile Co. Ltd., Chongqing Changan Auto. Ltd., Dongfeng Motor Corporation Ltd, Ford Motor Co., GAC GROUP, Geely Auto, General Motors Co., Honda Motor Co. Ltd., Hyundai Motor Co., Mahindra and Mahindra Ltd., Mercedes Benz Group AG, Nissan Motor Co. Ltd., Renault SAS, SAIC Motor Corp. Ltd., Stellantis NV, Tesla Inc., Toyota Motor Corp. and Volkswagen AG

Market Research Insights

  • Market dynamics are defined by rapid technological evolution and shifting consumer priorities, with year-over-year expansion recently recorded at 14.5%. A key factor is the automotive industry transformation toward sustainable mobility solutions, which now influences over 60% of new platform development decisions. Strategic imperatives include enhancing EV range and performance while ensuring emissions standards compliance.
  • For instance, regions with proactive transport decarbonization policies see adoption rates nearly double those without such frameworks. The focus on EV maintenance cost reduction and improving the total cost of ownership (TCO) remains critical.
  • The development of a reliable public charging network is a key enabler, directly impacting consumer confidence and the practicality of ownership for a wider demographic, shaping regional competitiveness and overall market velocity.

We can help! Our analysts can customize this electric vehicle (ev) market research report to meet your requirements.

Get in touch

1. Executive Summary

1.1 Market overview

Executive Summary - Chart on Market Overview
Executive Summary - Data Table on Market Overview
Executive Summary - Chart on Global Market Characteristics
Executive Summary - Chart on Market by Geography
Executive Summary - Chart on Market Segmentation by Type
Executive Summary - Chart on Market Segmentation by Charging
Executive Summary - Chart on Market Segmentation by Vehicle Type
Executive Summary - Chart on Incremental Growth
Executive Summary - Data Table on Incremental Growth
Executive Summary - Chart on Company Market Positioning

2. Technavio Analysis

2.1 Analysis of price sensitivity, lifecycle, customer purchase basket, adoption rates, and purchase criteria

2.2 Criticality of inputs and Factors of differentiation

Chart on Overview on criticality of inputs and factors of differentiation

2.3 Factors of disruption

Chart on Overview on factors of disruption

2.4 Impact of drivers and challenges

Chart on Impact of drivers and challenges in 2025 and 2030

3. Market Landscape

3.1 Market ecosystem

Chart on Parent Market
Data Table on - Parent Market

3.2 Market characteristics

Chart on Market characteristics analysis

3.3 Value chain analysis

Chart on Value chain analysis

4. Market Sizing

4.1 Market definition

Data Table on Offerings of companies included in the market definition

4.2 Market segment analysis

Market segments

4.3 Market size 2025

4.4 Market outlook: Forecast for 2025-2030

Chart on Global - Market size and forecast 2025-2030 ($ billion)
Data Table on Global - Market size and forecast 2025-2030 ($ billion)
Chart on Global Market: Year-over-year growth 2025-2030 (%)
Data Table on Global Market: Year-over-year growth 2025-2030 (%)

5. Historic Market Size

5.1 Global Electric Vehicle (EV) Market 2020 - 2024

Historic Market Size - Data Table on Global Electric Vehicle (EV) Market 2020 - 2024 ($ billion)

5.2 Type segment analysis 2020 - 2024

Historic Market Size - Type Segment 2020 - 2024 ($ billion)

5.3 Charging segment analysis 2020 - 2024

Historic Market Size - Charging Segment 2020 - 2024 ($ billion)

5.4 Vehicle Type segment analysis 2020 - 2024

Historic Market Size - Vehicle Type Segment 2020 - 2024 ($ billion)

5.5 Geography segment analysis 2020 - 2024

Historic Market Size - Geography Segment 2020 - 2024 ($ billion)

5.6 Country segment analysis 2020 - 2024

Historic Market Size - Country Segment 2020 - 2024 ($ billion)

6. Qualitative Analysis

6.1 The impact of AI on global electric vehicle (EV) market

7. Five Forces Analysis

7.1 Five forces summary

Five forces analysis - Comparison between 2025 and 2030

7.2 Bargaining power of buyers

Bargaining power of buyers - Impact of key factors 2025 and 2030

7.3 Bargaining power of suppliers

Bargaining power of suppliers - Impact of key factors in 2025 and 2030

7.4 Threat of new entrants

Threat of new entrants - Impact of key factors in 2025 and 2030

7.5 Threat of substitutes

Threat of substitutes - Impact of key factors in 2025 and 2030

7.6 Threat of rivalry

Threat of rivalry - Impact of key factors in 2025 and 2030

7.7 Market condition

Chart on Market condition - Five forces 2025 and 2030

8. Market Segmentation by Type

8.1 Market segments

Chart on Type - Market share 2025-2030 (%)
Data Table on Type - Market share 2025-2030 (%)

8.2 Comparison by Type

Chart on Comparison by Type
Data Table on Comparison by Type

8.3 BEV - Market size and forecast 2025-2030

Chart on BEV - Market size and forecast 2025-2030 ($ billion)
Data Table on BEV - Market size and forecast 2025-2030 ($ billion)
Chart on BEV - Year-over-year growth 2025-2030 (%)
Data Table on BEV - Year-over-year growth 2025-2030 (%)

8.4 PHEV - Market size and forecast 2025-2030

Chart on PHEV - Market size and forecast 2025-2030 ($ billion)
Data Table on PHEV - Market size and forecast 2025-2030 ($ billion)
Chart on PHEV - Year-over-year growth 2025-2030 (%)
Data Table on PHEV - Year-over-year growth 2025-2030 (%)

8.5 Market opportunity by Type

Market opportunity by Type ($ billion)
Data Table on Market opportunity by Type ($ billion)

9. Market Segmentation by Charging

9.1 Market segments

Chart on Charging - Market share 2025-2030 (%)
Data Table on Charging - Market share 2025-2030 (%)

9.2 Comparison by Charging

Chart on Comparison by Charging
Data Table on Comparison by Charging

9.3 Normal charging - Market size and forecast 2025-2030

Chart on Normal charging - Market size and forecast 2025-2030 ($ billion)
Data Table on Normal charging - Market size and forecast 2025-2030 ($ billion)
Chart on Normal charging - Year-over-year growth 2025-2030 (%)
Data Table on Normal charging - Year-over-year growth 2025-2030 (%)

9.4 Super charging - Market size and forecast 2025-2030

Chart on Super charging - Market size and forecast 2025-2030 ($ billion)
Data Table on Super charging - Market size and forecast 2025-2030 ($ billion)
Chart on Super charging - Year-over-year growth 2025-2030 (%)
Data Table on Super charging - Year-over-year growth 2025-2030 (%)

9.5 Market opportunity by Charging

Market opportunity by Charging ($ billion)
Data Table on Market opportunity by Charging ($ billion)

10. Market Segmentation by Vehicle Type

10.1 Market segments

Chart on Vehicle Type - Market share 2025-2030 (%)
Data Table on Vehicle Type - Market share 2025-2030 (%)

10.2 Comparison by Vehicle Type

Chart on Comparison by Vehicle Type
Data Table on Comparison by Vehicle Type

10.3 Passenger cars - Market size and forecast 2025-2030

Chart on Passenger cars - Market size and forecast 2025-2030 ($ billion)
Data Table on Passenger cars - Market size and forecast 2025-2030 ($ billion)
Chart on Passenger cars - Year-over-year growth 2025-2030 (%)
Data Table on Passenger cars - Year-over-year growth 2025-2030 (%)

10.4 Two wheelers - Market size and forecast 2025-2030

Chart on Two wheelers - Market size and forecast 2025-2030 ($ billion)
Data Table on Two wheelers - Market size and forecast 2025-2030 ($ billion)
Chart on Two wheelers - Year-over-year growth 2025-2030 (%)
Data Table on Two wheelers - Year-over-year growth 2025-2030 (%)

10.5 Commercial vehicles - Market size and forecast 2025-2030

Chart on Commercial vehicles - Market size and forecast 2025-2030 ($ billion)
Data Table on Commercial vehicles - Market size and forecast 2025-2030 ($ billion)
Chart on Commercial vehicles - Year-over-year growth 2025-2030 (%)
Data Table on Commercial vehicles - Year-over-year growth 2025-2030 (%)

10.6 Market opportunity by Vehicle Type

Market opportunity by Vehicle Type ($ billion)
Data Table on Market opportunity by Vehicle Type ($ billion)

11. Customer Landscape

11.1 Customer landscape overview

Analysis of price sensitivity, lifecycle, customer purchase basket, adoption rates, and purchase criteria

12. Geographic Landscape

12.1 Geographic segmentation

Chart on Market share by geography 2025-2030 (%)
Data Table on Market share by geography 2025-2030 (%)

12.2 Geographic comparison

Chart on Geographic comparison
Data Table on Geographic comparison

12.3 APAC - Market size and forecast 2025-2030

Chart on APAC - Market size and forecast 2025-2030 ($ billion)
Data Table on APAC - Market size and forecast 2025-2030 ($ billion)
Chart on APAC - Year-over-year growth 2025-2030 (%)
Data Table on APAC - Year-over-year growth 2025-2030 (%)
Chart on Regional Comparison - APAC
Data Table on Regional Comparison - APAC

12.3.1 China - Market size and forecast 2025-2030

Chart on China - Market size and forecast 2025-2030 ($ billion)
Data Table on China - Market size and forecast 2025-2030 ($ billion)
Chart on China - Year-over-year growth 2025-2030 (%)
Data Table on China - Year-over-year growth 2025-2030 (%)

12.3.2 Japan - Market size and forecast 2025-2030

Chart on Japan - Market size and forecast 2025-2030 ($ billion)
Data Table on Japan - Market size and forecast 2025-2030 ($ billion)
Chart on Japan - Year-over-year growth 2025-2030 (%)
Data Table on Japan - Year-over-year growth 2025-2030 (%)

12.3.3 India - Market size and forecast 2025-2030

Chart on India - Market size and forecast 2025-2030 ($ billion)
Data Table on India - Market size and forecast 2025-2030 ($ billion)
Chart on India - Year-over-year growth 2025-2030 (%)
Data Table on India - Year-over-year growth 2025-2030 (%)

12.3.4 South Korea - Market size and forecast 2025-2030

Chart on South Korea - Market size and forecast 2025-2030 ($ billion)
Data Table on South Korea - Market size and forecast 2025-2030 ($ billion)
Chart on South Korea - Year-over-year growth 2025-2030 (%)
Data Table on South Korea - Year-over-year growth 2025-2030 (%)

12.3.5 Australia - Market size and forecast 2025-2030

Chart on Australia - Market size and forecast 2025-2030 ($ billion)
Data Table on Australia - Market size and forecast 2025-2030 ($ billion)
Chart on Australia - Year-over-year growth 2025-2030 (%)
Data Table on Australia - Year-over-year growth 2025-2030 (%)

12.3.6 Indonesia - Market size and forecast 2025-2030

Chart on Indonesia - Market size and forecast 2025-2030 ($ billion)
Data Table on Indonesia - Market size and forecast 2025-2030 ($ billion)
Chart on Indonesia - Year-over-year growth 2025-2030 (%)
Data Table on Indonesia - Year-over-year growth 2025-2030 (%)

12.4 Europe - Market size and forecast 2025-2030

Chart on Europe - Market size and forecast 2025-2030 ($ billion)
Data Table on Europe - Market size and forecast 2025-2030 ($ billion)
Chart on Europe - Year-over-year growth 2025-2030 (%)
Data Table on Europe - Year-over-year growth 2025-2030 (%)
Chart on Regional Comparison - Europe
Data Table on Regional Comparison - Europe

12.4.1 Germany - Market size and forecast 2025-2030

Chart on Germany - Market size and forecast 2025-2030 ($ billion)
Data Table on Germany - Market size and forecast 2025-2030 ($ billion)
Chart on Germany - Year-over-year growth 2025-2030 (%)
Data Table on Germany - Year-over-year growth 2025-2030 (%)

12.4.2 UK - Market size and forecast 2025-2030

Chart on UK - Market size and forecast 2025-2030 ($ billion)
Data Table on UK - Market size and forecast 2025-2030 ($ billion)
Chart on UK - Year-over-year growth 2025-2030 (%)
Data Table on UK - Year-over-year growth 2025-2030 (%)

12.4.3 France - Market size and forecast 2025-2030

Chart on France - Market size and forecast 2025-2030 ($ billion)
Data Table on France - Market size and forecast 2025-2030 ($ billion)
Chart on France - Year-over-year growth 2025-2030 (%)
Data Table on France - Year-over-year growth 2025-2030 (%)

12.4.4 The Netherlands - Market size and forecast 2025-2030

Chart on The Netherlands - Market size and forecast 2025-2030 ($ billion)
Data Table on The Netherlands - Market size and forecast 2025-2030 ($ billion)
Chart on The Netherlands - Year-over-year growth 2025-2030 (%)
Data Table on The Netherlands - Year-over-year growth 2025-2030 (%)

12.4.5 Norway - Market size and forecast 2025-2030

Chart on Norway - Market size and forecast 2025-2030 ($ billion)
Data Table on Norway - Market size and forecast 2025-2030 ($ billion)
Chart on Norway - Year-over-year growth 2025-2030 (%)
Data Table on Norway - Year-over-year growth 2025-2030 (%)

12.4.6 Italy - Market size and forecast 2025-2030

Chart on Italy - Market size and forecast 2025-2030 ($ billion)
Data Table on Italy - Market size and forecast 2025-2030 ($ billion)
Chart on Italy - Year-over-year growth 2025-2030 (%)
Data Table on Italy - Year-over-year growth 2025-2030 (%)

12.5 North America - Market size and forecast 2025-2030

Chart on North America - Market size and forecast 2025-2030 ($ billion)
Data Table on North America - Market size and forecast 2025-2030 ($ billion)
Chart on North America - Year-over-year growth 2025-2030 (%)
Data Table on North America - Year-over-year growth 2025-2030 (%)
Chart on Regional Comparison - North America
Data Table on Regional Comparison - North America

12.5.1 US - Market size and forecast 2025-2030

Chart on US - Market size and forecast 2025-2030 ($ billion)
Data Table on US - Market size and forecast 2025-2030 ($ billion)
Chart on US - Year-over-year growth 2025-2030 (%)
Data Table on US - Year-over-year growth 2025-2030 (%)

12.5.2 Canada - Market size and forecast 2025-2030

Chart on Canada - Market size and forecast 2025-2030 ($ billion)
Data Table on Canada - Market size and forecast 2025-2030 ($ billion)
Chart on Canada - Year-over-year growth 2025-2030 (%)
Data Table on Canada - Year-over-year growth 2025-2030 (%)

12.5.3 Mexico - Market size and forecast 2025-2030

Chart on Mexico - Market size and forecast 2025-2030 ($ billion)
Data Table on Mexico - Market size and forecast 2025-2030 ($ billion)
Chart on Mexico - Year-over-year growth 2025-2030 (%)
Data Table on Mexico - Year-over-year growth 2025-2030 (%)

12.6 South America - Market size and forecast 2025-2030

Chart on South America - Market size and forecast 2025-2030 ($ billion)
Data Table on South America - Market size and forecast 2025-2030 ($ billion)
Chart on South America - Year-over-year growth 2025-2030 (%)
Data Table on South America - Year-over-year growth 2025-2030 (%)
Chart on Regional Comparison - South America
Data Table on Regional Comparison - South America

12.6.1 Brazil - Market size and forecast 2025-2030

Chart on Brazil - Market size and forecast 2025-2030 ($ billion)
Data Table on Brazil - Market size and forecast 2025-2030 ($ billion)
Chart on Brazil - Year-over-year growth 2025-2030 (%)
Data Table on Brazil - Year-over-year growth 2025-2030 (%)

12.6.2 Argentina - Market size and forecast 2025-2030

Chart on Argentina - Market size and forecast 2025-2030 ($ billion)
Data Table on Argentina - Market size and forecast 2025-2030 ($ billion)
Chart on Argentina - Year-over-year growth 2025-2030 (%)
Data Table on Argentina - Year-over-year growth 2025-2030 (%)

12.6.3 Chile - Market size and forecast 2025-2030

Chart on Chile - Market size and forecast 2025-2030 ($ billion)
Data Table on Chile - Market size and forecast 2025-2030 ($ billion)
Chart on Chile - Year-over-year growth 2025-2030 (%)
Data Table on Chile - Year-over-year growth 2025-2030 (%)

12.7 Middle East and Africa - Market size and forecast 2025-2030

Chart on Middle East and Africa - Market size and forecast 2025-2030 ($ billion)
Data Table on Middle East and Africa - Market size and forecast 2025-2030 ($ billion)
Chart on Middle East and Africa - Year-over-year growth 2025-2030 (%)
Data Table on Middle East and Africa - Year-over-year growth 2025-2030 (%)
Chart on Regional Comparison - Middle East and Africa
Data Table on Regional Comparison - Middle East and Africa

12.7.1 UAE - Market size and forecast 2025-2030

Chart on UAE - Market size and forecast 2025-2030 ($ billion)
Data Table on UAE - Market size and forecast 2025-2030 ($ billion)
Chart on UAE - Year-over-year growth 2025-2030 (%)
Data Table on UAE - Year-over-year growth 2025-2030 (%)

12.7.2 South Africa - Market size and forecast 2025-2030

Chart on South Africa - Market size and forecast 2025-2030 ($ billion)
Data Table on South Africa - Market size and forecast 2025-2030 ($ billion)
Chart on South Africa - Year-over-year growth 2025-2030 (%)
Data Table on South Africa - Year-over-year growth 2025-2030 (%)

12.7.3 Saudi Arabia - Market size and forecast 2025-2030

Chart on Saudi Arabia - Market size and forecast 2025-2030 ($ billion)
Data Table on Saudi Arabia - Market size and forecast 2025-2030 ($ billion)
Chart on Saudi Arabia - Year-over-year growth 2025-2030 (%)
Data Table on Saudi Arabia - Year-over-year growth 2025-2030 (%)

12.7.4 Egypt - Market size and forecast 2025-2030

Chart on Egypt - Market size and forecast 2025-2030 ($ billion)
Data Table on Egypt - Market size and forecast 2025-2030 ($ billion)
Chart on Egypt - Year-over-year growth 2025-2030 (%)
Data Table on Egypt - Year-over-year growth 2025-2030 (%)

12.7.5 Kenya - Market size and forecast 2025-2030

Chart on Kenya - Market size and forecast 2025-2030 ($ billion)
Data Table on Kenya - Market size and forecast 2025-2030 ($ billion)
Chart on Kenya - Year-over-year growth 2025-2030 (%)
Data Table on Kenya - Year-over-year growth 2025-2030 (%)

12.8 Market opportunity by geography

Market opportunity by geography ($ billion)
Data Tables on Market opportunity by geography ($ billion)

13. Drivers, Challenges, and Opportunity

13.1 Market drivers

Stringent government policies, regulations, and financial incentives
Advancements in battery technology and declining costs
Growing environmental consciousness and evolving consumer preferences

13.2 Market challenges

Inadequate charging infrastructure and grid strain
High initial purchase price and total cost of ownership ambiguity
Supply chain constraints and raw material volatility

13.3 Impact of drivers and challenges

Impact of drivers and challenges in 2025 and 2030

13.4 Market opportunities

Proliferation and diversification of electric vehicle models
Deepening integration of connectivity, software, and autonomous driving technologies
Development of integrated ecosystems encompassing charging and energy services

14. Competitive Landscape

14.1 Overview

14.2

Overview on criticality of inputs and factors of differentiation

14.3 Landscape disruption

Overview on factors of disruption

14.4 Industry risks

Impact of key risks on business

15. Competitive Analysis

15.1 Companies profiled

Companies covered

15.2 Company ranking index

15.3 Market positioning of companies

Matrix on companies position and classification

15.4 Bayerische Motoren Werke AG

Bayerische Motoren Werke AG - Overview
Bayerische Motoren Werke AG - Business segments
Bayerische Motoren Werke AG - Key offerings
Bayerische Motoren Werke AG - Segment focus
SWOT

15.5 BYD Co. Ltd.

BYD Co. Ltd. - Overview
BYD Co. Ltd. - Business segments
BYD Co. Ltd. - Key news
BYD Co. Ltd. - Key offerings
BYD Co. Ltd. - Segment focus
SWOT

15.6 Ford Motor Co.

Ford Motor Co. - Overview
Ford Motor Co. - Business segments
Ford Motor Co. - Key offerings
Ford Motor Co. - Segment focus
SWOT

15.7 Geely Auto

Geely Auto - Overview
Geely Auto - Product / Service
Geely Auto - Key offerings
SWOT

15.8 General Motors Co.

General Motors Co. - Overview
General Motors Co. - Business segments
General Motors Co. - Key news
General Motors Co. - Key offerings
General Motors Co. - Segment focus
SWOT

15.9 Honda Motor Co. Ltd.

Honda Motor Co. Ltd. - Overview
Honda Motor Co. Ltd. - Business segments
Honda Motor Co. Ltd. - Key news
Honda Motor Co. Ltd. - Key offerings
Honda Motor Co. Ltd. - Segment focus
SWOT

15.10 Hyundai Motor Co.

Hyundai Motor Co. - Overview
Hyundai Motor Co. - Business segments
Hyundai Motor Co. - Key news
Hyundai Motor Co. - Key offerings
Hyundai Motor Co. - Segment focus
SWOT

15.11 Mercedes Benz Group AG

Mercedes Benz Group AG - Overview
Mercedes Benz Group AG - Product / Service
Mercedes Benz Group AG - Key offerings
SWOT

15.12 Nissan Motor Co. Ltd.

Nissan Motor Co. Ltd. - Overview
Nissan Motor Co. Ltd. - Business segments
Nissan Motor Co. Ltd. - Key news
Nissan Motor Co. Ltd. - Key offerings
Nissan Motor Co. Ltd. - Segment focus
SWOT

15.13 Renault SAS

Renault SAS - Overview
Renault SAS - Product / Service
Renault SAS - Key offerings
SWOT

15.14 SAIC Motor Corp. Ltd.

SAIC Motor Corp. Ltd. - Overview
SAIC Motor Corp. Ltd. - Business segments
SAIC Motor Corp. Ltd. - Key offerings
SAIC Motor Corp. Ltd. - Segment focus
SWOT

15.15 Stellantis NV

Stellantis NV - Overview
Stellantis NV - Business segments
Stellantis NV - Key news
Stellantis NV - Key offerings
Stellantis NV - Segment focus
SWOT

15.16 Tesla Inc.

Tesla Inc. - Overview
Tesla Inc. - Business segments
Tesla Inc. - Key news
Tesla Inc. - Key offerings
Tesla Inc. - Segment focus
SWOT

15.17 Toyota Motor Corp.

Toyota Motor Corp. - Overview
Toyota Motor Corp. - Business segments
Toyota Motor Corp. - Key news
Toyota Motor Corp. - Key offerings
Toyota Motor Corp. - Segment focus
SWOT

15.18 Volkswagen AG

Volkswagen AG - Overview
Volkswagen AG - Business segments
Volkswagen AG - Key news
Volkswagen AG - Key offerings
Volkswagen AG - Segment focus
SWOT

16. Appendix

16.1 Scope of the report

Market definition
Objectives
Notes and caveats

16.2 Inclusions and exclusions checklist

Inclusions checklist
Exclusions checklist

16.3 Currency conversion rates for US$

16.4 Research methodology

16.5 Data procurement

Information sources

16.6 Data validation

16.7 Validation techniques employed for market sizing

16.8 Data synthesis

16.9 360 degree market analysis

16.10 List of abbreviations

Research Methodology

Technavio presents a detailed picture of the market by way of study, synthesis, and summation of data from multiple sources. The analysts have presented the various facets of the market with a particular focus on identifying the key industry influencers. The data thus presented is comprehensive, reliable, and the result of extensive research, both primary and secondary.

INFORMATION SOURCES

Primary sources

  • Manufacturers and suppliers
  • Channel partners
  • Industry experts
  • Strategic decision makers

Secondary sources

  • Industry journals and periodicals
  • Government data
  • Financial reports of key industry players
  • Historical data
  • Press releases

DATA ANALYSIS

Data Synthesis

  • Collation of data
  • Estimation of key figures
  • Analysis of derived insights

Data Validation

  • Triangulation with data models
  • Reference against proprietary databases
  • Corroboration with industry experts

REPORT WRITING

Qualitative

  • Market drivers
  • Market challenges
  • Market trends
  • Five forces analysis

Quantitative

  • Market size and forecast
  • Market segmentation
  • Geographical insights
  • Competitive landscape

Interested in this report?

Get your sample now to see our research methodology and insights!

Download Now

Frequently Asked Questions

Electric Vehicle (EV) market growth will increase by USD 521.4 billion during 2026-2030.

The Electric Vehicle (EV) market is expected to grow at a CAGR of 16.7% during 2026-2030.

Electric Vehicle (EV) market is segmented by Type (BEV, PHEV) Charging (Normal charging, Super charging) Vehicle type (Passenger cars, Two wheelers, Commercial vehicles)

Bayerische Motoren Werke AG, BYD Co. Ltd., Chery Automobile Co. Ltd., Chongqing Changan Auto. Ltd., Dongfeng Motor Corporation Ltd, Ford Motor Co., GAC GROUP, Geely Auto, General Motors Co., Honda Motor Co. Ltd., Hyundai Motor Co., Mahindra and Mahindra Ltd., Mercedes Benz Group AG, Nissan Motor Co. Ltd., Renault SAS, SAIC Motor Corp. Ltd., Stellantis NV, Tesla Inc., Toyota Motor Corp., Volkswagen AG are a few of the key vendors in the Electric Vehicle (EV) market.

APAC will register the highest growth rate of 48.7% among the other regions. Therefore, the Electric Vehicle (EV) market in APAC is expected to garner significant business opportunities for the vendors during the forecast period.

China, Japan, India, South Korea, Australia, Indonesia, Germany, UK, France, The Netherlands, Norway, Italy, US, Canada, Mexico, Brazil, Argentina, Chile, UAE, South Africa, Saudi Arabia, Egypt, Kenya

  • Stringent government policies, regulations, and financial incentives is the driving factor this market.

The Electric Vehicle (EV) market vendors should focus on grabbing business opportunities from the Type segment as it accounted for the largest market share in the base year.
RIA - Research AI Assistant
Ask RIA