Membrane Market Analysis, Size, and Forecast 2026-2030: APAC (China, Japan, and India), North America (US, Canada, and Mexico), Europe (Germany, UK, and France), Middle East and Africa (Saudi Arabia, UAE, and South Africa), South America (Brazil and Argentina), and Rest of World (ROW)

Membrane Market Analysis, Size, and Forecast 2026-2030:
APAC (China, Japan, and India), North America (US, Canada, and Mexico), Europe (Germany, UK, and France), Middle East and Africa (Saudi Arabia, UAE, and South Africa), South America (Brazil and Argentina), and Rest of World (ROW)

Published: Apr 2026 323 Pages SKU: IRTNTR70332

Market Overview at a Glance

$1.75 B
Market Opportunity
4.6%
CAGR 2025 - 2030
38.5%
APAC Growth
$2.25 B
Wastewater treatment segment 2024

Membrane Market Size 2026-2030

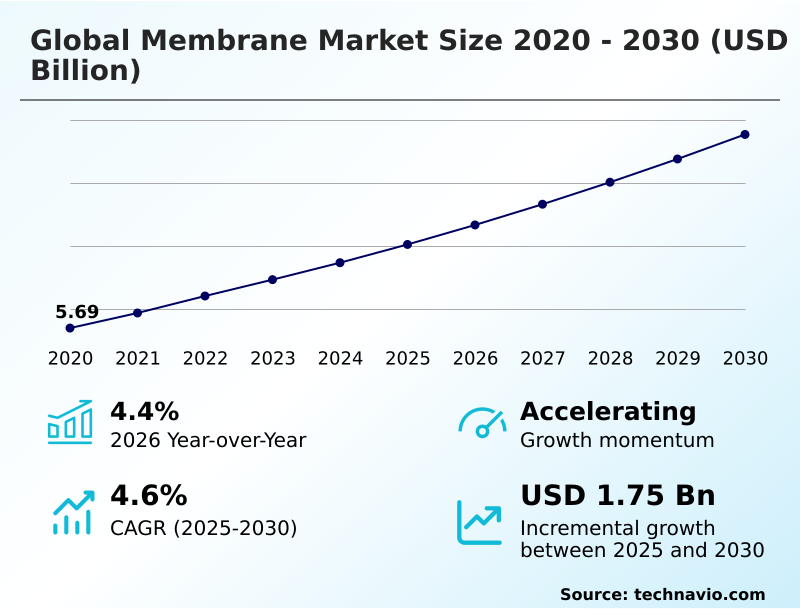
The membrane market size is valued to increase by USD 1.75 billion, at a CAGR of 4.6% from 2025 to 2030. Growing demand for freshwater and desalination solutions will drive the membrane market.

Major Market Trends & Insights

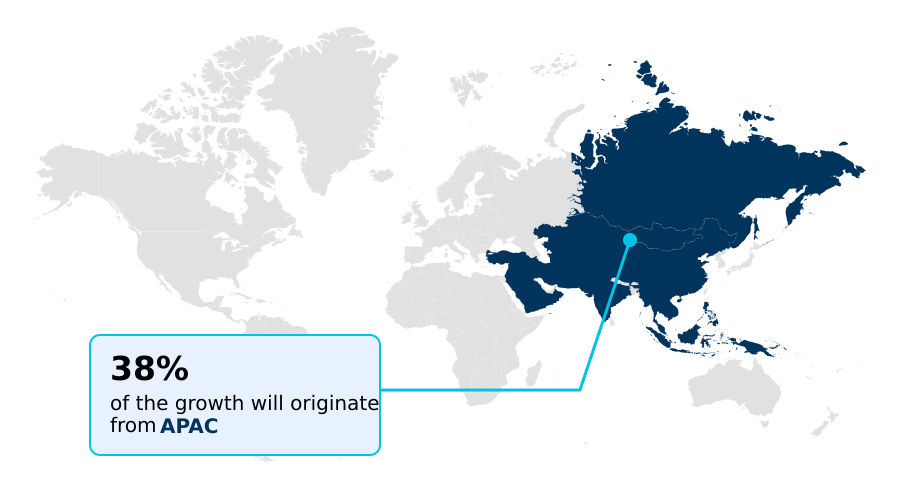
  • APAC dominated the market and accounted for a 38.5% growth during the forecast period.
  • By Application - Wastewater treatment segment was valued at USD 2.25 billion in 2024
  • By Technology - RO segment accounted for the largest market revenue share in 2024

Market Size & Forecast

  • Market Opportunities: USD 3.08 billion
  • Market Future Opportunities: USD 1.75 billion
  • CAGR from 2025 to 2030 : 4.6%

Market Summary

  • The membrane market is defined by the critical need for advanced separation technologies to address global water scarcity and industrial purity requirements. Key drivers include stringent environmental regulations compelling industries to adopt high-efficiency filtration, and the rapid industrialization in emerging economies demanding precise process control.
  • A primary trend is the integration of AI and IoT for smart water management, enabling predictive maintenance that mitigates issues like membrane fouling and reduces operational costs. For instance, a municipal desalination plant can leverage digital twin simulation to optimize transmembrane pressure and cleaning cycles, extending the lifespan of reverse osmosis modules and ensuring a consistent supply of potable water.
  • However, the market grapples with challenges such as the high capital cost of durable materials like ceramic membranes and the environmental impact of disposing of spent polymeric modules. Innovations in bio-based polymers and recycling strategies are crucial for sustainable, long-term growth and ensuring a circular economy for these essential components.

What will be the Size of the Membrane Market during the forecast period?

Get Key Insights on Market Forecast (PDF) Request Free Sample

How is the Membrane Market Segmented?

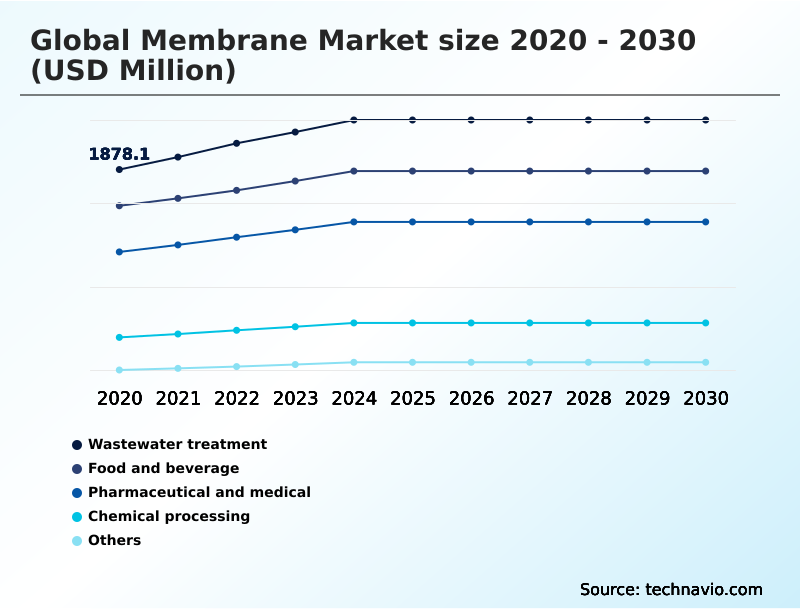
The membrane industry research report provides comprehensive data (region-wise segment analysis), with forecasts and estimates in "USD million" for the period 2026-2030, as well as historical data from 2020-2024 for the following segments.

  • Application
    • Wastewater treatment
    • Food and beverage
    • Pharmaceutical and medical
    • Chemical processing
    • Others
  • Technology
    • RO
    • Microfiltration
    • Ultrafiltration
    • Pervaporation
    • Others
  • Material
    • Polymeric
    • Ceramic
  • Geography
    • APAC
      • China
      • Japan
      • India
    • North America
      • US
      • Canada
      • Mexico
    • Europe
      • Germany
      • UK
      • France
    • Middle East and Africa
      • Saudi Arabia
      • UAE
      • South Africa
    • South America
      • Brazil
      • Argentina
    • Rest of World (ROW)

By Application Insights

The wastewater treatment segment is estimated to witness significant growth during the forecast period.

Wastewater treatment is the leading application, driven by strict environmental mandates and the need for water reclamation. This segment extensively uses membrane bioreactors and sterile filtration to meet effluent quality standards for municipal water supply and industrial wastewater treatment.

Advanced polymeric membranes are critical for achieving zero liquid discharge in sectors like chemical processing separation.

The adoption of smart water management, using predictive maintenance analytics, has improved operational uptime, with some facilities reporting a reduction in unplanned downtime by over 15%.

The focus on circular water management propels the use of reverse osmosis and ultrafiltration for producing high-purity water, reinforcing the importance of advanced materials science in developing high-flux membrane materials and supporting water security infrastructure.

Request Free Sample

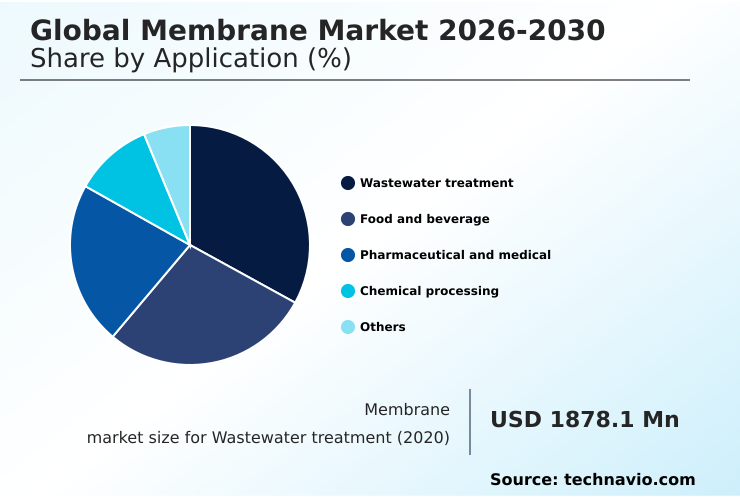
The Wastewater treatment segment was valued at USD 2.25 billion in 2024 and showed a gradual increase during the forecast period.

Request Free Sample

Regional Analysis

APAC is estimated to contribute 38.5% to the growth of the global market during the forecast period.Technavio’s analysts have elaborately explained the regional trends and drivers that shape the market during the forecast period.

See How Membrane Market Demand is Rising in APAC Request Free Sample

The geographic landscape is led by APAC, which accounts for 38.5% of the market opportunity, driven by industrial wastewater treatment and municipal water supply needs.

In contrast, North America holds a 24.9% share, focusing on produced water treatment and pharmaceutical manufacturing. Innovations in fouling-resistant coatings are critical in both regions, with some applications seeing a 20% longer operational life between cleaning cycles.

The adoption of decentralized water solutions and modular treatment units is accelerating globally to address localized water stress.

This strategic shift toward resource recovery from waste supports circular water management goals, with advancements in selective permeation and end-of-life membrane management becoming key differentiators for market players across diverse regional regulatory frameworks.

Market Dynamics

Our researchers analyzed the data with 2025 as the base year, along with the key drivers, trends, and challenges. A holistic analysis of drivers will help companies refine their marketing strategies to gain a competitive advantage.

  • Strategic decision-making in the membrane market increasingly hinges on detailed technical evaluations. For instance, ceramic vs polymeric membrane performance is a critical consideration, with ceramic systems often providing a service life more than double that of polymeric counterparts in high-temperature industrial processes. Key initiatives focus on reverse osmosis energy consumption reduction and developing solvent-resistant nanofiltration for pharmaceuticals.
  • The effectiveness of a membrane bioreactor for municipal sewage depends on fouling mitigation in spiral-wound membranes and the efficiency of the hollow fiber module for sterile filtration. In the food sector, ultrafiltration in dairy protein concentration is standard, while pervaporation for azeotropic mixture separation offers an energy-efficient alternative to distillation.
  • The viability of a thin-film composite for seawater desalination is measured by its salt rejection and durability. Simultaneously, achieving zero liquid discharge in the chemical industry is a primary goal. The growth of the green hydrogen economy is driving demand for specific membrane systems for green hydrogen production. Nanofiltration for water softening applications remains a key municipal strategy.
  • A comprehensive life-cycle assessment of membrane modules, including the use of bio-based polymers for sustainable membranes, is now integral to procurement.
  • Other areas of development include smart sensors for predictive membrane maintenance, gas separation membranes for carbon capture, electrodeionization for ultrapure water polishing, membrane contactors for dissolved gas control, and high-rejection membranes for contaminant removal, all of which are factored into a cost analysis of decentralized water treatment.

What are the key market drivers leading to the rise in the adoption of Membrane Industry?

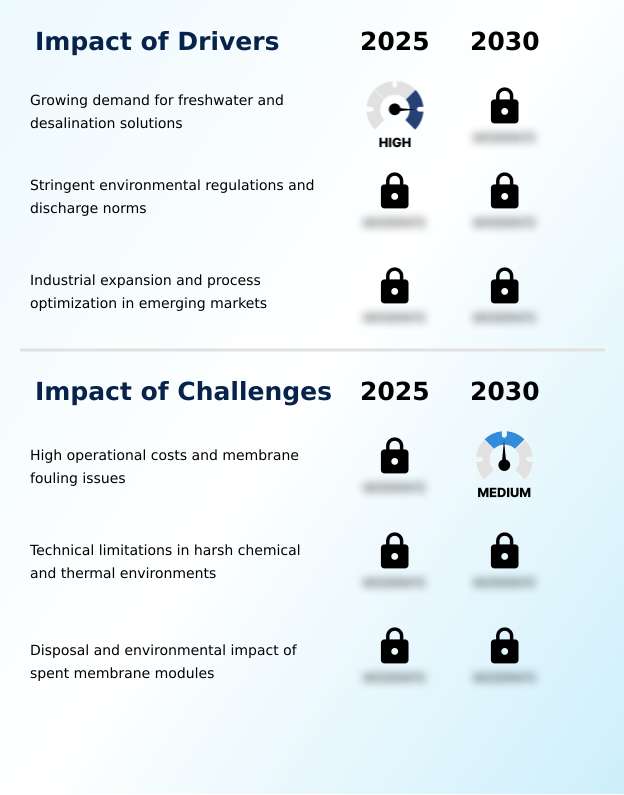
  • The growing demand for freshwater and desalination solutions stands as a key driver for the market.

  • Market growth is primarily driven by mounting pressure for regulatory compliance filtration and the global need for enhanced water security infrastructure.
  • Stringent effluent quality standards are compelling industries to adopt technologies that ensure minimal liquid discharge, with advanced filtration systems enabling over 95% of companies in regulated sectors to meet new mandates.
  • The expansion of high-tech industries, such as semiconductor manufacturing, fuels demand for high-purity water production, where filtration must remove impurities to parts-per-billion levels.
  • Additionally, industrial process optimization relies on membranes for catalyst and solvent recovery, which can improve yield by 5% to 7%.
  • The increasing adoption of these technologies underscores a broader shift toward resource efficiency and environmental stewardship across all major industrial sectors.

What are the market trends shaping the Membrane Industry?

  • The integration of digitalization and artificial intelligence into membrane systems is emerging as a transformative market trend, enhancing operational efficiency and predictive maintenance.

  • Key trends are reshaping the market, with a strong focus on sustainability and efficiency. The move toward a sustainable membrane life-cycle is compelling innovation in biocompatible materials and bio-based polymeric membranes, with pilot programs demonstrating that up to 30% of certain spent modules can be repurposed.
  • Digitalization is another major trend, where predictive maintenance analytics and digital twin simulation enable operators to anticipate fouling events, reducing chemical usage by 15% and extending component life. Furthermore, the proliferation of modular treatment units and decentralized water solutions supports rapid deployment in remote or expanding industrial parks, enhancing agility.
  • This shift toward smart water management and organophilic membrane technologies underpins the industry's evolution toward more resilient and cost-effective operations.

What challenges does the Membrane Industry face during its growth?

  • High operational costs associated with membrane fouling present a key challenge affecting the industry's growth.

  • Significant challenges constrain market potential, led by issues of membrane fouling and high operational expenditures. Persistent fouling can reduce permeate flux by up to 50%, necessitating energy-intensive cleaning cycles and increasing total cost of ownership. The technical limitations of standard polymeric membranes in harsh chemical and thermal environments restrict their use, creating a demand for more robust but costly alternatives.
  • Furthermore, end-of-life membrane management presents a growing environmental concern, as less than 5% of spent modules are currently recycled, posing a conflict with circular economy goals. Addressing these hurdles through advanced materials science and developing cost-effective, fouling-resistant coatings are critical for future market expansion and sustainability.

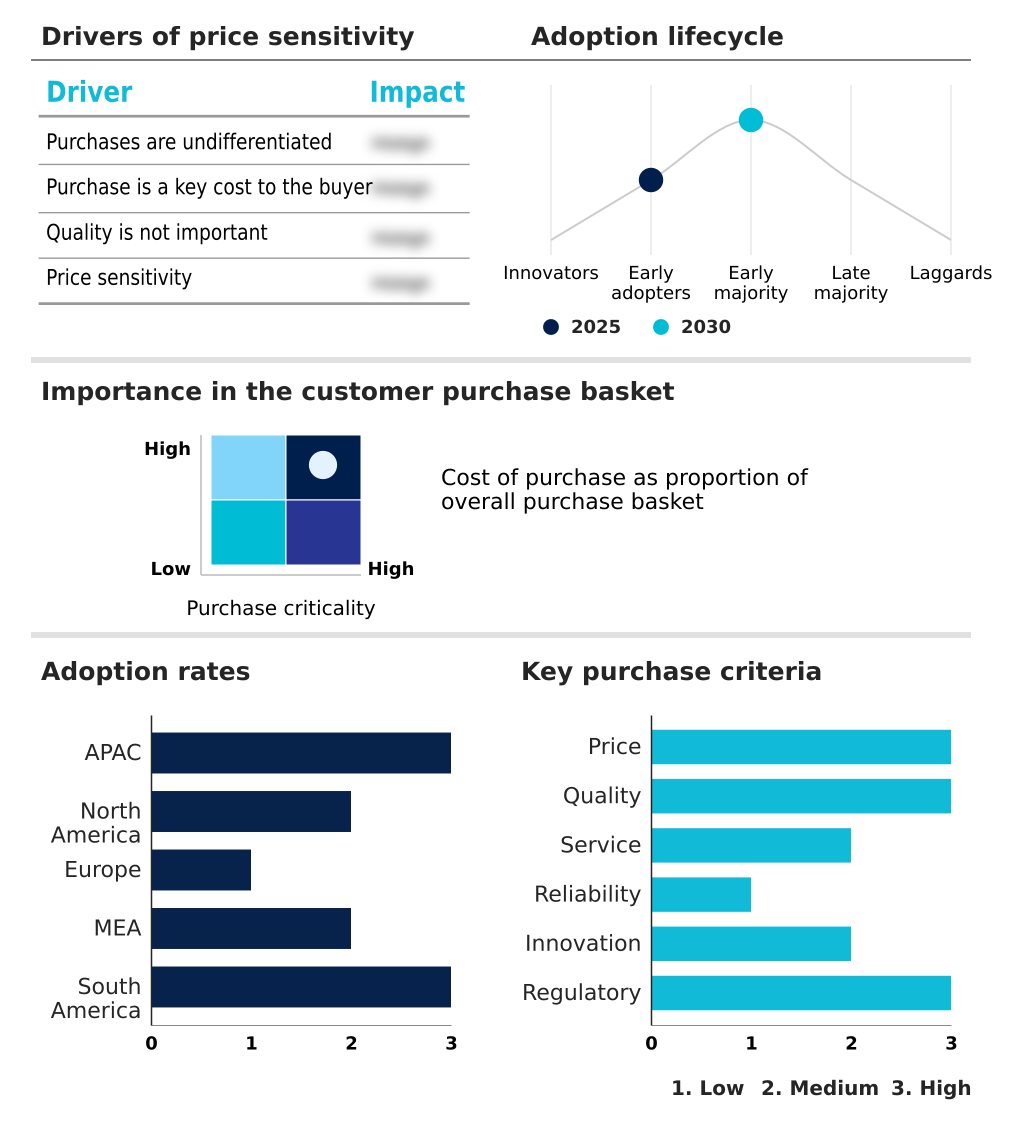
Exclusive Technavio Analysis on Customer Landscape

The membrane market forecasting report includes the adoption lifecycle of the market, covering from the innovator’s stage to the laggard’s stage. It focuses on adoption rates in different regions based on penetration. Furthermore, the membrane market report also includes key purchase criteria and drivers of price sensitivity to help companies evaluate and develop their market growth analysis strategies.

Customer Landscape of Membrane Industry

Competitive Landscape

Companies are implementing various strategies, such as strategic alliances, membrane market forecast, partnerships, mergers and acquisitions, geographical expansion, and product/service launches, to enhance their presence in the industry.

3M Co. - Key offerings include specialized membrane technologies crucial for wastewater reuse, desalination, and critical water treatment applications that meet stringent global purity standards.

The industry research and growth report includes detailed analyses of the competitive landscape of the market and information about key companies, including:

  • 3M Co.
  • Alfa Laval AB
  • Asahi Kasei Corp.
  • DuPont de Nemours Inc.
  • GEA Group AG
  • Kubota Corp.
  • LG Chem Ltd.
  • MANN HUMMEL International GmbH
  • Nitto Denko Corp.
  • OriginWater Membrane Technology
  • Pall Corp.
  • Parker Hannifin Corp.
  • Pentair Plc
  • Scinor Water America LLC
  • Synder Filtration Inc.
  • Thermo Fisher Scientific Inc.
  • Toray Industries Inc.
  • Toyobo Co. Ltd.
  • Veolia Environment SA
  • Xylem Inc.

Qualitative and quantitative analysis of companies has been conducted to help clients understand the wider business environment as well as the strengths and weaknesses of key industry players. Data is qualitatively analyzed to categorize companies as pure play, category-focused, industry-focused, and diversified; it is quantitatively analyzed to categorize companies as dominant, leading, strong, tentative, and weak.

Recent Development and News in Membrane market

  • In September 2024, Pall Corp. introduced the Membralox GP-IC ceramic membrane system, incorporating a graduated permeability design to improve filtration efficiency and recovery rates in food and beverage processing.
  • In November 2024, Parker Hannifin announced a definitive agreement to acquire Filtration Group Corp. for approximately $9.25 billion, significantly expanding its filtration capabilities and aftermarket business in key growth markets.
  • In March 2025, Alfa Laval joined a three-year research initiative focused on membrane filtration for resource recovery from sewage sludge, contributing its expertise in separation technologies to advance sustainable water solutions.
  • In May 2025, Veolia secured over $750 million in new contracts for water technologies, including a major agreement to design, build, and operate a state-of-the-art water treatment facility for a semiconductor manufacturing plant.

Dive into Technavio’s robust research methodology, blending expert interviews, extensive data synthesis, and validated models for unparalleled Membrane Market insights. See full methodology.

Market Scope
Page number 323
Base year 2025
Historic period 2020-2024
Forecast period 2026-2030
Growth momentum & CAGR Accelerate at a CAGR of 4.6%
Market growth 2026-2030 USD 1750.8 million
Market structure Fragmented
YoY growth 2025-2026(%) 4.4%
Key countries China, Japan, India, South Korea, Australia, Indonesia, US, Canada, Mexico, Germany, UK, France, Italy, Spain, The Netherlands, Saudi Arabia, UAE, South Africa, Israel, Turkey, Brazil, Argentina and Chile
Competitive landscape Leading Companies, Market Positioning of Companies, Competitive Strategies, and Industry Risks

Request Free Sample

Research Analyst Overview

  • The membrane market is sustained by the continuous need for high-purity separation across industries. Innovations in advanced materials like thin-film composites and ceramic membranes are central to enhancing performance metrics such as permeate flux and chemical resistance, which are crucial for demanding applications in desalination and wastewater treatment.
  • The operational challenge of membrane fouling is being addressed through advancements in graduated permeability design and specialized polymeric membranes, including polyethersulfone and polyvinylidene fluoride. Boardroom decisions are increasingly influenced by the total cost of ownership, where technologies like electrodeionization and membrane contactors offer long-term value despite higher initial capital.
  • For example, deploying advanced oxidation processes as a pretreatment can reduce chemical cleaning requirements by up to 30%, directly impacting operational budgets. The market is also expanding into niche areas with bio-based polymeric membranes, gas separation, proton exchange membrane for energy, and sanitary reverse osmosis for food-grade applications.
  • Technologies like reverse osmosis, microfiltration, ultrafiltration, pervaporation, and nanofiltration, configured in hollow fiber membranes or spiral-wound membranes, are fundamental. The move toward zero liquid discharge and solvent recovery, coupled with the need for sterile filtration and hemodialysis membranes, underscores the technology's versatility and essential role in modern industry.

What are the Key Data Covered in this Membrane Market Research and Growth Report?

  • What is the expected growth of the Membrane Market between 2026 and 2030?

    • USD 1.75 billion, at a CAGR of 4.6%

  • What segmentation does the market report cover?

    • The report is segmented by Application (Wastewater treatment, Food and beverage, Pharmaceutical and medical, Chemical processing, and Others), Technology (RO, Microfiltration, Ultrafiltration, Pervaporation, and Others), Material (Polymeric, and Ceramic) and Geography (APAC, North America, Europe, Middle East and Africa, South America)

  • Which regions are analyzed in the report?

    • APAC, North America, Europe, Middle East and Africa and South America

  • What are the key growth drivers and market challenges?

    • Growing demand for freshwater and desalination solutions, High operational costs and membrane fouling issues

  • Who are the major players in the Membrane Market?

    • 3M Co., Alfa Laval AB, Asahi Kasei Corp., DuPont de Nemours Inc., GEA Group AG, Kubota Corp., LG Chem Ltd., MANN HUMMEL International GmbH, Nitto Denko Corp., OriginWater Membrane Technology, Pall Corp., Parker Hannifin Corp., Pentair Plc, Scinor Water America LLC, Synder Filtration Inc., Thermo Fisher Scientific Inc., Toray Industries Inc., Toyobo Co. Ltd., Veolia Environment SA and Xylem Inc.

Market Research Insights

  • Market dynamics are shaped by an intense focus on process optimization and regulatory compliance filtration. The adoption of energy-efficient separation techniques is critical, with facilities achieving up to a 10% reduction in energy use by upgrading to modern thin-film composites. Demand for brackish water purification is growing faster than that for traditional freshwater sources, especially in arid regions.
  • The shift toward modular treatment units reflects a strategic move for operational flexibility, with deployment times for decentralized water solutions being 40% faster than for large-scale centralized plants.
  • Sustainable membrane life-cycle management and catalyst and solvent recovery are becoming central to corporate strategy, driven by both cost savings and environmental stewardship, while the need for high-purity water production continues to expand in high-tech manufacturing sectors.

We can help! Our analysts can customize this membrane market research report to meet your requirements.

Get in touch

1. Executive Summary

1.1 Market overview

Executive Summary - Chart on Market Overview
Executive Summary - Data Table on Market Overview
Executive Summary - Chart on Global Market Characteristics
Executive Summary - Chart on Market by Geography
Executive Summary - Chart on Market Segmentation by Application
Executive Summary - Chart on Market Segmentation by Technology
Executive Summary - Chart on Market Segmentation by Material
Executive Summary - Chart on Incremental Growth
Executive Summary - Data Table on Incremental Growth
Executive Summary - Chart on Company Market Positioning

2. Technavio Analysis

2.1 Analysis of price sensitivity, lifecycle, customer purchase basket, adoption rates, and purchase criteria

2.2 Criticality of inputs and Factors of differentiation

Chart on Overview on criticality of inputs and factors of differentiation

2.3 Factors of disruption

Chart on Overview on factors of disruption

2.4 Impact of drivers and challenges

Chart on Impact of drivers and challenges in 2025 and 2030

3. Market Landscape

3.1 Market ecosystem

Chart on Parent Market
Data Table on - Parent Market

3.2 Market characteristics

Chart on Market characteristics analysis

3.3 Value chain analysis

Chart on Value chain analysis

4. Market Sizing

4.1 Market definition

Data Table on Offerings of companies included in the market definition

4.2 Market segment analysis

Market segments

4.3 Market size 2025

4.4 Market outlook: Forecast for 2025-2030

Chart on Global - Market size and forecast 2025-2030 ($ million)
Data Table on Global - Market size and forecast 2025-2030 ($ million)
Chart on Global Market: Year-over-year growth 2025-2030 (%)
Data Table on Global Market: Year-over-year growth 2025-2030 (%)

5. Historic Market Size

5.1 Global Membrane Market 2020 - 2024

Historic Market Size - Data Table on Global Membrane Market 2020 - 2024 ($ million)

5.2 Application segment analysis 2020 - 2024

Historic Market Size - Application Segment 2020 - 2024 ($ million)

5.3 Technology segment analysis 2020 - 2024

Historic Market Size - Technology Segment 2020 - 2024 ($ million)

5.4 Material segment analysis 2020 - 2024

Historic Market Size - Material Segment 2020 - 2024 ($ million)

5.5 Geography segment analysis 2020 - 2024

Historic Market Size - Geography Segment 2020 - 2024 ($ million)

5.6 Country segment analysis 2020 - 2024

Historic Market Size - Country Segment 2020 - 2024 ($ million)

6. Qualitative Analysis

6.1 Impact of AI in Global Membrane Market

6.2 Impact of Geopolitical Conflict in Global Membrane Market

7. Five Forces Analysis

7.1 Five forces summary

Five forces analysis - Comparison between 2025 and 2030

7.2 Bargaining power of buyers

Bargaining power of buyers - Impact of key factors 2025 and 2030

7.3 Bargaining power of suppliers

Bargaining power of suppliers - Impact of key factors in 2025 and 2030

7.4 Threat of new entrants

Threat of new entrants - Impact of key factors in 2025 and 2030

7.5 Threat of substitutes

Threat of substitutes - Impact of key factors in 2025 and 2030

7.6 Threat of rivalry

Threat of rivalry - Impact of key factors in 2025 and 2030

7.7 Market condition

Chart on Market condition - Five forces 2025 and 2030

8. Market Segmentation by Application

8.1 Market segments

Chart on Application - Market share 2025-2030 (%)
Data Table on Application - Market share 2025-2030 (%)

8.2 Comparison by Application

Chart on Comparison by Application
Data Table on Comparison by Application

8.3 Wastewater treatment - Market size and forecast 2025-2030

Chart on Wastewater treatment - Market size and forecast 2025-2030 ($ million)
Data Table on Wastewater treatment - Market size and forecast 2025-2030 ($ million)
Chart on Wastewater treatment - Year-over-year growth 2025-2030 (%)
Data Table on Wastewater treatment - Year-over-year growth 2025-2030 (%)

8.4 Food and beverage - Market size and forecast 2025-2030

Chart on Food and beverage - Market size and forecast 2025-2030 ($ million)
Data Table on Food and beverage - Market size and forecast 2025-2030 ($ million)
Chart on Food and beverage - Year-over-year growth 2025-2030 (%)
Data Table on Food and beverage - Year-over-year growth 2025-2030 (%)

8.5 Pharmaceutical and medical - Market size and forecast 2025-2030

Chart on Pharmaceutical and medical - Market size and forecast 2025-2030 ($ million)
Data Table on Pharmaceutical and medical - Market size and forecast 2025-2030 ($ million)
Chart on Pharmaceutical and medical - Year-over-year growth 2025-2030 (%)
Data Table on Pharmaceutical and medical - Year-over-year growth 2025-2030 (%)

8.6 Chemical processing - Market size and forecast 2025-2030

Chart on Chemical processing - Market size and forecast 2025-2030 ($ million)
Data Table on Chemical processing - Market size and forecast 2025-2030 ($ million)
Chart on Chemical processing - Year-over-year growth 2025-2030 (%)
Data Table on Chemical processing - Year-over-year growth 2025-2030 (%)

8.7 Others - Market size and forecast 2025-2030

Chart on Others - Market size and forecast 2025-2030 ($ million)
Data Table on Others - Market size and forecast 2025-2030 ($ million)
Chart on Others - Year-over-year growth 2025-2030 (%)
Data Table on Others - Year-over-year growth 2025-2030 (%)

8.8 Market opportunity by Application

Market opportunity by Application ($ million)
Data Table on Market opportunity by Application ($ million)

9. Market Segmentation by Technology

9.1 Market segments

Chart on Technology - Market share 2025-2030 (%)
Data Table on Technology - Market share 2025-2030 (%)

9.2 Comparison by Technology

Chart on Comparison by Technology
Data Table on Comparison by Technology

9.3 RO - Market size and forecast 2025-2030

Chart on RO - Market size and forecast 2025-2030 ($ million)
Data Table on RO - Market size and forecast 2025-2030 ($ million)
Chart on RO - Year-over-year growth 2025-2030 (%)
Data Table on RO - Year-over-year growth 2025-2030 (%)

9.4 Microfiltration - Market size and forecast 2025-2030

Chart on Microfiltration - Market size and forecast 2025-2030 ($ million)
Data Table on Microfiltration - Market size and forecast 2025-2030 ($ million)
Chart on Microfiltration - Year-over-year growth 2025-2030 (%)
Data Table on Microfiltration - Year-over-year growth 2025-2030 (%)

9.5 Ultrafiltration - Market size and forecast 2025-2030

Chart on Ultrafiltration - Market size and forecast 2025-2030 ($ million)
Data Table on Ultrafiltration - Market size and forecast 2025-2030 ($ million)
Chart on Ultrafiltration - Year-over-year growth 2025-2030 (%)
Data Table on Ultrafiltration - Year-over-year growth 2025-2030 (%)

9.6 Pervaporation - Market size and forecast 2025-2030

Chart on Pervaporation - Market size and forecast 2025-2030 ($ million)
Data Table on Pervaporation - Market size and forecast 2025-2030 ($ million)
Chart on Pervaporation - Year-over-year growth 2025-2030 (%)
Data Table on Pervaporation - Year-over-year growth 2025-2030 (%)

9.7 Others - Market size and forecast 2025-2030

Chart on Others - Market size and forecast 2025-2030 ($ million)
Data Table on Others - Market size and forecast 2025-2030 ($ million)
Chart on Others - Year-over-year growth 2025-2030 (%)
Data Table on Others - Year-over-year growth 2025-2030 (%)

9.8 Market opportunity by Technology

Market opportunity by Technology ($ million)
Data Table on Market opportunity by Technology ($ million)

10. Market Segmentation by Material

10.1 Market segments

Chart on Material - Market share 2025-2030 (%)
Data Table on Material - Market share 2025-2030 (%)

10.2 Comparison by Material

Chart on Comparison by Material
Data Table on Comparison by Material

10.3 Polymeric - Market size and forecast 2025-2030

Chart on Polymeric - Market size and forecast 2025-2030 ($ million)
Data Table on Polymeric - Market size and forecast 2025-2030 ($ million)
Chart on Polymeric - Year-over-year growth 2025-2030 (%)
Data Table on Polymeric - Year-over-year growth 2025-2030 (%)

10.4 Ceramic - Market size and forecast 2025-2030

Chart on Ceramic - Market size and forecast 2025-2030 ($ million)
Data Table on Ceramic - Market size and forecast 2025-2030 ($ million)
Chart on Ceramic - Year-over-year growth 2025-2030 (%)
Data Table on Ceramic - Year-over-year growth 2025-2030 (%)

10.5 Market opportunity by Material

Market opportunity by Material ($ million)
Data Table on Market opportunity by Material ($ million)

11. Customer Landscape

11.1 Customer landscape overview

Analysis of price sensitivity, lifecycle, customer purchase basket, adoption rates, and purchase criteria

12. Geographic Landscape

12.1 Geographic segmentation

Chart on Market share by geography 2025-2030 (%)
Data Table on Market share by geography 2025-2030 (%)

12.2 Geographic comparison

Chart on Geographic comparison
Data Table on Geographic comparison

12.3 APAC - Market size and forecast 2025-2030

Chart on APAC - Market size and forecast 2025-2030 ($ million)
Data Table on APAC - Market size and forecast 2025-2030 ($ million)
Chart on APAC - Year-over-year growth 2025-2030 (%)
Data Table on APAC - Year-over-year growth 2025-2030 (%)
Chart on Regional Comparison - APAC
Data Table on Regional Comparison - APAC

12.3.1 China - Market size and forecast 2025-2030

Chart on China - Market size and forecast 2025-2030 ($ million)
Data Table on China - Market size and forecast 2025-2030 ($ million)
Chart on China - Year-over-year growth 2025-2030 (%)
Data Table on China - Year-over-year growth 2025-2030 (%)

12.3.2 Japan - Market size and forecast 2025-2030

Chart on Japan - Market size and forecast 2025-2030 ($ million)
Data Table on Japan - Market size and forecast 2025-2030 ($ million)
Chart on Japan - Year-over-year growth 2025-2030 (%)
Data Table on Japan - Year-over-year growth 2025-2030 (%)

12.3.3 India - Market size and forecast 2025-2030

Chart on India - Market size and forecast 2025-2030 ($ million)
Data Table on India - Market size and forecast 2025-2030 ($ million)
Chart on India - Year-over-year growth 2025-2030 (%)
Data Table on India - Year-over-year growth 2025-2030 (%)

12.3.4 South Korea - Market size and forecast 2025-2030

Chart on South Korea - Market size and forecast 2025-2030 ($ million)
Data Table on South Korea - Market size and forecast 2025-2030 ($ million)
Chart on South Korea - Year-over-year growth 2025-2030 (%)
Data Table on South Korea - Year-over-year growth 2025-2030 (%)

12.3.5 Australia - Market size and forecast 2025-2030

Chart on Australia - Market size and forecast 2025-2030 ($ million)
Data Table on Australia - Market size and forecast 2025-2030 ($ million)
Chart on Australia - Year-over-year growth 2025-2030 (%)
Data Table on Australia - Year-over-year growth 2025-2030 (%)

12.3.6 Indonesia - Market size and forecast 2025-2030

Chart on Indonesia - Market size and forecast 2025-2030 ($ million)
Data Table on Indonesia - Market size and forecast 2025-2030 ($ million)
Chart on Indonesia - Year-over-year growth 2025-2030 (%)
Data Table on Indonesia - Year-over-year growth 2025-2030 (%)

12.4 North America - Market size and forecast 2025-2030

Chart on North America - Market size and forecast 2025-2030 ($ million)
Data Table on North America - Market size and forecast 2025-2030 ($ million)
Chart on North America - Year-over-year growth 2025-2030 (%)
Data Table on North America - Year-over-year growth 2025-2030 (%)
Chart on Regional Comparison - North America
Data Table on Regional Comparison - North America

12.4.1 US - Market size and forecast 2025-2030

Chart on US - Market size and forecast 2025-2030 ($ million)
Data Table on US - Market size and forecast 2025-2030 ($ million)
Chart on US - Year-over-year growth 2025-2030 (%)
Data Table on US - Year-over-year growth 2025-2030 (%)

12.4.2 Canada - Market size and forecast 2025-2030

Chart on Canada - Market size and forecast 2025-2030 ($ million)
Data Table on Canada - Market size and forecast 2025-2030 ($ million)
Chart on Canada - Year-over-year growth 2025-2030 (%)
Data Table on Canada - Year-over-year growth 2025-2030 (%)

12.4.3 Mexico - Market size and forecast 2025-2030

Chart on Mexico - Market size and forecast 2025-2030 ($ million)
Data Table on Mexico - Market size and forecast 2025-2030 ($ million)
Chart on Mexico - Year-over-year growth 2025-2030 (%)
Data Table on Mexico - Year-over-year growth 2025-2030 (%)

12.5 Europe - Market size and forecast 2025-2030

Chart on Europe - Market size and forecast 2025-2030 ($ million)
Data Table on Europe - Market size and forecast 2025-2030 ($ million)
Chart on Europe - Year-over-year growth 2025-2030 (%)
Data Table on Europe - Year-over-year growth 2025-2030 (%)
Chart on Regional Comparison - Europe
Data Table on Regional Comparison - Europe

12.5.1 Germany - Market size and forecast 2025-2030

Chart on Germany - Market size and forecast 2025-2030 ($ million)
Data Table on Germany - Market size and forecast 2025-2030 ($ million)
Chart on Germany - Year-over-year growth 2025-2030 (%)
Data Table on Germany - Year-over-year growth 2025-2030 (%)

12.5.2 UK - Market size and forecast 2025-2030

Chart on UK - Market size and forecast 2025-2030 ($ million)
Data Table on UK - Market size and forecast 2025-2030 ($ million)
Chart on UK - Year-over-year growth 2025-2030 (%)
Data Table on UK - Year-over-year growth 2025-2030 (%)

12.5.3 France - Market size and forecast 2025-2030

Chart on France - Market size and forecast 2025-2030 ($ million)
Data Table on France - Market size and forecast 2025-2030 ($ million)
Chart on France - Year-over-year growth 2025-2030 (%)
Data Table on France - Year-over-year growth 2025-2030 (%)

12.5.4 Italy - Market size and forecast 2025-2030

Chart on Italy - Market size and forecast 2025-2030 ($ million)
Data Table on Italy - Market size and forecast 2025-2030 ($ million)
Chart on Italy - Year-over-year growth 2025-2030 (%)
Data Table on Italy - Year-over-year growth 2025-2030 (%)

12.5.5 Spain - Market size and forecast 2025-2030

Chart on Spain - Market size and forecast 2025-2030 ($ million)
Data Table on Spain - Market size and forecast 2025-2030 ($ million)
Chart on Spain - Year-over-year growth 2025-2030 (%)
Data Table on Spain - Year-over-year growth 2025-2030 (%)

12.5.6 The Netherlands - Market size and forecast 2025-2030

Chart on The Netherlands - Market size and forecast 2025-2030 ($ million)
Data Table on The Netherlands - Market size and forecast 2025-2030 ($ million)
Chart on The Netherlands - Year-over-year growth 2025-2030 (%)
Data Table on The Netherlands - Year-over-year growth 2025-2030 (%)

12.6 Middle East and Africa - Market size and forecast 2025-2030

Chart on Middle East and Africa - Market size and forecast 2025-2030 ($ million)
Data Table on Middle East and Africa - Market size and forecast 2025-2030 ($ million)
Chart on Middle East and Africa - Year-over-year growth 2025-2030 (%)
Data Table on Middle East and Africa - Year-over-year growth 2025-2030 (%)
Chart on Regional Comparison - Middle East and Africa
Data Table on Regional Comparison - Middle East and Africa

12.6.1 Saudi Arabia - Market size and forecast 2025-2030

Chart on Saudi Arabia - Market size and forecast 2025-2030 ($ million)
Data Table on Saudi Arabia - Market size and forecast 2025-2030 ($ million)
Chart on Saudi Arabia - Year-over-year growth 2025-2030 (%)
Data Table on Saudi Arabia - Year-over-year growth 2025-2030 (%)

12.6.2 UAE - Market size and forecast 2025-2030

Chart on UAE - Market size and forecast 2025-2030 ($ million)
Data Table on UAE - Market size and forecast 2025-2030 ($ million)
Chart on UAE - Year-over-year growth 2025-2030 (%)
Data Table on UAE - Year-over-year growth 2025-2030 (%)

12.6.3 South Africa - Market size and forecast 2025-2030

Chart on South Africa - Market size and forecast 2025-2030 ($ million)
Data Table on South Africa - Market size and forecast 2025-2030 ($ million)
Chart on South Africa - Year-over-year growth 2025-2030 (%)
Data Table on South Africa - Year-over-year growth 2025-2030 (%)

12.6.4 Israel - Market size and forecast 2025-2030

Chart on Israel - Market size and forecast 2025-2030 ($ million)
Data Table on Israel - Market size and forecast 2025-2030 ($ million)
Chart on Israel - Year-over-year growth 2025-2030 (%)
Data Table on Israel - Year-over-year growth 2025-2030 (%)

12.6.5 Turkey - Market size and forecast 2025-2030

Chart on Turkey - Market size and forecast 2025-2030 ($ million)
Data Table on Turkey - Market size and forecast 2025-2030 ($ million)
Chart on Turkey - Year-over-year growth 2025-2030 (%)
Data Table on Turkey - Year-over-year growth 2025-2030 (%)

12.7 South America - Market size and forecast 2025-2030

Chart on South America - Market size and forecast 2025-2030 ($ million)
Data Table on South America - Market size and forecast 2025-2030 ($ million)
Chart on South America - Year-over-year growth 2025-2030 (%)
Data Table on South America - Year-over-year growth 2025-2030 (%)
Chart on Regional Comparison - South America
Data Table on Regional Comparison - South America

12.7.1 Brazil - Market size and forecast 2025-2030

Chart on Brazil - Market size and forecast 2025-2030 ($ million)
Data Table on Brazil - Market size and forecast 2025-2030 ($ million)
Chart on Brazil - Year-over-year growth 2025-2030 (%)
Data Table on Brazil - Year-over-year growth 2025-2030 (%)

12.7.2 Argentina - Market size and forecast 2025-2030

Chart on Argentina - Market size and forecast 2025-2030 ($ million)
Data Table on Argentina - Market size and forecast 2025-2030 ($ million)
Chart on Argentina - Year-over-year growth 2025-2030 (%)
Data Table on Argentina - Year-over-year growth 2025-2030 (%)

12.7.3 Chile - Market size and forecast 2025-2030

Chart on Chile - Market size and forecast 2025-2030 ($ million)
Data Table on Chile - Market size and forecast 2025-2030 ($ million)
Chart on Chile - Year-over-year growth 2025-2030 (%)
Data Table on Chile - Year-over-year growth 2025-2030 (%)

12.8 Market opportunity by geography

Market opportunity by geography ($ million)
Data Tables on Market opportunity by geography ($ million)

13. Drivers, Challenges, and Opportunity

13.1 Market drivers

Growing demand for freshwater and desalination solutions
Stringent environmental regulations and discharge norms
Industrial expansion and process optimization in emerging markets

13.2 Market challenges

High operational costs and membrane fouling issues
Technical limitations in harsh chemical and thermal environments
Disposal and environmental impact of spent membrane modules

13.3 Impact of drivers and challenges

Impact of drivers and challenges in 2025 and 2030

13.4 Market opportunities

Integration of digitalization and AI in membrane systems
Transition toward circularity and sustainable membrane life-cycle management
Proliferation of modular and decentralized membrane treatment units

14. Competitive Landscape

14.1 Overview

14.2

Overview on criticality of inputs and factors of differentiation

14.3 Landscape disruption

Overview on factors of disruption

14.4 Industry risks

Impact of key risks on business

15. Competitive Analysis

15.1 Companies profiled

Companies covered

15.2 Company ranking index

15.3 Market positioning of companies

Matrix on companies position and classification

15.4 3M Co.

3M Co. - Overview
3M Co. - Business segments
3M Co. - Key news
3M Co. - Key offerings
3M Co. - Segment focus
SWOT

15.5 Alfa Laval AB

Alfa Laval AB - Overview
Alfa Laval AB - Business segments
Alfa Laval AB - Key offerings
Alfa Laval AB - Segment focus
SWOT

15.6 Asahi Kasei Corp.

Asahi Kasei Corp. - Overview
Asahi Kasei Corp. - Business segments
Asahi Kasei Corp. - Key news
Asahi Kasei Corp. - Key offerings
Asahi Kasei Corp. - Segment focus
SWOT

15.7 DuPont de Nemours Inc.

DuPont de Nemours Inc. - Overview
DuPont de Nemours Inc. - Business segments
DuPont de Nemours Inc. - Key news
DuPont de Nemours Inc. - Key offerings
DuPont de Nemours Inc. - Segment focus
SWOT

15.8 GEA Group AG

GEA Group AG - Overview
GEA Group AG - Business segments
GEA Group AG - Key offerings
GEA Group AG - Segment focus
SWOT

15.9 Kubota Corp.

Kubota Corp. - Overview
Kubota Corp. - Business segments
Kubota Corp. - Key offerings
Kubota Corp. - Segment focus
SWOT

15.10 LG Chem Ltd.

LG Chem Ltd. - Overview
LG Chem Ltd. - Business segments
LG Chem Ltd. - Key offerings
LG Chem Ltd. - Segment focus
SWOT

15.11 Nitto Denko Corp.

Nitto Denko Corp. - Overview
Nitto Denko Corp. - Business segments
Nitto Denko Corp. - Key offerings
Nitto Denko Corp. - Segment focus
SWOT

15.12 Parker Hannifin Corp.

Parker Hannifin Corp. - Overview
Parker Hannifin Corp. - Business segments
Parker Hannifin Corp. - Key offerings
Parker Hannifin Corp. - Segment focus
SWOT

15.13 Pentair Plc

Pentair Plc - Overview
Pentair Plc - Business segments
Pentair Plc - Key offerings
Pentair Plc - Segment focus
SWOT

15.14 Thermo Fisher Scientific Inc.

Thermo Fisher Scientific Inc. - Overview
Thermo Fisher Scientific Inc. - Business segments
Thermo Fisher Scientific Inc. - Key news
Thermo Fisher Scientific Inc. - Key offerings
Thermo Fisher Scientific Inc. - Segment focus
SWOT

15.15 Toray Industries Inc.

Toray Industries Inc. - Overview
Toray Industries Inc. - Business segments
Toray Industries Inc. - Key news
Toray Industries Inc. - Key offerings
Toray Industries Inc. - Segment focus
SWOT

15.16 Toyobo Co. Ltd.

Toyobo Co. Ltd. - Overview
Toyobo Co. Ltd. - Business segments
Toyobo Co. Ltd. - Key news
Toyobo Co. Ltd. - Key offerings
Toyobo Co. Ltd. - Segment focus
SWOT

15.17 Veolia Environment SA

Veolia Environment SA - Overview
Veolia Environment SA - Business segments
Veolia Environment SA - Key news
Veolia Environment SA - Key offerings
Veolia Environment SA - Segment focus
SWOT

15.18 Xylem Inc.

Xylem Inc. - Overview
Xylem Inc. - Business segments
Xylem Inc. - Key news
Xylem Inc. - Key offerings
Xylem Inc. - Segment focus
SWOT

16. Appendix

16.1 Scope of the report

Market definition
Objectives
Notes and caveats

16.2 Inclusions and exclusions checklist

Inclusions checklist
Exclusions checklist

16.3 Currency conversion rates for US$

16.4 Research methodology

16.5 Data procurement

Information sources

16.6 Data validation

16.7 Validation techniques employed for market sizing

16.8 Data synthesis

16.9 360 degree market analysis

16.10 List of abbreviations

Research Methodology

Technavio presents a detailed picture of the market by way of study, synthesis, and summation of data from multiple sources. The analysts have presented the various facets of the market with a particular focus on identifying the key industry influencers. The data thus presented is comprehensive, reliable, and the result of extensive research, both primary and secondary.

INFORMATION SOURCES

Primary sources

  • Manufacturers and suppliers
  • Channel partners
  • Industry experts
  • Strategic decision makers

Secondary sources

  • Industry journals and periodicals
  • Government data
  • Financial reports of key industry players
  • Historical data
  • Press releases

DATA ANALYSIS

Data Synthesis

  • Collation of data
  • Estimation of key figures
  • Analysis of derived insights

Data Validation

  • Triangulation with data models
  • Reference against proprietary databases
  • Corroboration with industry experts

REPORT WRITING

Qualitative

  • Market drivers
  • Market challenges
  • Market trends
  • Five forces analysis

Quantitative

  • Market size and forecast
  • Market segmentation
  • Geographical insights
  • Competitive landscape

Interested in this report?

Get your sample now to see our research methodology and insights!

Download Now

Frequently Asked Questions

Membrane market growth will increase by USD 1750.8 million during 2026-2030.

The Membrane market is expected to grow at a CAGR of 4.6% during 2026-2030.

Membrane market is segmented by Application (Wastewater treatment, Food and beverage, Pharmaceutical and medical, Chemical processing, Others) Technology (RO, Microfiltration, Ultrafiltration, Pervaporation, Others) Material (Polymeric, Ceramic)

3M Co., Alfa Laval AB, Asahi Kasei Corp., DuPont de Nemours Inc., GEA Group AG, Kubota Corp., LG Chem Ltd., MANN HUMMEL International GmbH, Nitto Denko Corp., OriginWater Membrane Technology, Pall Corp., Parker Hannifin Corp., Pentair Plc, Scinor Water America LLC, Synder Filtration Inc., Thermo Fisher Scientific Inc., Toray Industries Inc., Toyobo Co. Ltd., Veolia Environment SA, Xylem Inc. are a few of the key vendors in the Membrane market.

APAC will register the highest growth rate of 38.5% among the other regions. Therefore, the Membrane market in APAC is expected to garner significant business opportunities for the vendors during the forecast period.

China, Japan, India, South Korea, Australia, Indonesia, US, Canada, Mexico, Germany, UK, France, Italy, Spain, The Netherlands, Saudi Arabia, UAE, South Africa, Israel, Turkey, Brazil, Argentina, Chile

  • Growing demand for freshwater and desalination solutions is the driving factor this market.

The Membrane market vendors should focus on grabbing business opportunities from the Application segment as it accounted for the largest market share in the base year.
RIA - Research AI Assistant
Ask RIA