North America School Market by Type and Product - Forecast and Analysis 2024-2028

North America School Market by Type and Product - Forecast and Analysis 2024-2028

Published: Mar 2024 127 Pages SKU: IRTNTR77593

Market Overview at a Glance

$49.21 B
Market Opportunity
12.55%
CAGR
11.35
YoY growth 2023-2024(%)

North America School Market Size 2024-2028 

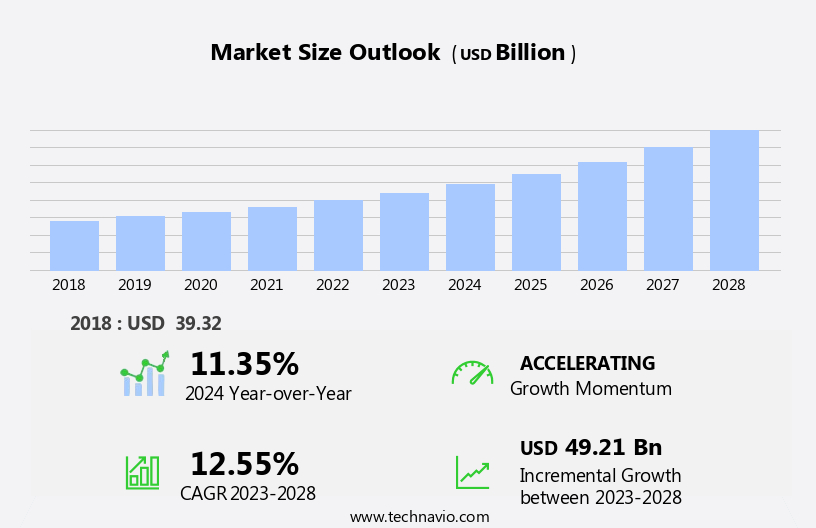
The North America school market size is forecast to increase by USD 49.21 billion, at a CAGR of 12.55% between 2023 and 2028.

  • In the North American school market, digital transformation is gaining significant traction in both public and private educational institutions. Schools are increasingly investing in formative learning tools to enhance student engagement and improve educational outcomes. However, the implementation of blended learning approaches poses challenges, with concerns surrounding the credibility of sources and the quality of content. As schools navigate this digital shift, they must ensure that the resources they adopt are reliable and effective in supporting student learning. To capitalize on this trend, companies offering digital educational solutions must prioritize the development of high-quality, trustworthy content and tools to meet the evolving needs of the North American school market.
  • Effective collaboration between schools, technology providers, and educational experts will be essential to address the challenges of credibility and content quality in the blended learning environment, ultimately driving innovation and growth in the sector.

What will be the size of the North America School Market during the forecast period?

School Market in North America Size

Explore in-depth regional segment analysis with market size data - historical 2018-2022 and forecasts 2024-2028 - in the full report.  
 Request Free Sample

  • School transportation in North America is a dynamic market, prioritizing sustainability and security. School buses are being upgraded with recycling programs, alternative fuel infrastructure, and green building practices. Security screening and anti-terrorism measures, including biometric authentication and facial recognition, are increasingly integrated into transportation systems. Real-time tracking, route planning, and dispatch management ensure efficient operations. Safety technology, such as automatic emergency braking, lane departure warning, and blind spot detection, is standard in modern bus designs. Special needs transportation caters to diverse student populations.
  • School bus manufacturing incorporates innovation in transportation, focusing on passenger comfort, driver fatigue monitoring, and noise reduction. Vibration damping and chassis types are considered in bus design for optimal performance. Fuel management and engine options cater to sustainability concerns. Safety is a top priority, with a focus on safety technology and maintenance schedules.

How is this market segmented?

The market research report provides comprehensive data (region-wise segment analysis), with forecasts and estimates in "USD billion" for the period 2024-2028, as well as historical data from 2018-2022 for the following segments.

  • Type
    • Public
    • Private
  • Product
    • Elementary
    • Senior high
    • Middle and junior high
  • Geography
    • North America
      • US
      • Canada
      • Mexico

By Type Insights

The public segment is estimated to witness significant growth during the forecast period.

Public schools in North America are integral to the education system, funded and operated by local, state, or provincial governments. With a focus on accessibility and affordability, these institutions serve the community by providing free education to students. The market for public schools is driven by government initiatives to modernize technology infrastructure, enabling various learning modes like online education. Sustainability is also a growing priority, with initiatives to reduce carbon footprints through the adoption of renewable energy sources and electric school buses. Cost optimization is a key concern, leading to the implementation of fuel-efficient HVAC systems, telematics for fleet management, and route optimization.

Student safety remains a top priority, with regulations mandating safety inspections, emergency response plans, and the use of two-way radios for communication. Compliance with industry standards for seat comfort, ADA accessibility, and emergency evacuation procedures is essential. Technology integration, including wi-fi connectivity, digital signage, and data analytics, enhances the learning experience and streamlines operations. School bus procurement involves considering factors like passenger capacity, bus safety features, and financing options. Partnerships with school districts and labor unions contribute to operational efficiency, while bus driver training and communication systems ensure effective student transportation.

School Market in North America Size

Download Free Sample Report

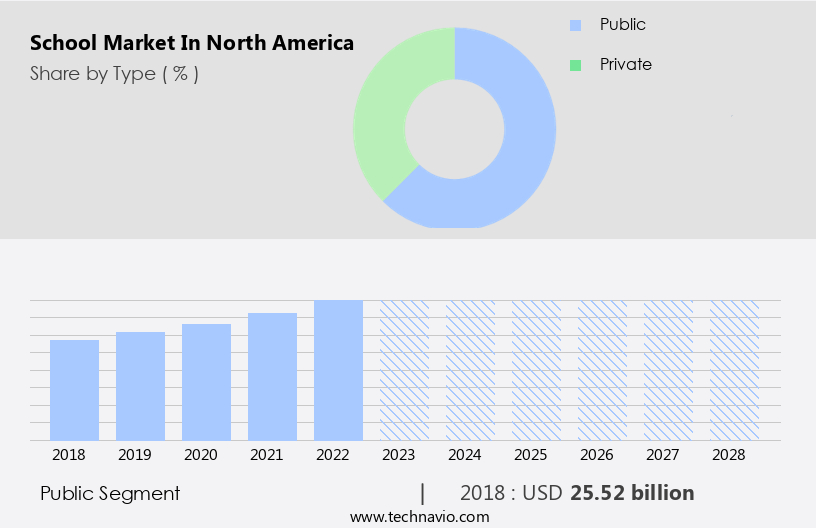
The Public segment was valued at  USD 25.52 billion in 2018 and showed a gradual increase during the forecast period.

Market Dynamics

Our researchers analyzed the data with 2023 as the base year, along with the key drivers, trends, and challenges. A holistic analysis of drivers will help companies refine their marketing strategies to gain a competitive advantage.

What are the North America School Market drivers leading to the rise in adoption of the Industry?

  • Digital transformation is a crucial catalyst for the market in both public and private educational institutions. This shift towards advanced technologies and digital solutions is driving significant growth and innovation within the education sector. 
  • The North American school market is undergoing a significant digital transformation, with both private and public schools embracing Learning Management Systems (LMS) to enhance the educational experience. LMS platforms facilitate online learning, streamline course management, and offer a centralized hub for communication and collaboration. This shift towards technology integration has created numerous opportunities for educational technology companies. Industry standards, such as fire extinguishers, emergency contact lists, and driver qualifications, remain paramount in school operations. Compliance with National Highway Traffic Safety Administration (NHTSA) standards is essential for bus safety. Alternative fuels and hybrid buses are gaining popularity for their operational efficiency and environmental benefits.
  • Employee benefits, bus safety features, and effective communication systems are crucial for school districts in fostering a productive learning environment. Bus driver training, accident reporting, and safety reporting are vital components of school transportation. Union contracts and labor costs are ongoing considerations for school districts. Integrating advanced technologies like child restraint systems, communication systems, and safety reporting tools can further improve operational efficiency and student safety. By focusing on these areas, educational technology companies can contribute significantly to the evolving the market.

What are the North America School Market trends shaping the Industry?

  • Formative learning tools are gaining increasing prominence in the educational market. It is essential to prioritize these tools to stay current in professional education circles.
  • In the North American education sector, safety certification and government regulations play a significant role in shaping the school market. Two-way radios and transportation management software are essential tools for ensuring student safety and optimizing transportation costs. HVAC systems and air conditioning systems are crucial for maintaining a comfortable learning environment, while sustainability initiatives and emissions standards contribute to the long-term sustainability of schools. Private school transportation fleets require fleet management solutions to ensure efficient operations, passenger capacity, and cost optimization. School bus insurance is a critical consideration for schools to mitigate risks and allocate school budgets effectively. Wi-fi connectivity has become a necessity to enhance the learning experience and facilitate remote learning.
  • Formative assessment tools, such as transportation management software and wi-fi connectivity, enable teachers to diagnose learning gaps and provide immediate feedback, improving teaching methods and student outcomes. Sustainability initiatives, community engagement, and cost optimization are key market dynamics shaping the North American school market.

How does North America School Market face challenges during its growth?

  • The blended mode of teaching, which incorporates various sources, faces significant challenges due to the questionable credibility of some sources and subpar content quality. This issue undermines industry growth by casting doubt on the effectiveness and reliability of this educational approach. 
  • The market is witnessing significant growth due to the increasing focus on environmental sustainability and safety. Bus leasing companies are investing in electric school buses to reduce greenhouse gas emissions and carbon footprints. Telematics systems are being integrated into buses for real-time monitoring of fuel efficiency, route optimization, and student tracking. Environmental concerns are also driving the adoption of renewable energy sources for bus charging and emergency response systems for evacuation plans. Safety inspections are mandatory for charter school transportation and public transportation integration. Digital signage is being used to communicate important information to students and parents.
  • Data analytics help schools optimize their transportation operations and improve emergency response plans. Emergency evacuation plans are a critical aspect of school safety, and telematics systems enable real-time monitoring of bus locations and student tracking during emergencies. Bus companies are also focusing on safety inspections to ensure the vehicles are in good working condition and meet regulatory requirements. In conclusion, the market is undergoing a transformation with the integration of technology and a focus on environmental sustainability and safety. Bus leasing companies are investing in electric buses, telematics systems, and safety inspections to meet the evolving needs of schools and students.
  • The use of data analytics and digital signage is becoming increasingly common to optimize transportation operations and communicate important information.

Exclusive North America School Market Customer Landscape

The market forecasting report includes the adoption lifecycle of the market, covering from the innovator's stage to the laggard's stage. It focuses on adoption rates in different regions based on penetration. Furthermore, the report also includes key purchase criteria and drivers of price sensitivity to help companies evaluate and develop their market growth analysis strategies.
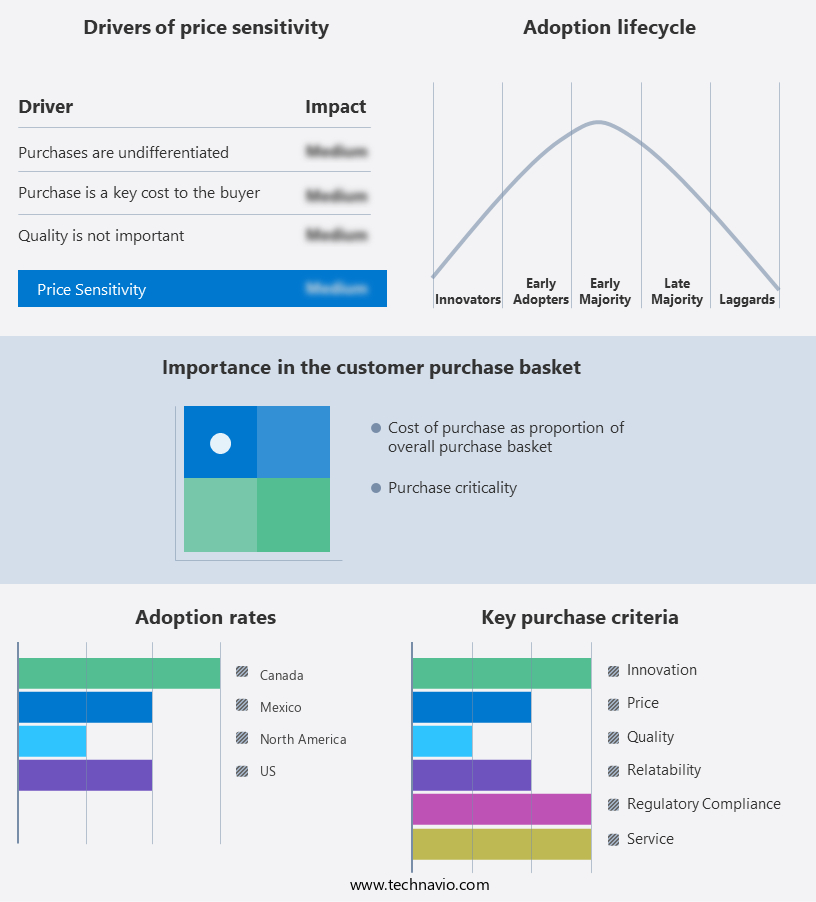
School Market in North America Share by Geography

 Customer Landscape

Key Companies & Market Insights

Companies are implementing various strategies, such as strategic alliances, market forecast partnerships, mergers and acquisitions, geographical expansion, and product/service launches, to enhance their presence in the market.

The market research and growth report includes detailed analyses of the competitive landscape of the market and information about key companies, including:

  • Avenues The World School
  • Collegiate School NYC
  • Greengates School
  • Harvard Westlake School
  • Havergal College
  • Horace Mann School
  • Lakefield College School
  • National Cathedral School
  • North Carolina School of Science and Mathematics
  • Oklahoma School of Science and Mathematics
  • Sidwell Friends School
  • St. Georges School
  • Stuyvesant High School
  • The Brearley School
  • The Dalton School
  • The Davidson Academy
  • The Harker School
  • The Pike School
  • The Potomac School
  • The Trustees of Phillips Exeter Academy

Qualitative and quantitative analysis of companies has been conducted to help clients understand the wider business environment as well as the strengths and weaknesses of key market players. Data is qualitatively analyzed to categorize companies as pure play, category-focused, industry-focused, and diversified; it is quantitatively analyzed to categorize companies as dominant, leading, strong, tentative, and weak.

Recent Development and News in School Market In North America

  • In January 2024, Microsoft Education announced the launch of Microsoft Education Hub, an integrated platform designed to help teachers personalize learning experiences for students using Microsoft tools and resources (Microsoft, 2024). This new product aims to streamline education technology usage and improve access to digital learning materials.
  • In March 2024, Apple and Google signed a partnership agreement to expand Google Workspace for Education integration with Apple Classroom, enabling seamless management of student devices and learning applications in K-12 schools (Apple, 2024). This collaboration represents a significant step towards improving interoperability between popular education technology platforms.
  • In May 2025, Blackboard, a leading educational technology provider, completed its acquisition of Moodle, a widely-used open-source learning management system (Blackboard, 2025). This strategic move is expected to strengthen Blackboard's market position and expand its offerings to cater to a broader range of educational institutions.

Research Analyst Overview

In the dynamic North American school market, safety certification and government regulations continue to shape the landscape. Two-way radios facilitate effective communication, while cost optimization drives the adoption of transportation management software and HVAC system upgrades. Sustainability initiatives, including community engagement and fleet management, are increasingly prioritized to reduce emissions and promote environmental sustainability. Passenger capacity and private school transportation solutions are evolving to meet diverse student needs. Air conditioning systems ensure comfort, while transportation costs remain a significant consideration. Student safety remains a top priority, with school bus insurance, safety inspections, telematics systems, and emergency response plans integral to operations.

School budget allocation includes Wi-Fi connectivity, bus leasing, and technology integration for compliance management, seat comfort, and interior design. Bus maintenance, safety protocols, and accessibility features are essential industry standards. Fire extinguishers, first aid kits, and emergency contact lists are crucial safety features. The market also embraces emerging trends, such as electric school buses, renewable energy sources, and alternative fuels, to reduce carbon footprints and enhance operational efficiency. School district partnerships, labor costs, and union contracts impact bus procurement and driver qualifications. Accident reporting and safety reporting are essential for continuous improvement, while bus driver training and communication systems ensure a safe and efficient fleet.

The ongoing evolution of the North American school market encompasses a wide range of factors, from regulatory requirements and cost considerations to technological advancements and sustainability initiatives. These elements intertwine to create a complex, ever-changing landscape that demands ongoing attention and adaptation.

Dive into Technavio's robust research methodology, blending expert interviews, extensive data synthesis, and validated models for unparalleled School Market in North America insights. See full methodology.

Market Scope

Report Coverage

Details

Page number

127

Base year

2023

Historic period

2018-2022

Forecast period

2024-2028

Growth momentum & CAGR

Accelerate at a CAGR of 12.55%

Market growth 2024-2028

USD 49.21 billion

Market structure

Fragmented

YoY growth 2023-2024(%)

11.35

Competitive landscape

Leading Companies, Market Positioning of Companies, Competitive Strategies, and Industry Risks

Request Free Sample

What are the Key Data Covered in this Market Research Report?

  • CAGR of the market during the forecast period
  • Detailed information on factors that will drive the market growth and forecasting between 2024 and 2028
  • Precise estimation of the size of the market  and its contribution of the market in focus to the parent market
  • Accurate predictions about upcoming market growth and trends and changes in consumer behaviour
  • Growth of the market across North America
  • Thorough analysis of the market's competitive landscape and detailed information about companies
  • Comprehensive analysis of factors that will challenge the growth of market companies

We can help! Our analysts can customize this market research report to meet your requirements Get in touch

1 Executive Summary

  • 1.1 Market overview
    • Exhibit 01: Executive Summary – Chart on Market Overview
    • Exhibit 02: Executive Summary – Data Table on Market Overview
    • Exhibit 03: Executive Summary – Chart on Country Market Characteristics
    • Exhibit 04: Executive Summary – Chart on Market by Geography
    • Exhibit 05: Executive Summary – Chart on Market Segmentation by Type
    • Exhibit 06: Executive Summary – Chart on Market Segmentation by Product
    • Exhibit 07: Executive Summary – Chart on Incremental Growth
    • Exhibit 08: Executive Summary – Data Table on Incremental Growth
    • Exhibit 09: Executive Summary – Chart on Vendor Market Positioning

2 Market Landscape

  • 2.1 Market ecosystem
    • Exhibit 10: Parent market
    • Exhibit 11: Market Characteristics

3 Market Sizing

  • 3.1 Market definition
    • Exhibit 12: Offerings of vendors included in the market definition
  • 3.2 Market segment analysis
    • Exhibit 13: Market segments
  • 3.3 Market size 2023
    • 3.4 Market outlook: Forecast for 2023-2028
      • Exhibit 14: Chart on North America - Market size and forecast 2023-2028 ($ billion)
      • Exhibit 15: Data Table on Regional - Market size and forecast 2023-2028 ($ billion)
      • Exhibit 16: Chart on North America: Year-over-year growth 2023-2028 (%)
      • Exhibit 17: Data Table on Regional - Market size and forecast 2023-2028 ($ billion)

    4 Historic Market Size

    • 4.1 School market in North America 2018 - 2022
      • Exhibit 18: Historic Market Size – Data Table on school market in north America 2018 - 2022 ($ billion)
    • 4.2 Type Segment Analysis 2018 - 2022
      • Exhibit 19: Historic Market Size – Type Segment 2018 - 2022 ($ billion)
    • 4.3 Product Segment Analysis 2018 - 2022
      • Exhibit 20: Historic Market Size – Product Segment 2018 - 2022 ($ billion)
    • 4.4 Geography Segment Analysis 2018 - 2022
      • Exhibit 21: Historic Market Size – Geography Segment 2018 - 2022 ($ billion)

    5 Five Forces Analysis

    • 5.1 Five forces summary
      • Exhibit 22: Five forces analysis - Comparison between 2023 and 2028
    • 5.2 Bargaining power of buyers
      • Exhibit 23: Chart on Bargaining power of buyers – Impact of key factors 2023 and 2028
    • 5.3 Bargaining power of suppliers
      • Exhibit 24: Bargaining power of suppliers – Impact of key factors in 2023 and 2028
    • 5.4 Threat of new entrants
      • Exhibit 25: Threat of new entrants – Impact of key factors in 2023 and 2028
    • 5.5 Threat of substitutes
      • Exhibit 26: Threat of substitutes – Impact of key factors in 2023 and 2028
    • 5.6 Threat of rivalry
      • Exhibit 27: Threat of rivalry – Impact of key factors in 2023 and 2028
    • 5.7 Market condition
      • Exhibit 28: Chart on Market condition - Five forces 2023 and 2028

    6 Market Segmentation by Type

    • 6.1 Market segments
      • Exhibit 29: Chart on Type - Market share 2023-2028 (%)
      • Exhibit 30: Data Table on Type - Market share 2023-2028 (%)
    • 6.2 Comparison by Type
      • Exhibit 31: Chart on Comparison by Type
      • Exhibit 32: Data Table on Comparison by Type
    • 6.3 Public - Market size and forecast 2023-2028
      • Exhibit 33: Chart on Public - Market size and forecast 2023-2028 ($ billion)
      • Exhibit 34: Data Table on Public - Market size and forecast 2023-2028 ($ billion)
      • Exhibit 35: Chart on Public - Year-over-year growth 2023-2028 (%)
      • Exhibit 36: Data Table on Public - Year-over-year growth 2023-2028 (%)
    • 6.4 Private - Market size and forecast 2023-2028
      • Exhibit 37: Chart on Private - Market size and forecast 2023-2028 ($ billion)
      • Exhibit 38: Data Table on Private - Market size and forecast 2023-2028 ($ billion)
      • Exhibit 39: Chart on Private - Year-over-year growth 2023-2028 (%)
      • Exhibit 40: Data Table on Private - Year-over-year growth 2023-2028 (%)
    • 6.5 Market opportunity by Type
      • Exhibit 41: Market opportunity by Type ($ billion)
      • Exhibit 42: Data Table on Market opportunity by Type ($ billion)

    7 Market Segmentation by Product

    • 7.1 Market segments
      • Exhibit 43: Chart on Product - Market share 2023-2028 (%)
      • Exhibit 44: Data Table on Product - Market share 2023-2028 (%)
    • 7.2 Comparison by Product
      • Exhibit 45: Chart on Comparison by Product
      • Exhibit 46: Data Table on Comparison by Product
    • 7.3 Elementary - Market size and forecast 2023-2028
      • Exhibit 47: Chart on Elementary - Market size and forecast 2023-2028 ($ billion)
      • Exhibit 48: Data Table on Elementary - Market size and forecast 2023-2028 ($ billion)
      • Exhibit 49: Chart on Elementary - Year-over-year growth 2023-2028 (%)
      • Exhibit 50: Data Table on Elementary - Year-over-year growth 2023-2028 (%)
    • 7.4 Senior high - Market size and forecast 2023-2028
      • Exhibit 51: Chart on Senior high - Market size and forecast 2023-2028 ($ billion)
      • Exhibit 52: Data Table on Senior high - Market size and forecast 2023-2028 ($ billion)
      • Exhibit 53: Chart on Senior high - Year-over-year growth 2023-2028 (%)
      • Exhibit 54: Data Table on Senior high - Year-over-year growth 2023-2028 (%)
    • 7.5 Middle and junior high - Market size and forecast 2023-2028
      • Exhibit 55: Chart on Middle and junior high - Market size and forecast 2023-2028 ($ billion)
      • Exhibit 56: Data Table on Middle and junior high - Market size and forecast 2023-2028 ($ billion)
      • Exhibit 57: Chart on Middle and junior high - Year-over-year growth 2023-2028 (%)
      • Exhibit 58: Data Table on Middle and junior high - Year-over-year growth 2023-2028 (%)
    • 7.6 Market opportunity by Product
      • Exhibit 59: Market opportunity by Product ($ billion)
      • Exhibit 60: Data Table on Market opportunity by Product ($ billion)

    8 Customer Landscape

    • 8.1 Customer landscape overview
      • Exhibit 61: Analysis of price sensitivity, lifecycle, customer purchase basket, adoption rates, and purchase criteria

    9 Geographic Landscape

    • 9.1 Geographic segmentation
      • Exhibit 62: Chart on Market share by geography - 2023-2028 (%)
      • Exhibit 63: Data Table on Market share by geography - 2023-2028 (%)
    • 9.2 Geographic comparison
      • Exhibit 64: Chart on Geographic comparison
      • Exhibit 65: Data Table on Geographic comparison
    • 9.3 US - Market size and forecast 2023-2028
      • Exhibit 66: Chart on US - Market size and forecast 2023-2028 ($ billion)
      • Exhibit 67: Data Table on US - Market size and forecast 2023-2028 ($ billion)
      • Exhibit 68: Chart on US - Year-over-year growth 2023-2028 (%)
      • Exhibit 69: Data Table on US - Year-over-year growth 2023-2028 (%)
    • 9.4 Canada - Market size and forecast 2023-2028
      • Exhibit 70: Chart on Canada - Market size and forecast 2023-2028 ($ billion)
      • Exhibit 71: Data Table on Canada - Market size and forecast 2023-2028 ($ billion)
      • Exhibit 72: Chart on Canada - Year-over-year growth 2023-2028 (%)
      • Exhibit 73: Data Table on Canada - Year-over-year growth 2023-2028 (%)
    • 9.5 Mexico - Market size and forecast 2023-2028
      • Exhibit 74: Chart on Mexico - Market size and forecast 2023-2028 ($ billion)
      • Exhibit 75: Data Table on Mexico - Market size and forecast 2023-2028 ($ billion)
      • Exhibit 76: Chart on Mexico - Year-over-year growth 2023-2028 (%)
      • Exhibit 77: Data Table on Mexico - Year-over-year growth 2023-2028 (%)
    • 9.6 Market opportunity by geography
      • Exhibit 78: Market opportunity by geography ($ billion)
      • Exhibit 79: Data Table on Market opportunity by geography ($ billion)

    10 Drivers, Challenges, and Trends

    • 10.1 Market drivers
      • 10.2 Market challenges
        • 10.3 Impact of drivers and challenges
          • Exhibit 80: Impact of drivers and challenges in 2023 and 2028
        • 10.4 Market trends

          11 Vendor Landscape

          • 11.1 Overview
            • 11.2 Vendor landscape
              • Exhibit 81: Overview on Criticality of inputs and Factors of differentiation
            • 11.3 Landscape disruption
              • Exhibit 82: Overview on factors of disruption
            • 11.4 Industry risks
              • Exhibit 83: Impact of key risks on business

            12 Vendor Analysis

            • 12.1 Vendors covered
              • Exhibit 84: Vendors covered
            • 12.2 Market positioning of vendors
              • Exhibit 85: Matrix on vendor position and classification
            • 12.3 Avenues The World School
              • Exhibit 86: Avenues The World School - Overview
              • Exhibit 87: Avenues The World School - Product / Service
              • Exhibit 88: Avenues The World School - Key offerings
            • 12.4 Collegiate School NYC
              • Exhibit 89: Collegiate School NYC - Overview
              • Exhibit 90: Collegiate School NYC - Product / Service
              • Exhibit 91: Collegiate School NYC - Key offerings
            • 12.5 Harvard Westlake School
              • Exhibit 92: Harvard Westlake School - Overview
              • Exhibit 93: Harvard Westlake School - Product / Service
              • Exhibit 94: Harvard Westlake School - Key offerings
            • 12.6 Havergal College
              • Exhibit 95: Havergal College - Overview
              • Exhibit 96: Havergal College - Product / Service
              • Exhibit 97: Havergal College - Key offerings
            • 12.7 Horace Mann School
              • Exhibit 98: Horace Mann School - Overview
              • Exhibit 99: Horace Mann School - Product / Service
              • Exhibit 100: Horace Mann School - Key offerings
            • 12.8 National Cathedral School
              • Exhibit 101: National Cathedral School - Overview
              • Exhibit 102: National Cathedral School - Product / Service
              • Exhibit 103: National Cathedral School - Key offerings
            • 12.9 North Carolina School of Science and Mathematics
              • Exhibit 104: North Carolina School of Science and Mathematics - Overview
              • Exhibit 105: North Carolina School of Science and Mathematics - Product / Service
              • Exhibit 106: North Carolina School of Science and Mathematics - Key offerings
            • 12.10 Oklahoma School of Science and Mathematics
              • Exhibit 107: Oklahoma School of Science and Mathematics - Overview
              • Exhibit 108: Oklahoma School of Science and Mathematics - Product / Service
              • Exhibit 109: Oklahoma School of Science and Mathematics - Key offerings
            • 12.11 Stuyvesant High School
              • Exhibit 110: Stuyvesant High School - Overview
              • Exhibit 111: Stuyvesant High School - Product / Service
              • Exhibit 112: Stuyvesant High School - Key offerings
            • 12.12 The Dalton School
              • Exhibit 113: The Dalton School - Overview
              • Exhibit 114: The Dalton School - Product / Service
              • Exhibit 115: The Dalton School - Key offerings
            • 12.13 The Davidson Academy
              • Exhibit 116: The Davidson Academy - Overview
              • Exhibit 117: The Davidson Academy - Product / Service
              • Exhibit 118: The Davidson Academy - Key offerings
            • 12.14 The Harker School
              • Exhibit 119: The Harker School - Overview
              • Exhibit 120: The Harker School - Product / Service
              • Exhibit 121: The Harker School - Key offerings
            • 12.15 The Pike School
              • Exhibit 122: The Pike School - Overview
              • Exhibit 123: The Pike School - Product / Service
              • Exhibit 124: The Pike School - Key offerings
            • 12.16 The Potomac School
              • Exhibit 125: The Potomac School - Overview
              • Exhibit 126: The Potomac School - Product / Service
              • Exhibit 127: The Potomac School - Key offerings
            • 12.17 The Trustees of Phillips Exeter Academy
              • Exhibit 128: The Trustees of Phillips Exeter Academy - Overview
              • Exhibit 129: The Trustees of Phillips Exeter Academy - Product / Service
              • Exhibit 130: The Trustees of Phillips Exeter Academy - Key offerings

            13 Appendix

            • 13.1 Scope of the report
              • 13.2 Inclusions and exclusions checklist
                • Exhibit 131: Inclusions checklist
                • Exhibit 132: Exclusions checklist
              • 13.3 Currency conversion rates for US$
                • Exhibit 133: Currency conversion rates for US$
              • 13.4 Research methodology
                • Exhibit 134: Research methodology
                • Exhibit 135: Validation techniques employed for market sizing
                • Exhibit 136: Information sources
              • 13.5 List of abbreviations
                • Exhibit 137: List of abbreviations

              Research Methodology

              Technavio presents a detailed picture of the market by way of study, synthesis, and summation of data from multiple sources. The analysts have presented the various facets of the market with a particular focus on identifying the key industry influencers. The data thus presented is comprehensive, reliable, and the result of extensive research, both primary and secondary.

              INFORMATION SOURCES

              Primary sources

              • Manufacturers and suppliers
              • Channel partners
              • Industry experts
              • Strategic decision makers

              Secondary sources

              • Industry journals and periodicals
              • Government data
              • Financial reports of key industry players
              • Historical data
              • Press releases

              DATA ANALYSIS

              Data Synthesis

              • Collation of data
              • Estimation of key figures
              • Analysis of derived insights

              Data Validation

              • Triangulation with data models
              • Reference against proprietary databases
              • Corroboration with industry experts

              REPORT WRITING

              Qualitative

              • Market drivers
              • Market challenges
              • Market trends
              • Five forces analysis

              Quantitative

              • Market size and forecast
              • Market segmentation
              • Geographical insights
              • Competitive landscape

              Interested in this report?

              Get your sample now to see our research methodology and insights!

              Download Now

              Frequently Asked Questions

              Schoolin North America market growth will increase by $ 49.21 bn during 2024-2028.

              The Schoolin North America market is expected to grow at a CAGR of 12.55% during 2024-2028.

              Schoolin North America market is segmented by Type( Public, Private) Product( Elementary, Senior high, Middle and junior high)

              Avenues The World School, Collegiate School NYC, Greengates School, Harvard Westlake School, Havergal College, Horace Mann School, Lakefield College School, National Cathedral School, North Carolina School of Science and Mathematics, Oklahoma School of Science and Mathematics, Sidwell Friends School, St. Georges School, Stuyvesant High School, The Brearley School, The Dalton School, The Davidson Academy, The Harker School, The Pike School, The Potomac School, The Trustees of Phillips Exeter Academy are a few of the key vendors in the Schoolin North America market.

              North America will register the highest growth rate of 100% among the other regions. Therefore, the Schoolin North America market in North America is expected to garner significant business opportunities for the vendors during the forecast period.

              US, Canada, Mexico, North America

              • Digital transformation in public and private schoolsSchools are increasingly adopting Learning Management Systems (LMS) to facilitate online learning is the driving factor this market.
              • streamline course management is the driving factor this market.
              • and provide a centralized platform for communication and collaboration. LMS platforms enhance the overall educational experience for students and teachers. Recently is the driving factor this market.
              • the school market in North America has witnessed a digital transformation both in private and public schools. This transformation has created immense opportunities for educational technology companies to offer different platforms that could cater to all types of student needs related to school education. Additionally is the driving factor this market.
              • integrating technologies like artificial intelligence is the driving factor this market.
              • virtual reality is the driving factor this market.
              • and online collaboration tools can improve the learning environment. In 2021 is the driving factor this market.
              • Renaissance Learning is the driving factor this market.
              • a provider of personalized learning and educational assessment solutions is the driving factor this market.
              • acquired Nearpod is the driving factor this market.
              • a content platform and an interactive classroom tool. The acquisition aimed to provide teachers with more interactive and engaging resources and has enhanced Renaissance Learning digital offerings. In 2020 is the driving factor this market.
              • PowerSchool is the driving factor this market.
              • a leading provider of K-12 education technology solutions is the driving factor this market.
              • acquired Schoology is the driving factor this market.
              • which is a learning management system (LMS) provider. Such offerings from the technology companies strengthen the digital platforms with enhanced content and the availability of learning solutions. Thus is the driving factor this market.
              • these mergers and acquisitions are helping education technology companies constantly improve the education content and increase their product offerings. Such digital transformation is responsible for the larger reach of education in North Americ school market. Furthermore is the driving factor this market.
              • digital transformation allows for more interactive and engaging learning experiences. Multimedia content is the driving factor this market.
              • gamification is the driving factor this market.
              • and virtual simulations capture students interest and cater to diverse learning styles. Thus is the driving factor this market.
              • as digital transformation is necessary for reshaping the education landscape is the driving factor this market.
              • making it more dynamic is the driving factor this market.
              • adaptive is the driving factor this market.
              • and responsive to the evolving needs of students and educators is the driving factor this market.
              • it is expected to drive the school market in North America during the forecast period. is the driving factor this market.

              The Schoolin North America market vendors should focus on grabbing business opportunities from the Public segment as it accounted for the largest market share in the base year.
              RIA - Research AI Assistant
              Ask RIA