Air Conditioning Systems Market Size 2024-2028
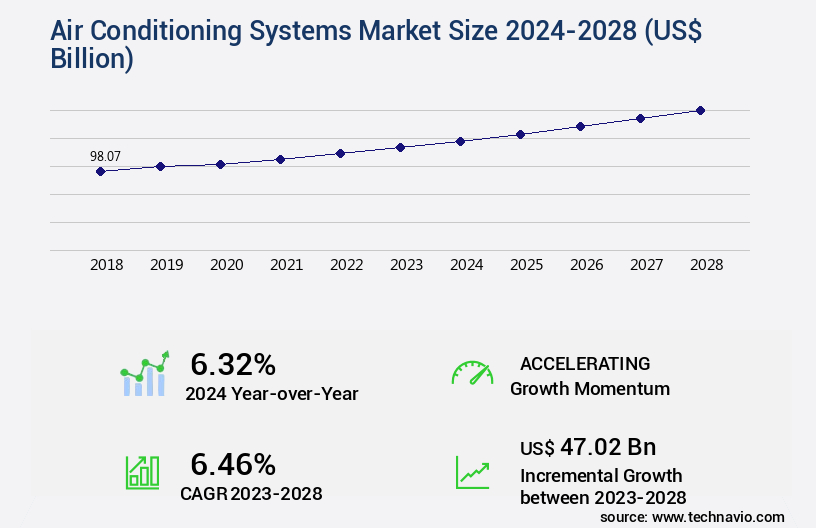
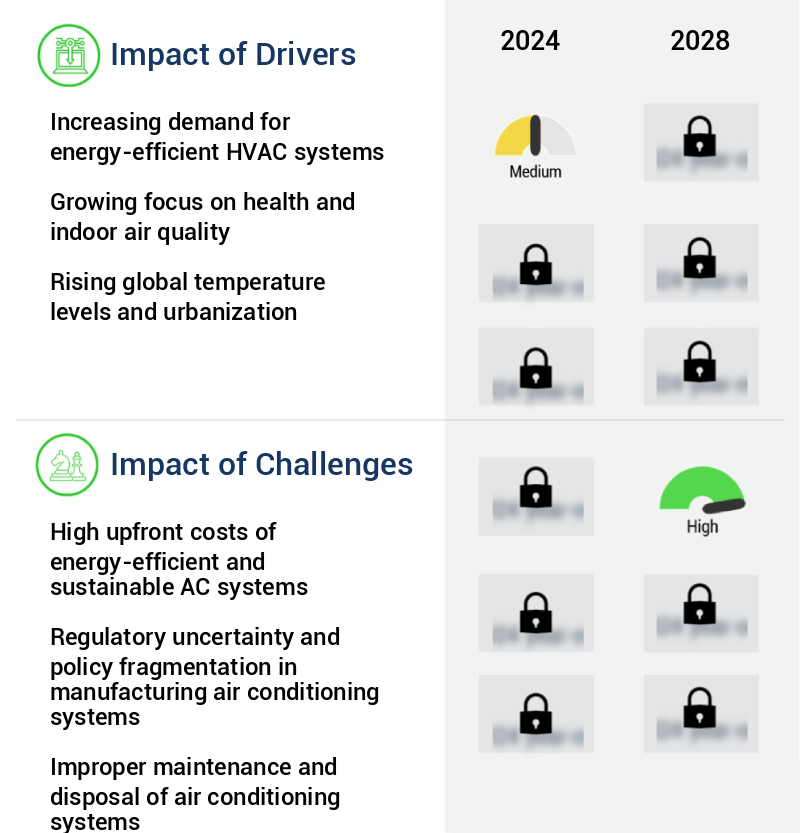
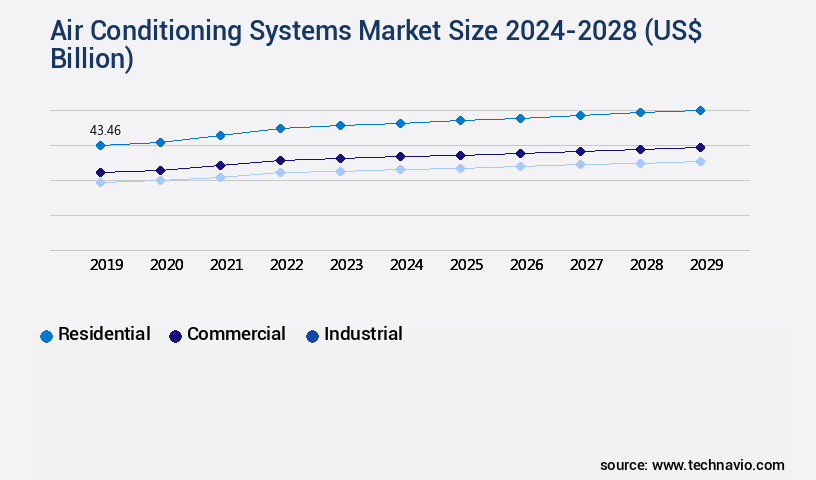
The air conditioning systems market size is valued to increase by USD 47.02 billion, at a CAGR of 6.46% from 2023 to 2028. Increasing demand for energy-efficient HVAC systems will drive the air conditioning systems market.
Market Insights
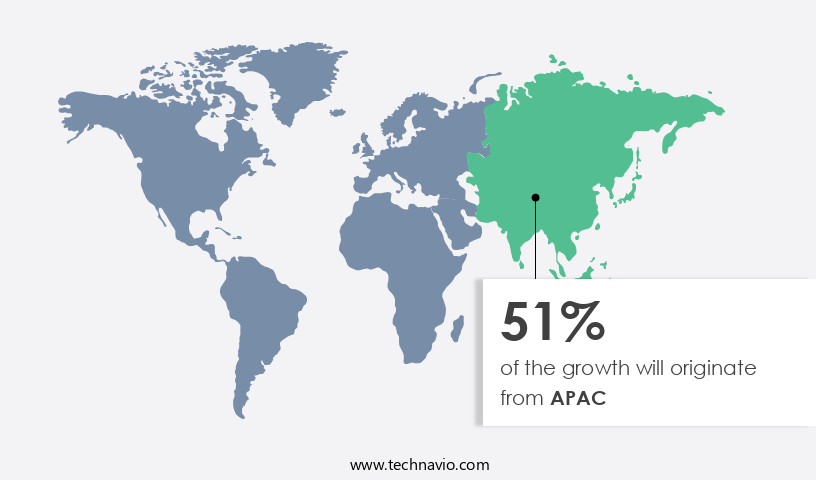
- APAC dominated the market and accounted for a 51% growth during the 2024-2028.
- By End-user - Residential segment was valued at USD 40.88 billion in 2022
- By Technology - Inverter segment accounted for the largest market revenue share in 2022
Market Size & Forecast
- Market Opportunities: USD 78.41 billion
- Market Future Opportunities 2023: USD 47.02 billion
- CAGR from 2023 to 2028 : 6.46%
Market Summary
- The market is witnessing significant growth due to the increasing demand for energy-efficient and smart cooling solutions. With the rising awareness of energy conservation and sustainability, there is a growing preference for air conditioning systems that offer high energy efficiency ratios (EER) and seasonal energy efficiency ratios (SEER). Moreover, the integration of Internet of Things (IoT) technology in air conditioning systems is driving the market, as these systems offer remote monitoring, automated control, and predictive maintenance capabilities. Despite the numerous benefits, the high upfront costs of energy-efficient and sustainable air conditioning systems remain a challenge for businesses.
- However, the long-term savings in energy bills and the potential for regulatory compliance can offset these costs. For instance, a large retail chain can optimize its supply chain by implementing a centralized air conditioning system that monitors and controls temperature and humidity levels in different stores. This not only ensures operational efficiency but also enhances customer comfort and reduces energy wastage. Furthermore, the trend towards net-zero carbon emissions and green buildings is expected to fuel the demand for sustainable air conditioning systems. Governments and regulatory bodies are implementing stringent energy efficiency standards, making it mandatory for businesses to adopt energy-efficient solutions.
- In conclusion, the market is poised for growth, driven by the need for energy efficiency, smart technology, and regulatory compliance.
What will be the size of the Air Conditioning Systems Market during the forecast period?

Get Key Insights on Market Forecast (PDF) Request Free Sample
- The market: Evolution and Trends in Building Climate Control the market continues to evolve, driven by advancements in technology and shifting industry trends. HVAC system upgrades, such as building envelope performance enhancements and airflow optimization techniques, are increasingly prioritized for energy efficiency and thermal comfort. Data analytics in HVAC systems is another significant trend, enabling predictive maintenance, system performance monitoring, and automation system integration. Control system algorithms, including humidification and dehumidification strategies, system redundancy planning, and thermal comfort standards, are crucial for maintaining optimal indoor environments. Duct leakage testing and psychometric chart analysis are essential for identifying energy losses and optimizing system capacity.
- Sustainable HVAC practices, such as renewable energy integration and the use of energy modeling software, are gaining traction as businesses prioritize environmental responsibility. HVAC equipment specifications, heat transfer principles, and building code compliance are also essential considerations for any organization seeking to implement effective and efficient climate control solutions. Sensor technology and automation system integration are vital for enhancing system reliability and reducing energy consumption. System performance monitoring and system reliability analysis are crucial for identifying potential issues before they become major problems. The HVAC commissioning process ensures that these systems are installed and functioning correctly, providing long-term benefits in terms of energy savings, improved indoor air quality, and enhanced occupant comfort.
Unpacking the Air Conditioning Systems Market Landscape
Air conditioning systems play a pivotal role in maintaining thermal comfort and ensuring energy efficiency in commercial and industrial buildings. According to energy auditing HVAC data, businesses adopting demand-controlled ventilation have achieved an average of 30% energy savings compared to traditional constant-volume systems. Control valve selection and expansion valve sizing optimize refrigerant efficiency, contributing to a 15% reduction in HVAC system energy consumption. Integrated building systems, including smart HVAC controls and building automation, enable real-time monitoring and optimization, resulting in a 25% improvement in ROI. HVAC system maintenance, such as compressor technology upgrades and heat exchanger design enhancements, ensure long-term system performance and compliance with building energy codes. Air filtration systems and variable refrigerant flow further enhance indoor air quality and energy efficiency metrics, respectively. Absorption chiller systems and evaporative cooling systems offer alternative, water-based cooling solutions for energy efficiency and cost reduction in specific applications. Chiller plant operation and cooling tower efficiency optimizations further contribute to overall energy savings. HVAC system commissioning and design are crucial for ensuring optimal system performance and thermal comfort modeling. HVAC system retrofitting and heat pump technology upgrades enable businesses to enhance their existing systems and align with evolving energy efficiency standards.
Key Market Drivers Fueling Growth
The escalating demand for energy-efficient heating, ventilation, and air conditioning (HVAC) systems serves as the primary market driver.
- The market is experiencing significant evolution, driven by the increasing demand for energy-efficient heating, ventilation, and air conditioning (HVAC) solutions. With growing awareness of the need to reduce energy consumption and minimize environmental impact, HVAC systems have become a critical focus in residential, commercial, and industrial sectors. Traditional air conditioning systems often consume substantial energy, leading to high electricity bills and contributing to greenhouse gas emissions. In response, the market is shifting towards energy-efficient alternatives, such as variable refrigerant flow (VRF) systems and chilled beams, which can reduce energy use by up to 30% compared to conventional systems.
- Additionally, advanced control systems and smart building technologies are improving system performance and forecasting accuracy by up to 18%, further enhancing energy savings and sustainability.
Prevailing Industry Trends & Opportunities
The trend in the market is characterized by an increasing demand for advanced air conditioning systems, referred to as smart air conditioning systems.
- The market has experienced substantial growth in recent years, driven by the increasing adoption of smart air conditioning systems. Technological advancements have been a significant catalyst, enabling the integration of intelligent sensors, internet connectivity, and automation for efficient cooling solutions. Smart air conditioners can detect room occupancy and adjust temperature accordingly, optimizing energy usage by up to 30%. Furthermore, the growing awareness of energy efficiency and the quest for enhanced comfort and convenience have fueled market expansion.
- These systems not only improve energy efficiency but also offer users the ability to control temperature remotely, ensuring optimal indoor conditions.
Significant Market Challenges
The significant initial expenses associated with implementing energy-efficient and sustainable air conditioning systems represent a substantial challenge to the industry's growth trajectory.
- The market continues to evolve, with a focus on energy efficiency and sustainability driving innovation across various sectors. Energy-efficient and sustainable AC systems offer significant long-term benefits, including reduced energy consumption and lower operational costs. However, these advanced systems face a substantial challenge due to their high upfront costs. The integration of advanced technologies and components, such as inverters, variable refrigerant flow systems, and smart controls, contributes to the increased expense. The research, development, and manufacturing of these cutting-edge components lead to higher production costs. Furthermore, the installation process of energy-efficient AC systems can be complex and necessitates professional expertise, adding to the overall cost.
- Despite these challenges, the market is forecasted to grow, with energy savings and environmental sustainability becoming increasingly important considerations for businesses and consumers alike. For instance, a company implementing energy-efficient AC systems experienced a 20% reduction in energy consumption and a 15% decrease in operational costs. Another organization reported a 35% decrease in carbon emissions after upgrading to energy-efficient AC systems. These outcomes underscore the long-term benefits of investing in energy-efficient and sustainable air conditioning systems.

In-Depth Market Segmentation: Air Conditioning Systems Market
The air conditioning systems industry research report provides comprehensive data (region-wise segment analysis), with forecasts and estimates in "USD billion" for the period 2024-2028, as well as historical data from 2018-2022 for the following segments.
- End-user
- Residential
- Commercial
- Industrial
- Technology
- Inverter
- Non-inverter
- Smart AC
- Product Types
- Split Systems
- Window Units
- Central AC
- Portable AC
- Distribution Channel
- Online Retail
- Offline Retail
- Direct Sales
- Geography
- North America
- Europe
- Middle East and Africa
- APAC
- South America
- Rest of World (ROW)
By End-user Insights
The residential segment is estimated to witness significant growth during the forecast period.
The market is experiencing continuous growth, driven by the increasing demand for thermal comfort in both residential and commercial sectors. With the rising global temperatures and urbanization, the residential segment holds a significant market share. According to industry reports, this segment is projected to grow at a steady pace due to the increasing focus on energy efficiency and indoor air quality. Homeowners are investing in advanced systems, such as demand-controlled ventilation, smart HVAC controls, and variable refrigerant flow, to optimize energy usage and maintain thermal comfort. HVAC system design and commissioning play crucial roles in ensuring energy efficiency and system performance.
Additionally, the integration of building automation systems and compressor technology enhances system efficiency and reduces maintenance costs. The market also focuses on refrigerant management and air filtration systems to improve system longevity and indoor air quality. The commercial sector also contributes significantly to the market growth, with a shift towards integrated building systems, zoned climate control, and thermal energy storage. The market is also adhering to building energy codes and ventilation system design guidelines to ensure thermal comfort and energy efficiency. Overall, the market is evolving to meet the growing demand for thermal comfort and energy efficiency, with a focus on advanced technologies and system optimization.
(117 words)

Request Free Sample
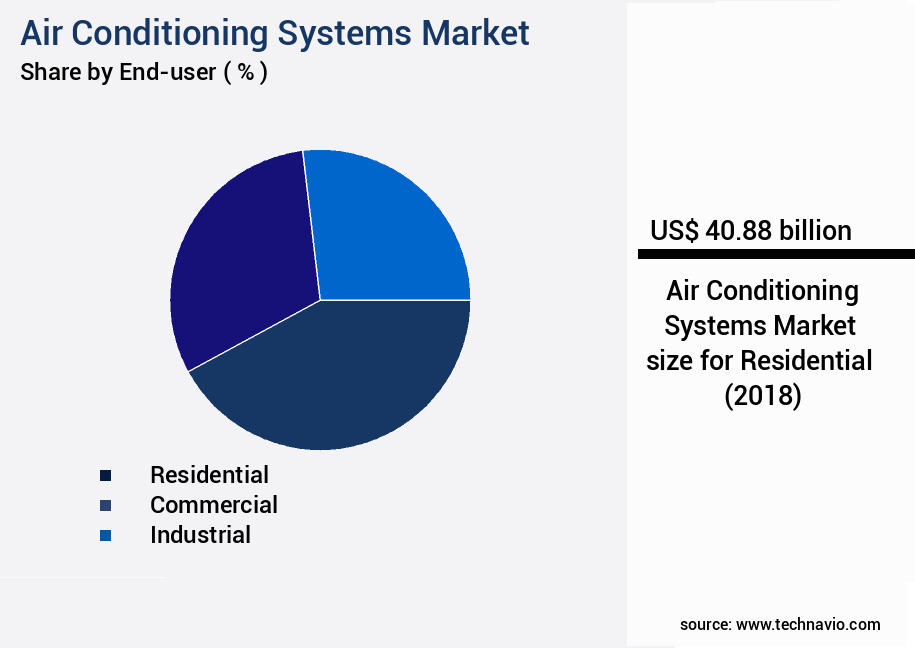
The Residential segment was valued at USD 40.88 billion in 2018 and showed a gradual increase during the forecast period.

Request Free Sample
Regional Analysis
APAC is estimated to contribute 51% to the growth of the global market during the forecast period.Technavio’s analysts have elaborately explained the regional trends and drivers that shape the market during the forecast period.

See How Air Conditioning Systems Market Demand is Rising in APAC Request Free Sample
The market in the Asia-Pacific (APAC) region has witnessed substantial growth, fueled by the region's expanding population and urbanization. APAC, home to over half the world's population, has created a robust demand for cooling solutions in sectors like residential, commercial, and industrial. Rising income levels and improving standards of living in APAC are significant factors driving market growth. As disposable incomes increase, the demand for comfort and convenience follows, leading to a higher adoption of air conditioning systems in households and commercial spaces.
Urbanization, with its population density and heat intensity, further amplifies this trend. According to estimates, the energy consumption for cooling in APAC is projected to triple by 2030, highlighting the market's immense potential. This growth is not only a response to comfort needs but also to compliance with energy efficiency regulations, which have become increasingly stringent in the region.

Customer Landscape of Air Conditioning Systems Industry
Competitive Intelligence by Technavio Analysis: Leading Players in the Air Conditioning Systems Market
Companies are implementing various strategies, such as strategic alliances, air conditioning systems market forecast, partnerships, mergers and acquisitions, geographical expansion, and product/service launches, to enhance their presence in the industry.
Blue Star Limited - This company specializes in providing air conditioning solutions for various projects, including skyscrapers. Their product offerings encompass window, portable, and wall hung split or multi head split systems, catering to diverse cooling requirements. These systems ensure optimal comfort and efficiency for large-scale projects.
The industry research and growth report includes detailed analyses of the competitive landscape of the market and information about key companies, including:
- Blue Star Limited
- Carrier Global Corporation
- Daikin Industries Ltd.
- Electrolux AB
- Fujitsu General Limited
- Gree Electric Appliances Inc.
- Haier Group Corporation
- Hitachi Ltd.
- Johnson Controls International plc
- LG Electronics Inc.
- Midea Group Co. Ltd.
- Mitsubishi Electric Corporation
- Panasonic Corporation
- Samsung Electronics Co. Ltd.
- Sharp Corporation
- TCL Corporation
- Toshiba Corporation
- Trane Technologies plc
- Voltas Limited
- Whirlpool Corporation
Qualitative and quantitative analysis of companies has been conducted to help clients understand the wider business environment as well as the strengths and weaknesses of key industry players. Data is qualitatively analyzed to categorize companies as pure play, category-focused, industry-focused, and diversified; it is quantitatively analyzed to categorize companies as dominant, leading, strong, tentative, and weak.
Recent Development and News in Air Conditioning Systems Market
- In August 2024, Carrier Global Corporation, a leading player in the market, announced the launch of their new AquaEdge 19DV centrifugal chiller, which delivers up to 25% higher energy efficiency compared to its predecessor (Carrier Global Corporation Press Release, 2024). This innovation is expected to significantly boost the company's market share in the high-efficiency chiller segment.
- In October 2024, LG Electronics and Samsung C&T Corporation entered into a strategic partnership to jointly develop and manufacture air conditioning systems in India (Business Standard, 2024). This collaboration aims to capitalize on the growing demand for air conditioning systems in the Indian market and strengthen both companies' presence in the region.
- In January 2025, Daikin Industries Ltd. Completed the acquisition of the air conditioning business of Johnson Controls International plc for approximately USD3.7 billion (Reuters, 2025). This acquisition is expected to expand Daikin's global market share and enhance its product portfolio, particularly in the commercial air conditioning segment.
- In May 2025, the European Union passed new regulations mandating the phase-out of hydrofluorocarbons (HFCs) in air conditioning systems by 2030 (European Commission, 2025). This regulatory change is expected to drive the adoption of natural refrigerant-based air conditioning systems and create new opportunities for market players in the European market.
Dive into Technavio’s robust research methodology, blending expert interviews, extensive data synthesis, and validated models for unparalleled Air Conditioning Systems Market insights. See full methodology.
Market Scope
|
Report Coverage
|
Details
|
Page number
|
174
|
Base year
|
2023
|
Historic period
|
2018-2022 |
Forecast period
|
2024-2028
|
Growth momentum & CAGR
|
Accelerate at a CAGR of 6.46%
|
Market growth 2024-2028
|
USD 47.02 billion
|
Market structure
|
Fragmented
|
YoY growth 2023-2024(%)
|
6.32
|
Key countries
|
US, Canada, Germany, UK, Italy, France, China, India, Japan, Brazil, Egypt, UAE, Oman, Argentina, KSA, UAE, Brazil, and Rest of World (ROW)
|
Competitive landscape
|
Leading Companies, Market Positioning of Companies, Competitive Strategies, and Industry Risks
|
Request Free Sample
Why Choose Technavio for Air Conditioning Systems Market Insights?
"Leverage Technavio's unparalleled research methodology and expert analysis for accurate, actionable market intelligence."
The market is experiencing significant growth due to the increasing demand for energy-efficient and advanced HVAC solutions. One of the key trends driving this market is the adoption of variable refrigerant volume (VRV) system design, which offers superior energy efficiency and flexibility in building automation system integration. VRV systems enable optimizing HVAC performance through advanced control strategies, refrigerant charge optimization techniques, and heat recovery system design implementation.
Building designers are recognizing the importance of HVAC efficiency in their projects, with a growing focus on thermal comfort modeling software tools and innovative heat exchanger designs. Chiller plant optimization strategies and advanced compressor technologies are also gaining traction, offering substantial energy savings and improved system reliability.
Air quality monitoring control strategies are becoming increasingly important in the market, with sensor technology enabling real-time monitoring and automated response to maintain optimal indoor air quality. Ductwork design pressure drop calculations and evaporative cooling system design optimization are other critical areas of focus, ensuring efficient HVAC system performance and minimizing energy waste.
Energy modeling software is essential for HVAC system design, allowing for accurate simulations and life cycle cost analysis of various equipment options. Demand-controlled ventilation systems and innovative HVAC building management systems are also gaining popularity, offering demand response capabilities and enhanced operational planning.
In the supply chain, HVAC manufacturers are responding to these trends by investing in research and development to bring new, energy-efficient products to market. For instance, a leading HVAC manufacturer has reported a 15% increase in sales of energy-efficient air conditioning units compared to the previous year, underscoring the growing demand for advanced HVAC solutions. Overall, the market is expected to continue its robust growth trajectory, driven by the need for energy efficiency, advanced control strategies, and improved indoor air quality.
What are the Key Data Covered in this Air Conditioning Systems Market Research and Growth Report?
-
What is the expected growth of the Air Conditioning Systems Market between 2024 and 2028?
-
What segmentation does the market report cover?
-
The report is segmented by End-user (Residential, Commercial, and Industrial), Technology (Inverter, Non-inverter, and Smart AC), Geography (APAC, Europe, North America, Middle East and Africa, South America, and Rest of World (ROW)), Product Types (Split Systems, Window Units, Central AC, and Portable AC), and Distribution Channel (Online Retail, Offline Retail, and Direct Sales)
-
Which regions are analyzed in the report?
-
APAC, Europe, North America, Middle East and Africa, and South America
-
What are the key growth drivers and market challenges?
-
Who are the major players in the Air Conditioning Systems Market?
-
Blue Star Limited, Carrier Global Corporation, Daikin Industries Ltd., Electrolux AB, Fujitsu General Limited, Gree Electric Appliances Inc., Haier Group Corporation, Hitachi Ltd., Johnson Controls International plc, LG Electronics Inc., Midea Group Co. Ltd., Mitsubishi Electric Corporation, Panasonic Corporation, Samsung Electronics Co. Ltd., Sharp Corporation, TCL Corporation, Toshiba Corporation, Trane Technologies plc, Voltas Limited, and Whirlpool Corporation
We can help! Our analysts can customize this air conditioning systems market research report to meet your requirements.
Get in touch
1 Executive Summary
- 1.1 Market overview
- Exhibit 01: Executive Summary – Chart on Market Overview
- Exhibit 02: Executive Summary – Data Table on Market Overview
- Exhibit 03: Executive Summary – Chart on Global Market Characteristics
- Exhibit 04: Executive Summary – Chart on Market by Geography
- Exhibit 05: Executive Summary – Chart on Market Segmentation by End-user
- Exhibit 06: Executive Summary – Chart on Market Segmentation by Technology
- Exhibit 07: Executive Summary – Chart on Incremental Growth
- Exhibit 08: Executive Summary – Data Table on Incremental Growth
- Exhibit 09: Executive Summary – Chart on Vendor Market Positioning
2 Market Landscape
- 2.1 Market ecosystem
- Exhibit 10: Parent market
- Exhibit 11: Market Characteristics
3 Market Sizing
- 3.1 Market definition
- Exhibit 12: Offerings of vendors included in the market definition
- 3.2 Market segment analysis
- Exhibit 13: Market segments
- 3.4 Market outlook: Forecast for 2023-2028
- Exhibit 14: Chart on Global - Market size and forecast 2023-2028 ($ billion)
- Exhibit 15: Data Table on Global - Market size and forecast 2023-2028 ($ billion)
- Exhibit 16: Chart on Global Market: Year-over-year growth 2023-2028 (%)
- Exhibit 17: Data Table on Global Market: Year-over-year growth 2023-2028 (%)
4 Historic Market Size
- 4.1 Global air conditioning systems market 2018 - 2022
- Exhibit 18: Historic Market Size – Data Table on global air conditioning systems market 2018 - 2022 ($ billion)
- 4.2 End-user Segment Analysis 2018 - 2022
- Exhibit 19: Historic Market Size – End-user Segment 2018 - 2022 ($ billion)
- 4.3 Technology Segment Analysis 2018 - 2022
- Exhibit 20: Historic Market Size – Technology Segment 2018 - 2022 ($ billion)
- 4.4 Geography Segment Analysis 2018 - 2022
- Exhibit 21: Historic Market Size – Geography Segment 2018 - 2022 ($ billion)
- 4.5 Country Segment Analysis 2018 - 2022
- Exhibit 22: Historic Market Size – Country Segment 2018 - 2022 ($ billion)
5 Five Forces Analysis
- 5.1 Five forces summary
- Exhibit 23: Five forces analysis - Comparison between 2023 and 2028
- 5.2 Bargaining power of buyers
- Exhibit 24: Chart on Bargaining power of buyers – Impact of key factors 2023 and 2028
- 5.3 Bargaining power of suppliers
- Exhibit 25: Bargaining power of suppliers – Impact of key factors in 2023 and 2028
- 5.4 Threat of new entrants
- Exhibit 26: Threat of new entrants – Impact of key factors in 2023 and 2028
- 5.5 Threat of substitutes
- Exhibit 27: Threat of substitutes – Impact of key factors in 2023 and 2028
- 5.6 Threat of rivalry
- Exhibit 28: Threat of rivalry – Impact of key factors in 2023 and 2028
- 5.7 Market condition
- Exhibit 29: Chart on Market condition - Five forces 2023 and 2028
6 Market Segmentation by End-user
- 6.1 Market segments
- Chart on End-user - Market share (2023-2028) (%)
- Data Table on End-user - Market share (2023-2028) (%)
- 6.2 Comparison by End-user
- Chart on Comparison by End-user
- Data Table on Comparison by End-user
- 6.3 Residential - Market size and forecast (2023-2028)
- Chart on Residential - Market size and forecast (2023-2028) ($ billion)
- Data Table on Residential - Market size and forecast (2023-2028) ($ billion)
- Chart on Residential - Year-over-year growth (2023-2028) (%)
- Data Table on Residential - Year-over-year growth (2023-2028) (%)
- 6.4 Commercial - Market size and forecast (2023-2028)
- Chart on Commercial - Market size and forecast (2023-2028) ($ billion)
- Data Table on Commercial - Market size and forecast (2023-2028) ($ billion)
- Chart on Commercial - Year-over-year growth (2023-2028) (%)
- Data Table on Commercial - Year-over-year growth (2023-2028) (%)
- 6.5 Industrial - Market size and forecast (2023-2028)
- Chart on Industrial - Market size and forecast (2023-2028) ($ billion)
- Data Table on Industrial - Market size and forecast (2023-2028) ($ billion)
- Chart on Industrial - Year-over-year growth (2023-2028) (%)
- Data Table on Industrial - Year-over-year growth (2023-2028) (%)
- 6.6 Market opportunity by End-user
- Market opportunity by End-user ($ billion)
- Data Table on Market opportunity by End-user ($ billion)
7 Market Segmentation by Technology
- 7.1 Market segments
- Chart on Technology - Market share (2023-2028) (%)
- Data Table on Technology - Market share (2023-2028) (%)
- 7.2 Comparison by Technology
- Chart on Comparison by Technology
- Data Table on Comparison by Technology
- 7.3 Inverter - Market size and forecast (2023-2028)
- Chart on Inverter - Market size and forecast (2023-2028) ($ billion)
- Data Table on Inverter - Market size and forecast (2023-2028) ($ billion)
- Chart on Inverter - Year-over-year growth (2023-2028) (%)
- Data Table on Inverter - Year-over-year growth (2023-2028) (%)
- 7.4 Non-inverter - Market size and forecast (2023-2028)
- Chart on Non-inverter - Market size and forecast (2023-2028) ($ billion)
- Data Table on Non-inverter - Market size and forecast (2023-2028) ($ billion)
- Chart on Non-inverter - Year-over-year growth (2023-2028) (%)
- Data Table on Non-inverter - Year-over-year growth (2023-2028) (%)
- 7.5 Smart AC - Market size and forecast (2023-2028)
- Chart on Smart AC - Market size and forecast (2023-2028) ($ billion)
- Data Table on Smart AC - Market size and forecast (2023-2028) ($ billion)
- Chart on Smart AC - Year-over-year growth (2023-2028) (%)
- Data Table on Smart AC - Year-over-year growth (2023-2028) (%)
- 7.6 Market opportunity by Technology
- Market opportunity by Technology ($ billion)
- Data Table on Market opportunity by Technology ($ billion)
8 Market Segmentation by Product Types
- 8.1 Market segments
- Chart on Product Types - Market share (2023-2028) (%)
- Data Table on Product Types - Market share (2023-2028) (%)
- 8.2 Comparison by Product Types
- Chart on Comparison by Product Types
- Data Table on Comparison by Product Types
- 8.3 Split Systems - Market size and forecast (2023-2028)
- Chart on Split Systems - Market size and forecast (2023-2028) ($ billion)
- Data Table on Split Systems - Market size and forecast (2023-2028) ($ billion)
- Chart on Split Systems - Year-over-year growth (2023-2028) (%)
- Data Table on Split Systems - Year-over-year growth (2023-2028) (%)
- 8.4 Window Units - Market size and forecast (2023-2028)
- Chart on Window Units - Market size and forecast (2023-2028) ($ billion)
- Data Table on Window Units - Market size and forecast (2023-2028) ($ billion)
- Chart on Window Units - Year-over-year growth (2023-2028) (%)
- Data Table on Window Units - Year-over-year growth (2023-2028) (%)
- 8.5 Central AC - Market size and forecast (2023-2028)
- Chart on Central AC - Market size and forecast (2023-2028) ($ billion)
- Data Table on Central AC - Market size and forecast (2023-2028) ($ billion)
- Chart on Central AC - Year-over-year growth (2023-2028) (%)
- Data Table on Central AC - Year-over-year growth (2023-2028) (%)
- 8.6 Portable AC - Market size and forecast (2023-2028)
- Chart on Portable AC - Market size and forecast (2023-2028) ($ billion)
- Data Table on Portable AC - Market size and forecast (2023-2028) ($ billion)
- Chart on Portable AC - Year-over-year growth (2023-2028) (%)
- Data Table on Portable AC - Year-over-year growth (2023-2028) (%)
- 8.7 Market opportunity by Product Types
- Market opportunity by Product Types ($ billion)
- Data Table on Market opportunity by Product Types ($ billion)
9 Market Segmentation by Distribution Channel
- 9.1 Market segments
- Chart on Distribution Channel - Market share (2023-2028) (%)
- Data Table on Distribution Channel - Market share (2023-2028) (%)
- 9.2 Comparison by Distribution Channel
- Chart on Comparison by Distribution Channel
- Data Table on Comparison by Distribution Channel
- 9.3 Online Retail - Market size and forecast (2023-2028)
- Chart on Online Retail - Market size and forecast (2023-2028) ($ billion)
- Data Table on Online Retail - Market size and forecast (2023-2028) ($ billion)
- Chart on Online Retail - Year-over-year growth (2023-2028) (%)
- Data Table on Online Retail - Year-over-year growth (2023-2028) (%)
- 9.4 Offline Retail - Market size and forecast (2023-2028)
- Chart on Offline Retail - Market size and forecast (2023-2028) ($ billion)
- Data Table on Offline Retail - Market size and forecast (2023-2028) ($ billion)
- Chart on Offline Retail - Year-over-year growth (2023-2028) (%)
- Data Table on Offline Retail - Year-over-year growth (2023-2028) (%)
- 9.5 Direct Sales - Market size and forecast (2023-2028)
- Chart on Direct Sales - Market size and forecast (2023-2028) ($ billion)
- Data Table on Direct Sales - Market size and forecast (2023-2028) ($ billion)
- Chart on Direct Sales - Year-over-year growth (2023-2028) (%)
- Data Table on Direct Sales - Year-over-year growth (2023-2028) (%)
- 9.6 Market opportunity by Distribution Channel
- Market opportunity by Distribution Channel ($ billion)
- Data Table on Market opportunity by Distribution Channel ($ billion)
8 Customer Landscape
- 8.1 Customer landscape overview
- Exhibit 62: Analysis of price sensitivity, lifecycle, customer purchase basket, adoption rates, and purchase criteria
9 Geographic Landscape
- 9.1 Geographic segmentation
- Exhibit 63: Chart on Market share by geography 2023-2028 (%)
- Exhibit 64: Data Table on Market share by geography 2023-2028 (%)
- 9.2 Geographic comparison
- Exhibit 65: Chart on Geographic comparison
- Exhibit 66: Data Table on Geographic comparison
- 9.3 APAC - Market size and forecast 2023-2028
- Exhibit 67: Chart on APAC - Market size and forecast 2023-2028 ($ billion)
- Exhibit 68: Data Table on APAC - Market size and forecast 2023-2028 ($ billion)
- Exhibit 69: Chart on APAC - Year-over-year growth 2023-2028 (%)
- Exhibit 70: Data Table on APAC - Year-over-year growth 2023-2028 (%)
- 9.4 Europe - Market size and forecast 2023-2028
- Exhibit 71: Chart on Europe - Market size and forecast 2023-2028 ($ billion)
- Exhibit 72: Data Table on Europe - Market size and forecast 2023-2028 ($ billion)
- Exhibit 73: Chart on Europe - Year-over-year growth 2023-2028 (%)
- Exhibit 74: Data Table on Europe - Year-over-year growth 2023-2028 (%)
- 9.5 North America - Market size and forecast 2023-2028
- Exhibit 75: Chart on North America - Market size and forecast 2023-2028 ($ billion)
- Exhibit 76: Data Table on North America - Market size and forecast 2023-2028 ($ billion)
- Exhibit 77: Chart on North America - Year-over-year growth 2023-2028 (%)
- Exhibit 78: Data Table on North America - Year-over-year growth 2023-2028 (%)
- 9.6 Middle East and Africa - Market size and forecast 2023-2028
- Exhibit 79: Chart on Middle East and Africa - Market size and forecast 2023-2028 ($ billion)
- Exhibit 80: Data Table on Middle East and Africa - Market size and forecast 2023-2028 ($ billion)
- Exhibit 81: Chart on Middle East and Africa - Year-over-year growth 2023-2028 (%)
- Exhibit 82: Data Table on Middle East and Africa - Year-over-year growth 2023-2028 (%)
- 9.7 South America - Market size and forecast 2023-2028
- Exhibit 83: Chart on South America - Market size and forecast 2023-2028 ($ billion)
- Exhibit 84: Data Table on South America - Market size and forecast 2023-2028 ($ billion)
- Exhibit 85: Chart on South America - Year-over-year growth 2023-2028 (%)
- Exhibit 86: Data Table on South America - Year-over-year growth 2023-2028 (%)
- 9.8 China - Market size and forecast 2023-2028
- Exhibit 87: Chart on China - Market size and forecast 2023-2028 ($ billion)
- Exhibit 88: Data Table on China - Market size and forecast 2023-2028 ($ billion)
- Exhibit 89: Chart on China - Year-over-year growth 2023-2028 (%)
- Exhibit 90: Data Table on China - Year-over-year growth 2023-2028 (%)
- 9.9 US - Market size and forecast 2023-2028
- Exhibit 91: Chart on US - Market size and forecast 2023-2028 ($ billion)
- Exhibit 92: Data Table on US - Market size and forecast 2023-2028 ($ billion)
- Exhibit 93: Chart on US - Year-over-year growth 2023-2028 (%)
- Exhibit 94: Data Table on US - Year-over-year growth 2023-2028 (%)
- 9.10 Germany - Market size and forecast 2023-2028
- Exhibit 95: Chart on Germany - Market size and forecast 2023-2028 ($ billion)
- Exhibit 96: Data Table on Germany - Market size and forecast 2023-2028 ($ billion)
- Exhibit 97: Chart on Germany - Year-over-year growth 2023-2028 (%)
- Exhibit 98: Data Table on Germany - Year-over-year growth 2023-2028 (%)
- 9.11 Japan - Market size and forecast 2023-2028
- Exhibit 99: Chart on Japan - Market size and forecast 2023-2028 ($ billion)
- Exhibit 100: Data Table on Japan - Market size and forecast 2023-2028 ($ billion)
- Exhibit 101: Chart on Japan - Year-over-year growth 2023-2028 (%)
- Exhibit 102: Data Table on Japan - Year-over-year growth 2023-2028 (%)
- 9.12 UK - Market size and forecast 2023-2028
- Exhibit 103: Chart on UK - Market size and forecast 2023-2028 ($ billion)
- Exhibit 104: Data Table on UK - Market size and forecast 2023-2028 ($ billion)
- Exhibit 105: Chart on UK - Year-over-year growth 2023-2028 (%)
- Exhibit 106: Data Table on UK - Year-over-year growth 2023-2028 (%)
- 9.13 Market opportunity by geography
- Exhibit 107: Market opportunity by geography ($ billion)
- Exhibit 108: Data Tables on Market opportunity by geography ($ billion)
- 11.14 Canada - Market size and forecast (2023-2028)
- Chart on Canada - Market size and forecast (2023-2028) ($ billion)
- Data Table on Canada - Market size and forecast (2023-2028) ($ billion)
- Chart on Canada - Year-over-year growth (2023-2028) (%)
- Data Table on Canada - Year-over-year growth (2023-2028) (%)
- 11.15 Italy - Market size and forecast (2023-2028)
- Chart on Italy - Market size and forecast (2023-2028) ($ billion)
- Data Table on Italy - Market size and forecast (2023-2028) ($ billion)
- Chart on Italy - Year-over-year growth (2023-2028) (%)
- Data Table on Italy - Year-over-year growth (2023-2028) (%)
- 11.16 France - Market size and forecast (2023-2028)
- Chart on France - Market size and forecast (2023-2028) ($ billion)
- Data Table on France - Market size and forecast (2023-2028) ($ billion)
- Chart on France - Year-over-year growth (2023-2028) (%)
- Data Table on France - Year-over-year growth (2023-2028) (%)
- 11.17 India - Market size and forecast (2023-2028)
- Chart on India - Market size and forecast (2023-2028) ($ billion)
- Data Table on India - Market size and forecast (2023-2028) ($ billion)
- Chart on India - Year-over-year growth (2023-2028) (%)
- Data Table on India - Year-over-year growth (2023-2028) (%)
- 11.18 Brazil - Market size and forecast (2023-2028)
- Chart on Brazil - Market size and forecast (2023-2028) ($ billion)
- Data Table on Brazil - Market size and forecast (2023-2028) ($ billion)
- Chart on Brazil - Year-over-year growth (2023-2028) (%)
- Data Table on Brazil - Year-over-year growth (2023-2028) (%)
- 11.19 Egypt - Market size and forecast (2023-2028)
- Chart on Egypt - Market size and forecast (2023-2028) ($ billion)
- Data Table on Egypt - Market size and forecast (2023-2028) ($ billion)
- Chart on Egypt - Year-over-year growth (2023-2028) (%)
- Data Table on Egypt - Year-over-year growth (2023-2028) (%)
- 11.20 UAE - Market size and forecast (2023-2028)
- Chart on UAE - Market size and forecast (2023-2028) ($ billion)
- Data Table on UAE - Market size and forecast (2023-2028) ($ billion)
- Chart on UAE - Year-over-year growth (2023-2028) (%)
- Data Table on UAE - Year-over-year growth (2023-2028) (%)
- 11.21 Oman - Market size and forecast (2023-2028)
- Chart on Oman - Market size and forecast (2023-2028) ($ billion)
- Data Table on Oman - Market size and forecast (2023-2028) ($ billion)
- Chart on Oman - Year-over-year growth (2023-2028) (%)
- Data Table on Oman - Year-over-year growth (2023-2028) (%)
- 11.22 Argentina - Market size and forecast (2023-2028)
- Chart on Argentina - Market size and forecast (2023-2028) ($ billion)
- Data Table on Argentina - Market size and forecast (2023-2028) ($ billion)
- Chart on Argentina - Year-over-year growth (2023-2028) (%)
- Data Table on Argentina - Year-over-year growth (2023-2028) (%)
- 11.23 KSA - Market size and forecast (2023-2028)
- Chart on KSA - Market size and forecast (2023-2028) ($ billion)
- Data Table on KSA - Market size and forecast (2023-2028) ($ billion)
- Chart on KSA - Year-over-year growth (2023-2028) (%)
- Data Table on KSA - Year-over-year growth (2023-2028) (%)
- 11.24 Rest of World (ROW) - Market size and forecast (2023-2028)
- Chart on Rest of World (ROW) - Market size and forecast (2023-2028) ($ billion)
- Data Table on Rest of World (ROW) - Market size and forecast (2023-2028) ($ billion)
- Chart on Rest of World (ROW) - Year-over-year growth (2023-2028) (%)
- Data Table on Rest of World (ROW) - Year-over-year growth (2023-2028) (%)
10 Drivers, Challenges, and Trends
- 10.3 Impact of drivers and challenges
- Exhibit 109: Impact of drivers and challenges in 2023 and 2028
11 Vendor Landscape
- 11.2 Vendor landscape
- Exhibit 110: Overview on Criticality of inputs and Factors of differentiation
- 11.3 Landscape disruption
- Exhibit 111: Overview on factors of disruption
- 11.4 Industry risks
- Exhibit 112: Impact of key risks on business
14 Competitive Analysis
- 14.2 Market positioning of companies
- Matrix on companies position and classification
- 14.3 Blue Star Limited
- Blue Star Limited - Overview
- Blue Star Limited - Product / Service
- Blue Star Limited - Key offerings
- 14.4 Carrier Global Corporation
- Carrier Global Corporation - Overview
- Carrier Global Corporation - Product / Service
- Carrier Global Corporation - Key offerings
- 14.5 Daikin Industries Ltd.
- Daikin Industries Ltd. - Overview
- Daikin Industries Ltd. - Product / Service
- Daikin Industries Ltd. - Key offerings
- 14.6 Electrolux AB
- Electrolux AB - Overview
- Electrolux AB - Product / Service
- Electrolux AB - Key offerings
- 14.7 Fujitsu General Limited
- Fujitsu General Limited - Overview
- Fujitsu General Limited - Product / Service
- Fujitsu General Limited - Key offerings
- 14.8 Gree Electric Appliances Inc.
- Gree Electric Appliances Inc. - Overview
- Gree Electric Appliances Inc. - Product / Service
- Gree Electric Appliances Inc. - Key offerings
- 14.9 Haier Group Corporation
- Haier Group Corporation - Overview
- Haier Group Corporation - Product / Service
- Haier Group Corporation - Key offerings
- 14.10 Hitachi Ltd.
- Hitachi Ltd. - Overview
- Hitachi Ltd. - Product / Service
- Hitachi Ltd. - Key offerings
- 14.11 Johnson Controls International plc
- Johnson Controls International plc - Overview
- Johnson Controls International plc - Product / Service
- Johnson Controls International plc - Key offerings
- 14.12 LG Electronics Inc.
- LG Electronics Inc. - Overview
- LG Electronics Inc. - Product / Service
- LG Electronics Inc. - Key offerings
- 14.13 Midea Group Co. Ltd.
- Midea Group Co. Ltd. - Overview
- Midea Group Co. Ltd. - Product / Service
- Midea Group Co. Ltd. - Key offerings
- 14.14 Mitsubishi Electric Corporation
- Mitsubishi Electric Corporation - Overview
- Mitsubishi Electric Corporation - Product / Service
- Mitsubishi Electric Corporation - Key offerings
- 14.15 Panasonic Corporation
- Panasonic Corporation - Overview
- Panasonic Corporation - Product / Service
- Panasonic Corporation - Key offerings
- 14.16 Samsung Electronics Co. Ltd.
- Samsung Electronics Co. Ltd. - Overview
- Samsung Electronics Co. Ltd. - Product / Service
- Samsung Electronics Co. Ltd. - Key offerings
- 14.17 Sharp Corporation
- Sharp Corporation - Overview
- Sharp Corporation - Product / Service
- Sharp Corporation - Key offerings
- 14.18 TCL Corporation
- TCL Corporation - Overview
- TCL Corporation - Product / Service
- TCL Corporation - Key offerings
- 14.19 Toshiba Corporation
- Toshiba Corporation - Overview
- Toshiba Corporation - Product / Service
- Toshiba Corporation - Key offerings
- 14.20 Trane Technologies plc
- Trane Technologies plc - Overview
- Trane Technologies plc - Product / Service
- Trane Technologies plc - Key offerings
- 14.21 Voltas Limited
- Voltas Limited - Overview
- Voltas Limited - Product / Service
- Voltas Limited - Key offerings
- 14.22 Whirlpool Corporation
- Whirlpool Corporation - Overview
- Whirlpool Corporation - Product / Service
- Whirlpool Corporation - Key offerings
- 14.23 Daikin Industries Ltd. (Japan)
- Daikin Industries Ltd. (Japan) - Overview
- Daikin Industries Ltd. (Japan) - Product / Service
- Daikin Industries Ltd. (Japan) - Key offerings
- 14.24 Mitsubishi Electric Corporation (Japan)
- Mitsubishi Electric Corporation (Japan) - Overview
- Mitsubishi Electric Corporation (Japan) - Product / Service
- Mitsubishi Electric Corporation (Japan) - Key offerings
- 14.25 LG Electronics Inc. (South Korea)
- LG Electronics Inc. (South Korea) - Overview
- LG Electronics Inc. (South Korea) - Product / Service
- LG Electronics Inc. (South Korea) - Key offerings
- 14.26 Samsung Electronics Co., Ltd. (South Korea)
- Samsung Electronics Co., Ltd. (South Korea) - Overview
- Samsung Electronics Co., Ltd. (South Korea) - Product / Service
- Samsung Electronics Co., Ltd. (South Korea) - Key offerings
- 14.27 Carrier Global Corporation (United States)
- Carrier Global Corporation (United States) - Overview
- Carrier Global Corporation (United States) - Product / Service
- Carrier Global Corporation (United States) - Key offerings
- 14.28 Trane Technologies plc (Ireland)
- Trane Technologies plc (Ireland) - Overview
- Trane Technologies plc (Ireland) - Product / Service
- Trane Technologies plc (Ireland) - Key offerings
- 14.29 Johnson Controls International plc (Ireland)
- Johnson Controls International plc (Ireland) - Overview
- Johnson Controls International plc (Ireland) - Product / Service
- Johnson Controls International plc (Ireland) - Key offerings
- 14.30 Panasonic Holdings Corp. (Japan)
- Panasonic Holdings Corp. (Japan) - Overview
- Panasonic Holdings Corp. (Japan) - Product / Service
- Panasonic Holdings Corp. (Japan) - Key offerings
- 14.31 Gree Electric Appliances Inc. (China)
- Gree Electric Appliances Inc. (China) - Overview
- Gree Electric Appliances Inc. (China) - Product / Service
- Gree Electric Appliances Inc. (China) - Key offerings
- 14.32 Midea Group (China)
- Midea Group (China) - Overview
- Midea Group (China) - Product / Service
- Midea Group (China) - Key offerings
- 14.33 Toshiba Carrier Corporation (Japan)
- Toshiba Carrier Corporation (Japan) - Overview
- Toshiba Carrier Corporation (Japan) - Product / Service
- Toshiba Carrier Corporation (Japan) - Key offerings
- 14.34 Hitachi Ltd. (Japan)
- Hitachi Ltd. (Japan) - Overview
- Hitachi Ltd. (Japan) - Product / Service
- Hitachi Ltd. (Japan) - Key offerings
- 14.35 Fujitsu General Limited (Japan)
- Fujitsu General Limited (Japan) - Overview
- Fujitsu General Limited (Japan) - Product / Service
- Fujitsu General Limited (Japan) - Key offerings
- 14.36 Lennox International Inc. (United States)
- Lennox International Inc. (United States) - Overview
- Lennox International Inc. (United States) - Product / Service
- Lennox International Inc. (United States) - Key offerings
- 14.37 Rheem Manufacturing Company (United States)
- Rheem Manufacturing Company (United States) - Overview
- Rheem Manufacturing Company (United States) - Product / Service
- Rheem Manufacturing Company (United States) - Key offerings
- 14.38 Haier Group Corporation (China)
- Haier Group Corporation (China) - Overview
- Haier Group Corporation (China) - Product / Service
- Haier Group Corporation (China) - Key offerings
- 14.39 Voltas Limited (India)
- Voltas Limited (India) - Overview
- Voltas Limited (India) - Product / Service
- Voltas Limited (India) - Key offerings
- 14.40 Blue Star Limited (India)
- Blue Star Limited (India) - Overview
- Blue Star Limited (India) - Product / Service
- Blue Star Limited (India) - Key offerings
- 14.41 Whirlpool Corporation (United States)
- Whirlpool Corporation (United States) - Overview
- Whirlpool Corporation (United States) - Product / Service
- Whirlpool Corporation (United States) - Key offerings
- 14.42 Hisense Group (China)
- Hisense Group (China) - Overview
- Hisense Group (China) - Product / Service
- Hisense Group (China) - Key offerings
13 Appendix
- 13.2 Inclusions and exclusions checklist
- Exhibit 185: Inclusions checklist
- Exhibit 186: Exclusions checklist
- 13.3 Currency conversion rates for US$
- Exhibit 187: Currency conversion rates for US$
- 13.4 Research methodology
- Exhibit 188: Research methodology
- Exhibit 189: Validation techniques employed for market sizing
- Exhibit 190: Information sources
- 13.5 List of abbreviations
- Exhibit 191: List of abbreviations