Slot Machine Market Analysis, Size, and Forecast 2026-2030: Europe (Italy, Germany, and UK), North America (US, Canada, and Mexico), APAC (China, Australia, and Japan), South America (Brazil and Argentina), Middle East and Africa (South Africa, UAE, and Turkey), and Rest of World (ROW)

Slot Machine Market Analysis, Size, and Forecast 2026-2030:
Europe (Italy, Germany, and UK), North America (US, Canada, and Mexico), APAC (China, Australia, and Japan), South America (Brazil and Argentina), Middle East and Africa (South Africa, UAE, and Turkey), and Rest of World (ROW)

Published: Mar 2026 292 Pages SKU: IRTNTR40412

Market Overview at a Glance

$6.52 B
Market Opportunity
14.5%
CAGR 2025 - 2030
36.2%
Europe Growth
$5.40 B
Casino segment 2024

Slot Machine Market Size 2026-2030

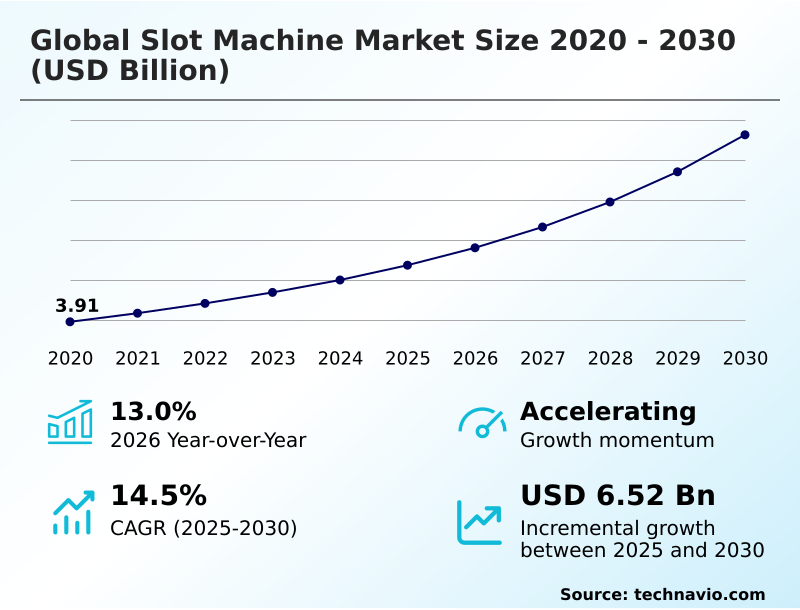
The slot machine market size is valued to increase by USD 6.52 billion, at a CAGR of 14.5% from 2025 to 2030. Platform convergence enabling omnichannel gaming experiences will drive the slot machine market.

Major Market Trends & Insights

  • Europe dominated the market and accounted for a 36.2% growth during the forecast period.
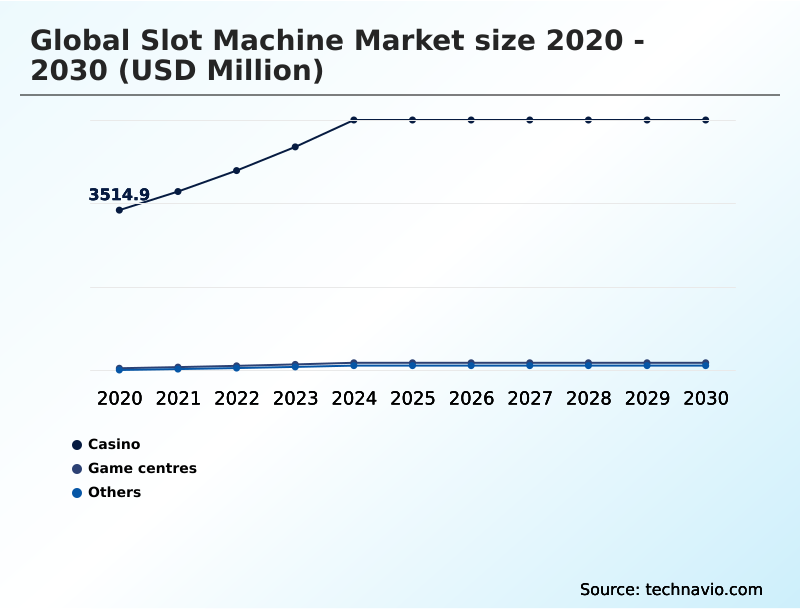
  • By Application - Casino segment was valued at USD 5.40 billion in 2024
  • By Product - Digital segment accounted for the largest market revenue share in 2024

Market Size & Forecast

  • Market Opportunities: USD 9.34 billion
  • Market Future Opportunities: USD 6.52 billion
  • CAGR from 2025 to 2030 : 14.5%

Market Summary

  • The slot machine market is defined by continuous technological evolution, moving far beyond traditional mechanics. Core to modern operations is the sophisticated electronic gaming machine, which relies on certified random number generation to ensure fair play while being connected to a comprehensive casino management platform.
  • The industry is driven by the demand for engaging content, leading to the development of high volatility games and the integration of skill based gaming and hybrid game mechanics. A major operational scenario involves an operator using a player loyalty platform to analyze engagement patterns, leveraging player preference analysis to customize offerings and improve retention.
  • This is supported by advanced technologies like server based gaming technology and, increasingly, cloud based gaming architecture, which allow for dynamic content updates via a remote game server. The push for an omnichannel gaming experience connects land-based play with digital channels, requiring a secure network infrastructure and adherence to stringent machine integrity standards and responsible gaming measures.

What will be the Size of the Slot Machine Market during the forecast period?

Get Key Insights on Market Forecast (PDF) Request Free Sample

How is the Slot Machine Market Segmented?

The slot machine industry research report provides comprehensive data (region-wise segment analysis), with forecasts and estimates in "USD million" for the period 2026-2030, as well as historical data from 2020-2024 for the following segments.

  • Application
    • Casino
    • Game centres
    • Others
  • Product
    • Digital
    • Mechanical
  • Type
    • Video slot machines
    • Reel slot machines
    • Multi-denomination slot machines
    • Progressive slot machines
  • Geography
    • Europe
      • Italy
      • Germany
      • UK
    • North America
      • US
      • Canada
      • Mexico
    • APAC
      • China
      • Australia
      • Japan
    • South America
      • Brazil
      • Argentina
    • Middle East and Africa
      • South Africa
      • UAE
      • Turkey
    • Rest of World (ROW)

By Application Insights

The casino segment is estimated to witness significant growth during the forecast period.

The casino segment, which includes commercial, tribal, and integrated resort facilities, is the market's primary revenue driver. Success in this area hinges on deploying high-performance electronic gaming machines featuring advanced cabinet design and immersive audio systems to enhance player experience.

Effective casino floor optimization is achieved by integrating a robust player loyalty platform, which leverages player engagement analytics to inform strategy. This integration can improve player retention by over 15%.

Operators also prioritize sophisticated payout ratio management and licensed content integration to maintain a competitive edge.

The complexity of modern operations, including jackpot management systems and various financial technology solutions, demands significant backend system sophistication for both casino-based and route based gaming operations, with gaming machine ergonomics playing a vital role in player comfort.

Request Free Sample

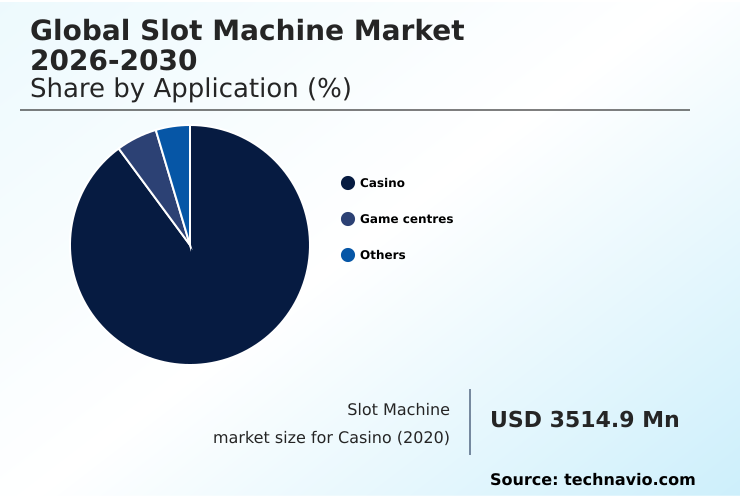
The Casino segment was valued at USD 5.40 billion in 2024 and showed a gradual increase during the forecast period.

Request Free Sample

Regional Analysis

Europe is estimated to contribute 36.2% to the growth of the global market during the forecast period.Technavio’s analysts have elaborately explained the regional trends and drivers that shape the market during the forecast period.

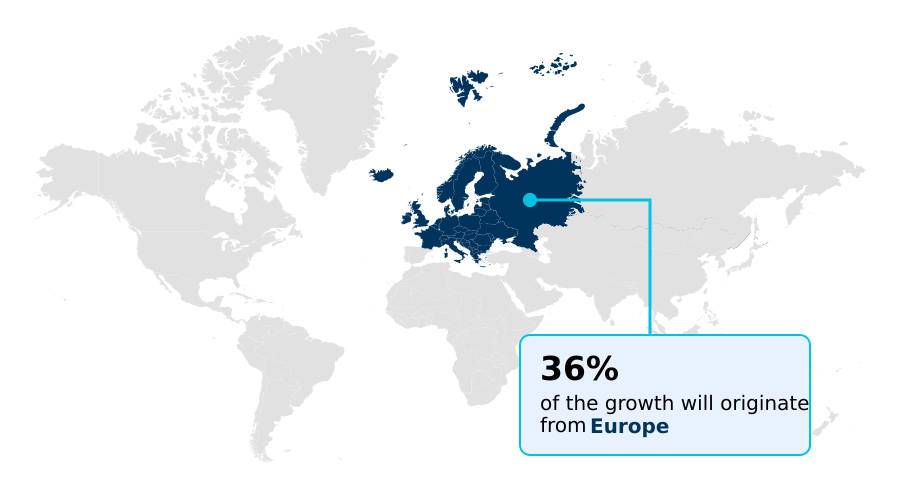
See How Slot Machine Market Demand is Rising in Europe Request Free Sample

The geographic landscape is marked by varied technology adoption rates and regulatory environments. North America leads in deploying advanced integrated resort technology, utilizing a sophisticated player tracking system and casino management platform for detailed player behavior tracking.

This region’s infrastructure supports complex systems like the wide area network progressive. In contrast, many European markets focus on amusement with prize machines and localized linked progressive systems.

The expansion into emerging markets in South America and Asia is driving demand for gaming machine refurbishment and certified gaming components.

A modern cloud based gaming architecture is essential for companies pursuing international expansion, as it can reduce deployment costs in new jurisdictions by over 30% and supports specialized formats like pari mutuel wagering.

Market Dynamics

Our researchers analyzed the data with 2025 as the base year, along with the key drivers, trends, and challenges. A holistic analysis of drivers will help companies refine their marketing strategies to gain a competitive advantage.

  • Strategic decision-making in the modern casino environment requires a nuanced understanding of evolving player preferences and technologies. A key challenge is balancing skill based features with rng to attract new demographics without alienating traditional players. Success depends on optimizing slot machine floor placement and analyzing slot machine performance data to maximize revenue per square foot.
  • The move toward integrating cashless payments in casinos is irreversible, demanding secure systems and a clear ROI analysis. As markets diversify, developing localized slot game content becomes critical for international success. This expansion, however, elevates the importance of securing networked slot machines and managing multi-jurisdiction regulatory compliance, which can be a significant operational burden.
  • Many operators are now focused on reducing slot machine operational costs through predictive maintenance and efficient hardware management. A critical goal is improving player retention with ai, which involves leveraging data analytics for personalized promotions. The question of when and how to approach upgrading legacy slot machine hardware is a major capital expenditure decision.
  • The industry continues to debate the long-term performance, comparing video slot vs mechanical reel performance, and studies the impact of cabinet design on player engagement.
  • Formulating effective omnichannel strategies for slot gaming and understanding the cost benefit of server based gaming are central to future-proofing operations, alongside tracking the evolution of progressive jackpot systems and trends in electronic table game integration. Implementing responsible gaming features effectively is no longer optional but a core component of sustainable strategy.
  • Cybersecurity threats in connected gaming and evaluating the ROI of high-definition slot displays are also at the forefront of operational planning.

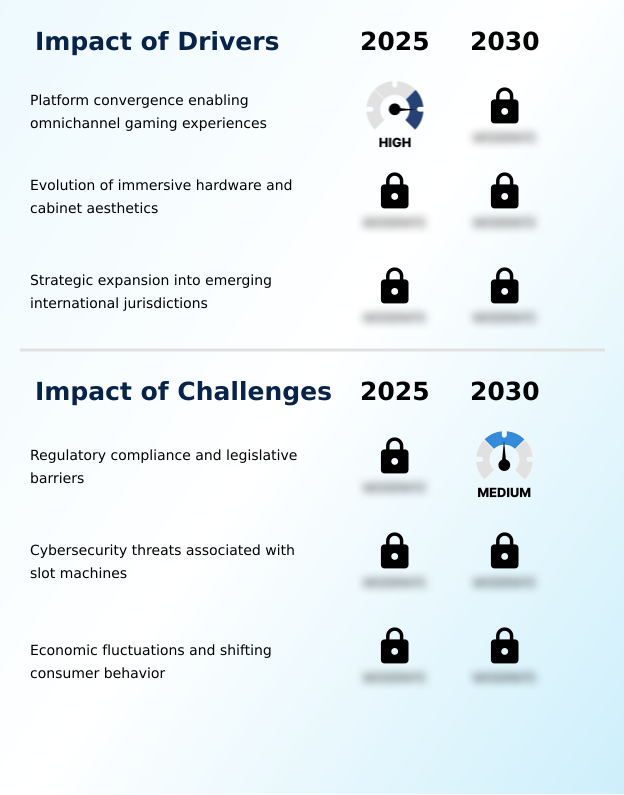
What are the key market drivers leading to the rise in the adoption of Slot Machine Industry?

  • The convergence of land-based and digital platforms, which enables a seamless omnichannel gaming experience, is a key driver of market growth.

  • Platform convergence is a primary market driver, creating a seamless omnichannel gaming experience for players across different environments. This is powered by server based gaming technology and sophisticated casino gaming platforms that support a unified cross platform loyalty system.
  • Advances in gaming hardware innovation, particularly high definition displays and components enabling high-speed processing in slots, are critical for attracting players. The development of complex game mathematics allows for the creation of high volatility games that drive engagement.
  • Furthermore, strategic expansion into new jurisdictions is supported by networked gaming solutions and a centralized monitoring system, which simplifies compliance.
  • The successful application of entertainment venue technology and gaming content localization can increase initial player adoption in new markets by as much as 25%.

What are the market trends shaping the Slot Machine Industry?

  • The integration of artificial intelligence and machine learning is a transformative market trend. These technologies are increasingly used to personalize gaming experiences and optimize operational performance.

  • The adoption of artificial intelligence and player preference analysis is reshaping the market, enabling dynamic, personalized experiences. This trend has spurred the growth of skill based gaming and hybrid game mechanics that appeal to new demographics. Integration with a remote game server supports the seamless deployment of content, including interactive bonus features, which enhances customer lifetime value optimization.
  • The shift toward a cashless wagering system, facilitated by digital wallet integration and robust slot machine software security, streamlines operations and supports data driven marketing in casinos. This mobile gaming convergence improves convenience, with operators reporting a reduction in transaction friction by up to 20%.
  • The overall digital payment integration is not just a trend but a fundamental shift in operational efficiency.

What challenges does the Slot Machine Industry face during its growth?

  • Navigating complex regulatory compliance requirements and varied legislative barriers across jurisdictions presents a key challenge to industry growth.

  • Navigating a complex regulatory compliance framework remains a significant challenge, requiring continuous investment in slot machine compliance testing and regulatory technology for gaming. Adherence to strict machine integrity standards for every video lottery terminal and its underlying random number generation is non-negotiable.
  • Implementing a secure network infrastructure for server linked systems is crucial for protecting against cybersecurity for gaming machines, a risk that can increase operational costs by up to 10% if not managed proactively. Operators also face the financial burden of legacy hardware upgrades to meet new responsible gaming measures.
  • These factors create pressure to improve gaming machine operational efficiency and explore solutions like predictive maintenance for slots to balance compliance costs with profitability.

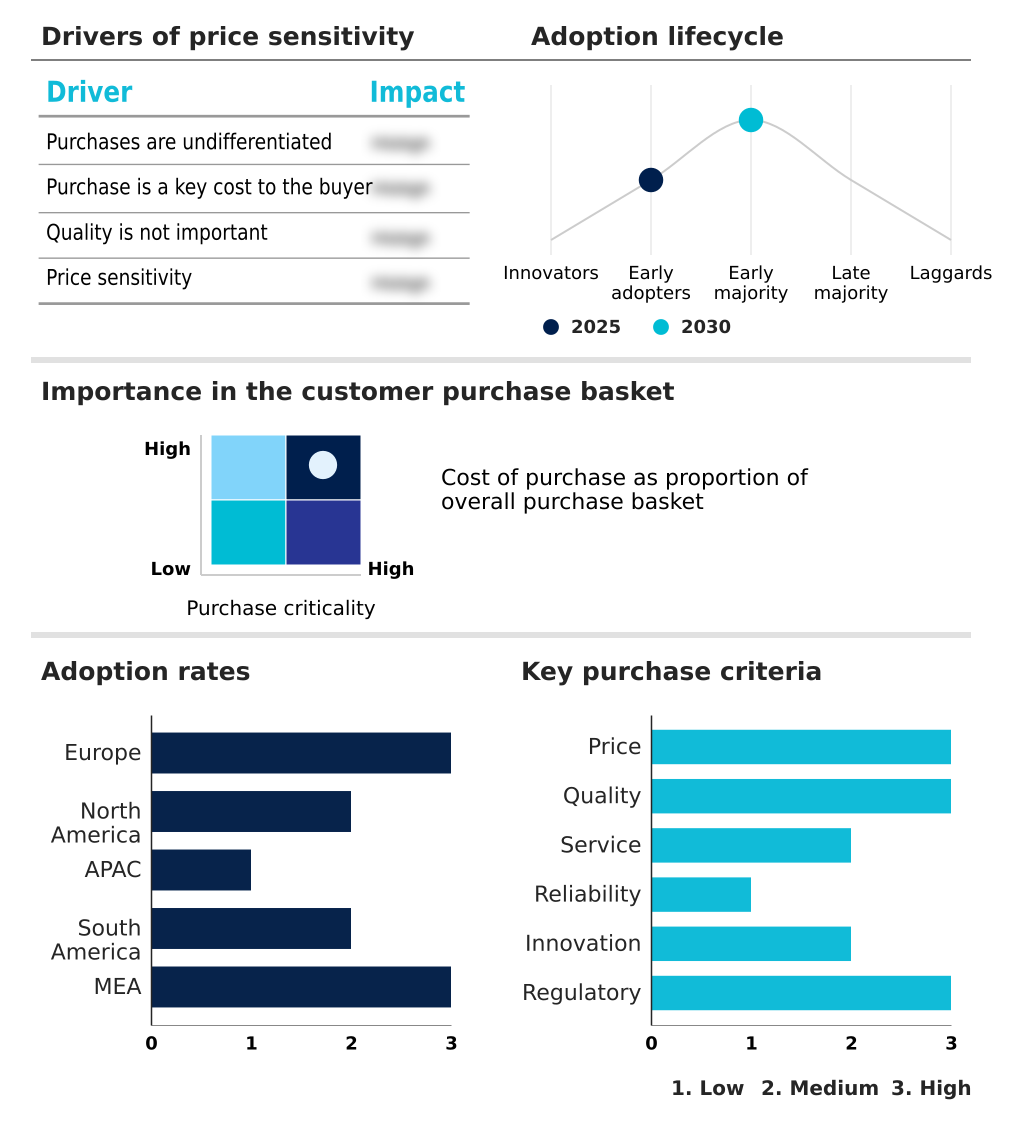
Exclusive Technavio Analysis on Customer Landscape

The slot machine market forecasting report includes the adoption lifecycle of the market, covering from the innovator’s stage to the laggard’s stage. It focuses on adoption rates in different regions based on penetration. Furthermore, the slot machine market report also includes key purchase criteria and drivers of price sensitivity to help companies evaluate and develop their market growth analysis strategies.

Customer Landscape of Slot Machine Industry

Competitive Landscape

Companies are implementing various strategies, such as strategic alliances, slot machine market forecast, partnerships, mergers and acquisitions, geographical expansion, and product/service launches, to enhance their presence in the industry.

Accel Entertainment Inc. - Offers integrated slot machine solutions, including cabinet hardware, diverse game content, and gaming platforms for reliable casino floor deployment and operations.

The industry research and growth report includes detailed analyses of the competitive landscape of the market and information about key companies, including:

  • Accel Entertainment Inc.
  • AMATIC Industries GmbH
  • APEX pro gaming s.r.o
  • APOLLO SOFT s.r.o.
  • Aries Technology LLC
  • Aristocrat Leisure Ltd.
  • Aruze Gaming Global
  • Ballys Corp.
  • Eclipse Gaming Systems
  • Everi Holdings Inc.
  • Incredible Technologies Inc.
  • Inspired Entertainment Inc.
  • Interblock Gaming
  • International Game Technology
  • JPM Interactive Ltd.
  • Konami Group Corp.
  • NOVOMATIC AG
  • PlayAGS Inc.
  • Recreativos Franco S.A
  • Scientific Games LLC

Qualitative and quantitative analysis of companies has been conducted to help clients understand the wider business environment as well as the strengths and weaknesses of key industry players. Data is qualitatively analyzed to categorize companies as pure play, category-focused, industry-focused, and diversified; it is quantitatively analyzed to categorize companies as dominant, leading, strong, tentative, and weak.

Recent Development and News in Slot machine market

  • In August 2024, PlayAGS Inc. introduced a new series of slot products that integrate arcade-style challenges into the core gameplay, targeting players who prefer skill-influenced outcomes.
  • In September 2024, Light and Wonder announced a new cross-platform loyalty system designed to unify player rewards between physical slot machine play and digital gaming channels.
  • In October 2024, Konami Gaming launched a new generation of cabinet designs equipped with curved touchscreens and enhanced audio systems, focusing on player immersion and ergonomic comfort.
  • In November 2024, Novomatic AG revealed its strategic establishment of a regional distribution hub in the Middle East to prepare for anticipated gaming resort development in the area.

Dive into Technavio’s robust research methodology, blending expert interviews, extensive data synthesis, and validated models for unparalleled Slot Machine Market insights. See full methodology.

Market Scope
Page number 292
Base year 2025
Historic period 2020-2024
Forecast period 2026-2030
Growth momentum & CAGR Accelerate at a CAGR of 14.5%
Market growth 2026-2030 USD 6515.9 million
Market structure Fragmented
YoY growth 2025-2026(%) 13.0%
Key countries Italy, Germany, UK, Spain, France, The Netherlands, US, Canada, Mexico, China, Australia, Japan, South Korea, Singapore, India, Brazil, Argentina, Chile, South Africa, UAE, Egypt, Turkey and Saudi Arabia
Competitive landscape Leading Companies, Market Positioning of Companies, Competitive Strategies, and Industry Risks

Request Free Sample

Research Analyst Overview

  • The evolution of the slot machine market is driven by sophisticated technology, with boardroom decisions increasingly focused on balancing innovation with compliance. At the core is the electronic gaming machine, which relies on complex game mathematics and certified random number generation.
  • Companies are focused on delivering a connected omnichannel gaming experience through innovations like a cross platform loyalty system and digital wallet integration, supported by a robust casino management platform and server based gaming technology. Hardware evolution is seen in advanced cabinet design with high definition displays and immersive audio systems.
  • The market is also diversifying with the video lottery terminal, amusement with prize machine, and pari mutuel wagering formats. The deployment of a centralized monitoring system and adherence to a strict regulatory compliance framework are critical, with systems like a wide area network progressive and linked progressive systems requiring a secure network infrastructure.
  • Technology like a remote game server and cloud based gaming architecture facilitates licensed content integration and player preference analysis. The shift to a cashless wagering system, management of payout ratios, and implementation of responsible gaming measures underscore the industry's complexity.
  • A key focus is on maintaining machine integrity standards while introducing features like high volatility games, skill based gaming, and hybrid game mechanics, demonstrating the importance of backend system sophistication. Companies that successfully integrate these elements can see a 10% improvement in floor performance.

What are the Key Data Covered in this Slot Machine Market Research and Growth Report?

  • What is the expected growth of the Slot Machine Market between 2026 and 2030?

    • USD 6.52 billion, at a CAGR of 14.5%

  • What segmentation does the market report cover?

    • The report is segmented by Application (Casino, Game centres, and Others), Product (Digital, and Mechanical), Type (Video slot machines, Reel slot machines, Multi-denomination slot machines, and Progressive slot machines) and Geography (Europe, North America, APAC, South America, Middle East and Africa)

  • Which regions are analyzed in the report?

    • Europe, North America, APAC, South America and Middle East and Africa

  • What are the key growth drivers and market challenges?

    • Platform convergence enabling omnichannel gaming experiences, Regulatory compliance and legislative barriers

  • Who are the major players in the Slot Machine Market?

    • Accel Entertainment Inc., AMATIC Industries GmbH, APEX pro gaming s.r.o, APOLLO SOFT s.r.o., Aries Technology LLC, Aristocrat Leisure Ltd., Aruze Gaming Global, Ballys Corp., Eclipse Gaming Systems, Everi Holdings Inc., Incredible Technologies Inc., Inspired Entertainment Inc., Interblock Gaming, International Game Technology, JPM Interactive Ltd., Konami Group Corp., NOVOMATIC AG, PlayAGS Inc., Recreativos Franco S.A and Scientific Games LLC

Market Research Insights

  • Market dynamics are shaped by the pursuit of operational efficiency and enhanced player engagement. The adoption of omnichannel strategies through mobile gaming convergence has been shown to improve customer lifetime value optimization by over 20%. Concurrently, the widespread digital payment integration and adoption of financial technology solutions reduce casino cash handling costs by up to 30%.
  • Innovations in gaming hardware, coupled with advanced graphical rendering and high-speed processing, are critical for maintaining player interest. Operators are leveraging player behavior tracking and engagement analytics for data driven marketing in casinos, supported by robust casino gaming platforms.
  • Efforts in gaming content localization and ensuring cybersecurity for gaming machines are essential for sustainable international expansion and protecting networked gaming solutions. Strategic casino floor optimization remains a key focus to maximize asset performance.

We can help! Our analysts can customize this slot machine market research report to meet your requirements.

Get in touch

1. Executive Summary

1.1 Market overview

Executive Summary - Chart on Market Overview
Executive Summary - Data Table on Market Overview
Executive Summary - Chart on Global Market Characteristics
Executive Summary - Chart on Market by Geography
Executive Summary - Chart on Market Segmentation by Application
Executive Summary - Chart on Market Segmentation by Product
Executive Summary - Chart on Market Segmentation by Type
Executive Summary - Chart on Incremental Growth
Executive Summary - Data Table on Incremental Growth
Executive Summary - Chart on Company Market Positioning

2. Technavio Analysis

2.1 Analysis of price sensitivity, lifecycle, customer purchase basket, adoption rates, and purchase criteria

2.2 Criticality of inputs and Factors of differentiation

Chart on Overview on criticality of inputs and factors of differentiation

2.3 Factors of disruption

Chart on Overview on factors of disruption

2.4 Impact of drivers and challenges

Chart on Impact of drivers and challenges in 2025 and 2030

3. Market Landscape

3.1 Market ecosystem

Chart on Parent Market
Data Table on - Parent Market

3.2 Market characteristics

Chart on Market characteristics analysis

3.3 Value chain analysis

Chart on Value chain analysis

4. Market Sizing

4.1 Market definition

Data Table on Offerings of companies included in the market definition

4.2 Market segment analysis

Market segments

4.3 Market size 2025

4.4 Market outlook: Forecast for 2025-2030

Chart on Global - Market size and forecast 2025-2030 ($ million)
Data Table on Global - Market size and forecast 2025-2030 ($ million)
Chart on Global Market: Year-over-year growth 2025-2030 (%)
Data Table on Global Market: Year-over-year growth 2025-2030 (%)

5. Historic Market Size

5.1 Global Slot Machine Market 2020 - 2024

Historic Market Size - Data Table on Global Slot Machine Market 2020 - 2024 ($ million)

5.2 Application segment analysis 2020 - 2024

Historic Market Size - Application Segment 2020 - 2024 ($ million)

5.3 Product segment analysis 2020 - 2024

Historic Market Size - Product Segment 2020 - 2024 ($ million)

5.4 Type segment analysis 2020 - 2024

Historic Market Size - Type Segment 2020 - 2024 ($ million)

5.5 Geography segment analysis 2020 - 2024

Historic Market Size - Geography Segment 2020 - 2024 ($ million)

5.6 Country segment analysis 2020 - 2024

Historic Market Size - Country Segment 2020 - 2024 ($ million)

6. Qualitative Analysis

6.1 Impact of AI on Global Slot Machine Market

7. Five Forces Analysis

7.1 Five forces summary

Five forces analysis - Comparison between 2025 and 2030

7.2 Bargaining power of buyers

Bargaining power of buyers - Impact of key factors 2025 and 2030

7.3 Bargaining power of suppliers

Bargaining power of suppliers - Impact of key factors in 2025 and 2030

7.4 Threat of new entrants

Threat of new entrants - Impact of key factors in 2025 and 2030

7.5 Threat of substitutes

Threat of substitutes - Impact of key factors in 2025 and 2030

7.6 Threat of rivalry

Threat of rivalry - Impact of key factors in 2025 and 2030

7.7 Market condition

Chart on Market condition - Five forces 2025 and 2030

8. Market Segmentation by Application

8.1 Market segments

Chart on Application - Market share 2025-2030 (%)
Data Table on Application - Market share 2025-2030 (%)

8.2 Comparison by Application

Chart on Comparison by Application
Data Table on Comparison by Application

8.3 Casino - Market size and forecast 2025-2030

Chart on Casino - Market size and forecast 2025-2030 ($ million)
Data Table on Casino - Market size and forecast 2025-2030 ($ million)
Chart on Casino - Year-over-year growth 2025-2030 (%)
Data Table on Casino - Year-over-year growth 2025-2030 (%)

8.4 Game centres - Market size and forecast 2025-2030

Chart on Game centres - Market size and forecast 2025-2030 ($ million)
Data Table on Game centres - Market size and forecast 2025-2030 ($ million)
Chart on Game centres - Year-over-year growth 2025-2030 (%)
Data Table on Game centres - Year-over-year growth 2025-2030 (%)

8.5 Others - Market size and forecast 2025-2030

Chart on Others - Market size and forecast 2025-2030 ($ million)
Data Table on Others - Market size and forecast 2025-2030 ($ million)
Chart on Others - Year-over-year growth 2025-2030 (%)
Data Table on Others - Year-over-year growth 2025-2030 (%)

8.6 Market opportunity by Application

Market opportunity by Application ($ million)
Data Table on Market opportunity by Application ($ million)

9. Market Segmentation by Product

9.1 Market segments

Chart on Product - Market share 2025-2030 (%)
Data Table on Product - Market share 2025-2030 (%)

9.2 Comparison by Product

Chart on Comparison by Product
Data Table on Comparison by Product

9.3 Digital - Market size and forecast 2025-2030

Chart on Digital - Market size and forecast 2025-2030 ($ million)
Data Table on Digital - Market size and forecast 2025-2030 ($ million)
Chart on Digital - Year-over-year growth 2025-2030 (%)
Data Table on Digital - Year-over-year growth 2025-2030 (%)

9.4 Mechanical - Market size and forecast 2025-2030

Chart on Mechanical - Market size and forecast 2025-2030 ($ million)
Data Table on Mechanical - Market size and forecast 2025-2030 ($ million)
Chart on Mechanical - Year-over-year growth 2025-2030 (%)
Data Table on Mechanical - Year-over-year growth 2025-2030 (%)

9.5 Market opportunity by Product

Market opportunity by Product ($ million)
Data Table on Market opportunity by Product ($ million)

10. Market Segmentation by Type

10.1 Market segments

Chart on Type - Market share 2025-2030 (%)
Data Table on Type - Market share 2025-2030 (%)

10.2 Comparison by Type

Chart on Comparison by Type
Data Table on Comparison by Type

10.3 Video slot machines - Market size and forecast 2025-2030

Chart on Video slot machines - Market size and forecast 2025-2030 ($ million)
Data Table on Video slot machines - Market size and forecast 2025-2030 ($ million)
Chart on Video slot machines - Year-over-year growth 2025-2030 (%)
Data Table on Video slot machines - Year-over-year growth 2025-2030 (%)

10.4 Reel slot machines - Market size and forecast 2025-2030

Chart on Reel slot machines - Market size and forecast 2025-2030 ($ million)
Data Table on Reel slot machines - Market size and forecast 2025-2030 ($ million)
Chart on Reel slot machines - Year-over-year growth 2025-2030 (%)
Data Table on Reel slot machines - Year-over-year growth 2025-2030 (%)

10.5 Multi-denomination slot machines - Market size and forecast 2025-2030

Chart on Multi-denomination slot machines - Market size and forecast 2025-2030 ($ million)
Data Table on Multi-denomination slot machines - Market size and forecast 2025-2030 ($ million)
Chart on Multi-denomination slot machines - Year-over-year growth 2025-2030 (%)
Data Table on Multi-denomination slot machines - Year-over-year growth 2025-2030 (%)

10.6 Progressive slot machines - Market size and forecast 2025-2030

Chart on Progressive slot machines - Market size and forecast 2025-2030 ($ million)
Data Table on Progressive slot machines - Market size and forecast 2025-2030 ($ million)
Chart on Progressive slot machines - Year-over-year growth 2025-2030 (%)
Data Table on Progressive slot machines - Year-over-year growth 2025-2030 (%)

10.7 Market opportunity by Type

Market opportunity by Type ($ million)
Data Table on Market opportunity by Type ($ million)

11. Customer Landscape

11.1 Customer landscape overview

Analysis of price sensitivity, lifecycle, customer purchase basket, adoption rates, and purchase criteria

12. Geographic Landscape

12.1 Geographic segmentation

Chart on Market share by geography 2025-2030 (%)
Data Table on Market share by geography 2025-2030 (%)

12.2 Geographic comparison

Chart on Geographic comparison
Data Table on Geographic comparison

12.3 Europe - Market size and forecast 2025-2030

Chart on Europe - Market size and forecast 2025-2030 ($ million)
Data Table on Europe - Market size and forecast 2025-2030 ($ million)
Chart on Europe - Year-over-year growth 2025-2030 (%)
Data Table on Europe - Year-over-year growth 2025-2030 (%)
Chart on Regional Comparison - Europe
Data Table on Regional Comparison - Europe

12.3.1 Italy - Market size and forecast 2025-2030

Chart on Italy - Market size and forecast 2025-2030 ($ million)
Data Table on Italy - Market size and forecast 2025-2030 ($ million)
Chart on Italy - Year-over-year growth 2025-2030 (%)
Data Table on Italy - Year-over-year growth 2025-2030 (%)

12.3.2 Germany - Market size and forecast 2025-2030

Chart on Germany - Market size and forecast 2025-2030 ($ million)
Data Table on Germany - Market size and forecast 2025-2030 ($ million)
Chart on Germany - Year-over-year growth 2025-2030 (%)
Data Table on Germany - Year-over-year growth 2025-2030 (%)

12.3.3 UK - Market size and forecast 2025-2030

Chart on UK - Market size and forecast 2025-2030 ($ million)
Data Table on UK - Market size and forecast 2025-2030 ($ million)
Chart on UK - Year-over-year growth 2025-2030 (%)
Data Table on UK - Year-over-year growth 2025-2030 (%)

12.3.4 Spain - Market size and forecast 2025-2030

Chart on Spain - Market size and forecast 2025-2030 ($ million)
Data Table on Spain - Market size and forecast 2025-2030 ($ million)
Chart on Spain - Year-over-year growth 2025-2030 (%)
Data Table on Spain - Year-over-year growth 2025-2030 (%)

12.3.5 France - Market size and forecast 2025-2030

Chart on France - Market size and forecast 2025-2030 ($ million)
Data Table on France - Market size and forecast 2025-2030 ($ million)
Chart on France - Year-over-year growth 2025-2030 (%)
Data Table on France - Year-over-year growth 2025-2030 (%)

12.3.6 The Netherlands - Market size and forecast 2025-2030

Chart on The Netherlands - Market size and forecast 2025-2030 ($ million)
Data Table on The Netherlands - Market size and forecast 2025-2030 ($ million)
Chart on The Netherlands - Year-over-year growth 2025-2030 (%)
Data Table on The Netherlands - Year-over-year growth 2025-2030 (%)

12.4 North America - Market size and forecast 2025-2030

Chart on North America - Market size and forecast 2025-2030 ($ million)
Data Table on North America - Market size and forecast 2025-2030 ($ million)
Chart on North America - Year-over-year growth 2025-2030 (%)
Data Table on North America - Year-over-year growth 2025-2030 (%)
Chart on Regional Comparison - North America
Data Table on Regional Comparison - North America

12.4.1 US - Market size and forecast 2025-2030

Chart on US - Market size and forecast 2025-2030 ($ million)
Data Table on US - Market size and forecast 2025-2030 ($ million)
Chart on US - Year-over-year growth 2025-2030 (%)
Data Table on US - Year-over-year growth 2025-2030 (%)

12.4.2 Canada - Market size and forecast 2025-2030

Chart on Canada - Market size and forecast 2025-2030 ($ million)
Data Table on Canada - Market size and forecast 2025-2030 ($ million)
Chart on Canada - Year-over-year growth 2025-2030 (%)
Data Table on Canada - Year-over-year growth 2025-2030 (%)

12.4.3 Mexico - Market size and forecast 2025-2030

Chart on Mexico - Market size and forecast 2025-2030 ($ million)
Data Table on Mexico - Market size and forecast 2025-2030 ($ million)
Chart on Mexico - Year-over-year growth 2025-2030 (%)
Data Table on Mexico - Year-over-year growth 2025-2030 (%)

12.5 APAC - Market size and forecast 2025-2030

Chart on APAC - Market size and forecast 2025-2030 ($ million)
Data Table on APAC - Market size and forecast 2025-2030 ($ million)
Chart on APAC - Year-over-year growth 2025-2030 (%)
Data Table on APAC - Year-over-year growth 2025-2030 (%)
Chart on Regional Comparison - APAC
Data Table on Regional Comparison - APAC

12.5.1 China - Market size and forecast 2025-2030

Chart on China - Market size and forecast 2025-2030 ($ million)
Data Table on China - Market size and forecast 2025-2030 ($ million)
Chart on China - Year-over-year growth 2025-2030 (%)
Data Table on China - Year-over-year growth 2025-2030 (%)

12.5.2 Australia - Market size and forecast 2025-2030

Chart on Australia - Market size and forecast 2025-2030 ($ million)
Data Table on Australia - Market size and forecast 2025-2030 ($ million)
Chart on Australia - Year-over-year growth 2025-2030 (%)
Data Table on Australia - Year-over-year growth 2025-2030 (%)

12.5.3 Japan - Market size and forecast 2025-2030

Chart on Japan - Market size and forecast 2025-2030 ($ million)
Data Table on Japan - Market size and forecast 2025-2030 ($ million)
Chart on Japan - Year-over-year growth 2025-2030 (%)
Data Table on Japan - Year-over-year growth 2025-2030 (%)

12.5.4 South Korea - Market size and forecast 2025-2030

Chart on South Korea - Market size and forecast 2025-2030 ($ million)
Data Table on South Korea - Market size and forecast 2025-2030 ($ million)
Chart on South Korea - Year-over-year growth 2025-2030 (%)
Data Table on South Korea - Year-over-year growth 2025-2030 (%)

12.5.5 Singapore - Market size and forecast 2025-2030

Chart on Singapore - Market size and forecast 2025-2030 ($ million)
Data Table on Singapore - Market size and forecast 2025-2030 ($ million)
Chart on Singapore - Year-over-year growth 2025-2030 (%)
Data Table on Singapore - Year-over-year growth 2025-2030 (%)

12.5.6 India - Market size and forecast 2025-2030

Chart on India - Market size and forecast 2025-2030 ($ million)
Data Table on India - Market size and forecast 2025-2030 ($ million)
Chart on India - Year-over-year growth 2025-2030 (%)
Data Table on India - Year-over-year growth 2025-2030 (%)

12.6 South America - Market size and forecast 2025-2030

Chart on South America - Market size and forecast 2025-2030 ($ million)
Data Table on South America - Market size and forecast 2025-2030 ($ million)
Chart on South America - Year-over-year growth 2025-2030 (%)
Data Table on South America - Year-over-year growth 2025-2030 (%)
Chart on Regional Comparison - South America
Data Table on Regional Comparison - South America

12.6.1 Brazil - Market size and forecast 2025-2030

Chart on Brazil - Market size and forecast 2025-2030 ($ million)
Data Table on Brazil - Market size and forecast 2025-2030 ($ million)
Chart on Brazil - Year-over-year growth 2025-2030 (%)
Data Table on Brazil - Year-over-year growth 2025-2030 (%)

12.6.2 Argentina - Market size and forecast 2025-2030

Chart on Argentina - Market size and forecast 2025-2030 ($ million)
Data Table on Argentina - Market size and forecast 2025-2030 ($ million)
Chart on Argentina - Year-over-year growth 2025-2030 (%)
Data Table on Argentina - Year-over-year growth 2025-2030 (%)

12.6.3 Chile - Market size and forecast 2025-2030

Chart on Chile - Market size and forecast 2025-2030 ($ million)
Data Table on Chile - Market size and forecast 2025-2030 ($ million)
Chart on Chile - Year-over-year growth 2025-2030 (%)
Data Table on Chile - Year-over-year growth 2025-2030 (%)

12.7 Middle East and Africa - Market size and forecast 2025-2030

Chart on Middle East and Africa - Market size and forecast 2025-2030 ($ million)
Data Table on Middle East and Africa - Market size and forecast 2025-2030 ($ million)
Chart on Middle East and Africa - Year-over-year growth 2025-2030 (%)
Data Table on Middle East and Africa - Year-over-year growth 2025-2030 (%)
Chart on Regional Comparison - Middle East and Africa
Data Table on Regional Comparison - Middle East and Africa

12.7.1 South Africa - Market size and forecast 2025-2030

Chart on South Africa - Market size and forecast 2025-2030 ($ million)
Data Table on South Africa - Market size and forecast 2025-2030 ($ million)
Chart on South Africa - Year-over-year growth 2025-2030 (%)
Data Table on South Africa - Year-over-year growth 2025-2030 (%)

12.7.2 UAE - Market size and forecast 2025-2030

Chart on UAE - Market size and forecast 2025-2030 ($ million)
Data Table on UAE - Market size and forecast 2025-2030 ($ million)
Chart on UAE - Year-over-year growth 2025-2030 (%)
Data Table on UAE - Year-over-year growth 2025-2030 (%)

12.7.3 Egypt - Market size and forecast 2025-2030

Chart on Egypt - Market size and forecast 2025-2030 ($ million)
Data Table on Egypt - Market size and forecast 2025-2030 ($ million)
Chart on Egypt - Year-over-year growth 2025-2030 (%)
Data Table on Egypt - Year-over-year growth 2025-2030 (%)

12.7.4 Turkey - Market size and forecast 2025-2030

Chart on Turkey - Market size and forecast 2025-2030 ($ million)
Data Table on Turkey - Market size and forecast 2025-2030 ($ million)
Chart on Turkey - Year-over-year growth 2025-2030 (%)
Data Table on Turkey - Year-over-year growth 2025-2030 (%)

12.7.5 Saudi Arabia - Market size and forecast 2025-2030

Chart on Saudi Arabia - Market size and forecast 2025-2030 ($ million)
Data Table on Saudi Arabia - Market size and forecast 2025-2030 ($ million)
Chart on Saudi Arabia - Year-over-year growth 2025-2030 (%)
Data Table on Saudi Arabia - Year-over-year growth 2025-2030 (%)

12.8 Market opportunity by geography

Market opportunity by geography ($ million)
Data Tables on Market opportunity by geography ($ million)

13. Drivers, Challenges, and Opportunity

13.1 Market drivers

Platform convergence enabling omnichannel gaming experiences
Evolution of immersive hardware and cabinet aesthetics
Strategic expansion into emerging international jurisdictions

13.2 Market challenges

Regulatory compliance and legislative barriers
Cybersecurity threats associated with slot machines
Economic fluctuations and shifting consumer behavior

13.3 Impact of drivers and challenges

Impact of drivers and challenges in 2025 and 2030

13.4 Market opportunities

Integration of artificial intelligence and machine learning
Adoption of cashless and contactless payment technologies
Growth of skill-based gaming and hybrid mechanics

14. Competitive Landscape

14.1 Overview

14.2

Overview on criticality of inputs and factors of differentiation

14.3 Landscape disruption

Overview on factors of disruption

14.4 Industry risks

Impact of key risks on business

15. Competitive Analysis

15.1 Companies profiled

Companies covered

15.2 Company ranking index

15.3 Market positioning of companies

Matrix on companies position and classification

15.4 Accel Entertainment Inc.

Accel Entertainment Inc. - Overview
Accel Entertainment Inc. - Product / Service
Accel Entertainment Inc. - Key offerings
SWOT

15.5 AMATIC Industries GmbH

AMATIC Industries GmbH - Overview
AMATIC Industries GmbH - Product / Service
AMATIC Industries GmbH - Key offerings
SWOT

15.6 Aristocrat Leisure Ltd.

Aristocrat Leisure Ltd. - Overview
Aristocrat Leisure Ltd. - Business segments
Aristocrat Leisure Ltd. - Key offerings
Aristocrat Leisure Ltd. - Segment focus
SWOT

15.7 Aruze Gaming Global

Aruze Gaming Global - Overview
Aruze Gaming Global - Product / Service
Aruze Gaming Global - Key offerings
SWOT

15.8 Ballys Corp.

Ballys Corp. - Overview
Ballys Corp. - Business segments
Ballys Corp. - Key offerings
Ballys Corp. - Segment focus
SWOT

15.9 Eclipse Gaming Systems

Eclipse Gaming Systems - Overview
Eclipse Gaming Systems - Product / Service
Eclipse Gaming Systems - Key offerings
SWOT

15.10 Everi Holdings Inc.

Everi Holdings Inc. - Overview
Everi Holdings Inc. - Business segments
Everi Holdings Inc. - Key offerings
Everi Holdings Inc. - Segment focus
SWOT

15.11 Interblock Gaming

Interblock Gaming - Overview
Interblock Gaming - Product / Service
Interblock Gaming - Key offerings
SWOT

15.12 International Game Technology

International Game Technology - Overview
International Game Technology - Business segments
International Game Technology - Key offerings
International Game Technology - Segment focus
SWOT

15.13 JPM Interactive Ltd.

JPM Interactive Ltd. - Overview
JPM Interactive Ltd. - Product / Service
JPM Interactive Ltd. - Key offerings
SWOT

15.14 Konami Group Corp.

Konami Group Corp. - Overview
Konami Group Corp. - Business segments
Konami Group Corp. - Key offerings
Konami Group Corp. - Segment focus
SWOT

15.15 NOVOMATIC AG

NOVOMATIC AG - Overview
NOVOMATIC AG - Product / Service
NOVOMATIC AG - Key offerings
SWOT

15.16 PlayAGS Inc.

PlayAGS Inc. - Overview
PlayAGS Inc. - Business segments
PlayAGS Inc. - Key offerings
PlayAGS Inc. - Segment focus
SWOT

15.17 Recreativos Franco S.A

Recreativos Franco S.A - Overview
Recreativos Franco S.A - Product / Service
Recreativos Franco S.A - Key offerings
SWOT

15.18 Scientific Games LLC

Scientific Games LLC - Overview
Scientific Games LLC - Product / Service
Scientific Games LLC - Key offerings
SWOT

16. Appendix

16.1 Scope of the report

Market definition
Objectives
Notes and caveats

16.2 Inclusions and exclusions checklist

Inclusions checklist
Exclusions checklist

16.3 Currency conversion rates for US$

16.4 Research methodology

16.5 Data procurement

Information sources

16.6 Data validation

16.7 Validation techniques employed for market sizing

16.8 Data synthesis

16.9 360 degree market analysis

16.10 List of abbreviations

Research Methodology

Technavio presents a detailed picture of the market by way of study, synthesis, and summation of data from multiple sources. The analysts have presented the various facets of the market with a particular focus on identifying the key industry influencers. The data thus presented is comprehensive, reliable, and the result of extensive research, both primary and secondary.

INFORMATION SOURCES

Primary sources

  • Manufacturers and suppliers
  • Channel partners
  • Industry experts
  • Strategic decision makers

Secondary sources

  • Industry journals and periodicals
  • Government data
  • Financial reports of key industry players
  • Historical data
  • Press releases

DATA ANALYSIS

Data Synthesis

  • Collation of data
  • Estimation of key figures
  • Analysis of derived insights

Data Validation

  • Triangulation with data models
  • Reference against proprietary databases
  • Corroboration with industry experts

REPORT WRITING

Qualitative

  • Market drivers
  • Market challenges
  • Market trends
  • Five forces analysis

Quantitative

  • Market size and forecast
  • Market segmentation
  • Geographical insights
  • Competitive landscape

Interested in this report?

Get your sample now to see our research methodology and insights!

Download Now

Frequently Asked Questions

Slot Machine market growth will increase by USD 6515.9 million during 2026-2030.

The Slot Machine market is expected to grow at a CAGR of 14.5% during 2026-2030.

Slot Machine market is segmented by Application (Casino, Game centres, Others) Product (Digital, Mechanical) Type (Video slot machines, Reel slot machines, Multi-denomination slot machines, Progressive slot machines)

Accel Entertainment Inc., AMATIC Industries GmbH, APEX pro gaming s.r.o, APOLLO SOFT s.r.o., Aries Technology LLC, Aristocrat Leisure Ltd., Aruze Gaming Global, Ballys Corp., Eclipse Gaming Systems, Everi Holdings Inc., Incredible Technologies Inc., Inspired Entertainment Inc., Interblock Gaming, International Game Technology, JPM Interactive Ltd., Konami Group Corp., NOVOMATIC AG, PlayAGS Inc., Recreativos Franco S.A, Scientific Games LLC are a few of the key vendors in the Slot Machine market.

Europe will register the highest growth rate of 36.2% among the other regions. Therefore, the Slot Machine market in Europe is expected to garner significant business opportunities for the vendors during the forecast period.

Italy, Germany, UK, Spain, France, The Netherlands, US, Canada, Mexico, China, Australia, Japan, South Korea, Singapore, India, Brazil, Argentina, Chile, South Africa, UAE, Egypt, Turkey, Saudi Arabia

  • Platform convergence enabling omnichannel gaming experiences is the driving factor this market.

The Slot Machine market vendors should focus on grabbing business opportunities from the Application segment as it accounted for the largest market share in the base year.
RIA - Research AI Assistant
Ask RIA