Lottery Market Analysis, Size, and Forecast 2026-2030: North America (US, Canada, and Mexico), APAC (China, Japan, and India), Europe (UK, France, and Germany), South America (Brazil, Argentina, and Colombia), Middle East and Africa (South Africa, UAE, and Turkey), and Rest of World (ROW)

Lottery Market Analysis, Size, and Forecast 2026-2030:
North America (US, Canada, and Mexico), APAC (China, Japan, and India), Europe (UK, France, and Germany), South America (Brazil, Argentina, and Colombia), Middle East and Africa (South Africa, UAE, and Turkey), and Rest of World (ROW)

Published: Mar 2026 287 Pages SKU: IRTNTR40859

Market Overview at a Glance

$243.96 B
Market Opportunity
7.5%
CAGR 2025 - 2030
36.7%
APAC Growth
$489.50 B
Offline segment 2024

Lottery Market Size 2026-2030

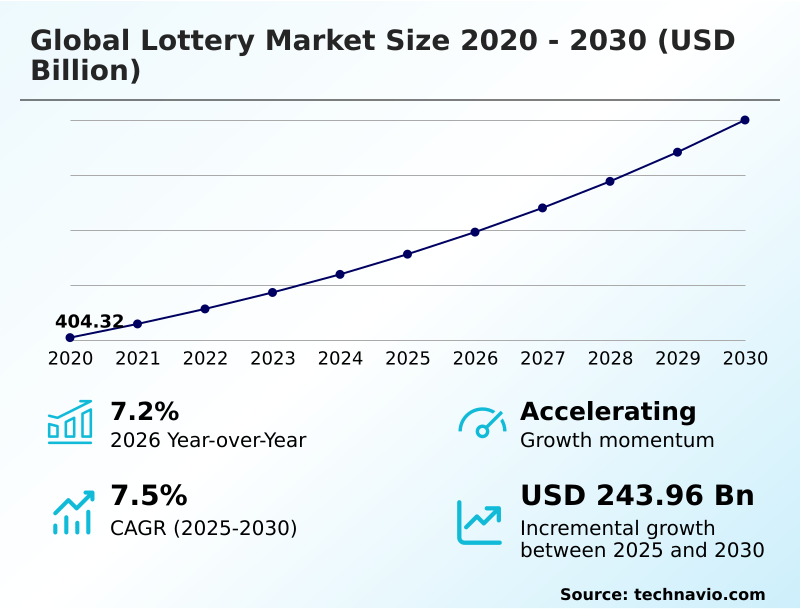
The lottery market size is valued to increase by USD 243.96 billion, at a CAGR of 7.5% from 2025 to 2030. Attractive jackpot sizes drive higher engagement will drive the lottery market.

Major Market Trends & Insights

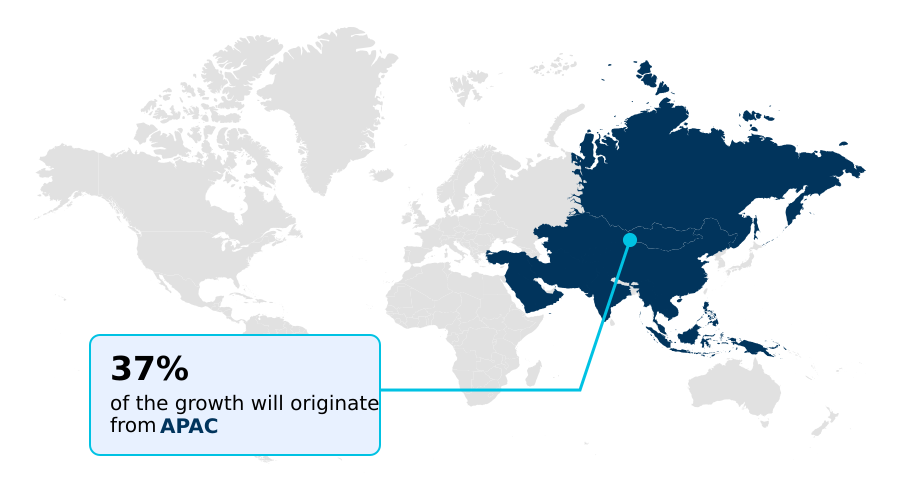
  • APAC dominated the market and accounted for a 36.7% growth during the forecast period.
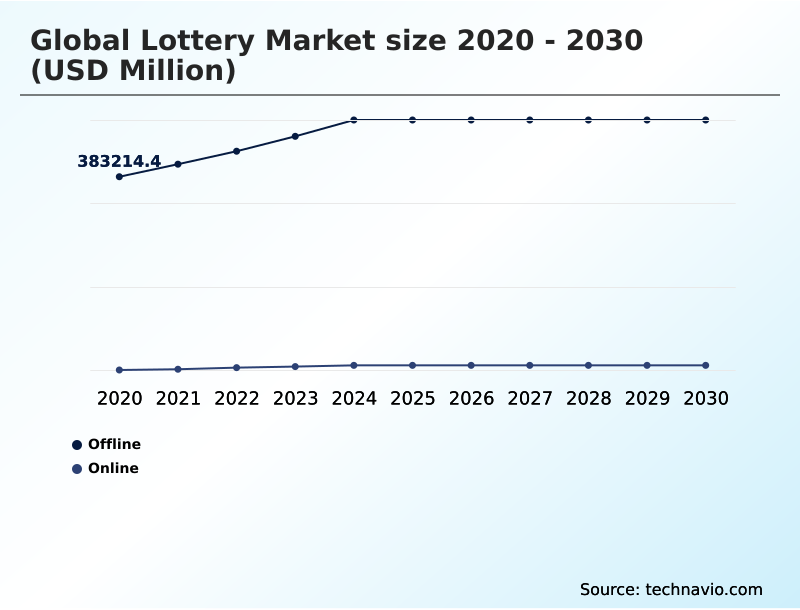
  • By Platform - Offline segment was valued at USD 489.50 billion in 2024
  • By Type - Terminal-based games segment accounted for the largest market revenue share in 2024

Market Size & Forecast

  • Market Opportunities: USD 395.66 billion
  • Market Future Opportunities: USD 243.96 billion
  • CAGR from 2025 to 2030 : 7.5%

Market Summary

  • The lottery market is advancing beyond traditional games of chance into a sophisticated, technology-driven entertainment sector. Key drivers include the psychological allure of large, life-changing jackpots and the convenience afforded by widespread smartphone adoption, which has catalyzed a definitive shift toward online and mobile platforms.
  • A primary trend is the development of innovative game formats, such as gamified e-instant games and themed scratch-offs, designed to attract younger, digitally native audiences seeking interactive experiences. This evolution introduces challenges, notably the intense competition from agile online gambling platforms and the need for robust cybersecurity to protect digital ticket systems from fraud.
  • In a typical business scenario, a state lottery operator might leverage player behavior analytics to create personalized promotions for its mobile app users, aiming to increase engagement. This strategy must be carefully balanced with responsible gaming protocols to comply with strict regulatory mandates, ensuring the industry’s long-term sustainability and public trust.
  • The continuous modernization of both digital and retail channels is critical for navigating this dynamic landscape.

What will be the Size of the Lottery Market during the forecast period?

Get Key Insights on Market Forecast (PDF) Request Free Sample

How is the Lottery Market Segmented?

The lottery industry research report provides comprehensive data (region-wise segment analysis), with forecasts and estimates in "USD million" for the period 2026-2030, as well as historical data from 2020-2024 for the following segments.

  • Platform
    • Offline
    • Online
  • Type
    • Terminal-based games
    • Scratch-off games
    • Sports lotteries
  • Device
    • Desktop
    • Mobile
  • Geography
    • North America
      • US
      • Canada
      • Mexico
    • APAC
      • China
      • Japan
      • India
    • Europe
      • UK
      • France
      • Germany
    • South America
      • Brazil
      • Argentina
      • Colombia
    • Middle East and Africa
      • South Africa
      • UAE
      • Turkey
    • Rest of World (ROW)

By Platform Insights

The offline segment is estimated to witness significant growth during the forecast period.

The offline segment remains the foundation of the lottery market, heavily influenced by established consumer habits and trust in physical transactions. This channel, encompassing traditional terminal-based games and scratch-off games, is supported by extensive retail point-of-sale technology.

To maintain relevance, operators are implementing omnichannel strategies that create a seamless omnichannel experience and improve customer journey mapping. Integrating digital wallet integration at physical locations and offering subscription-based models are key tactics.

These efforts enhance the prize distribution process and prize fund management while adhering to strict age verification protocols.

Effective omnichannel retail integration has demonstrated an ability to increase customer lifetime values by more than 20% compared to single-channel approaches, defining its strategic importance.

Request Free Sample

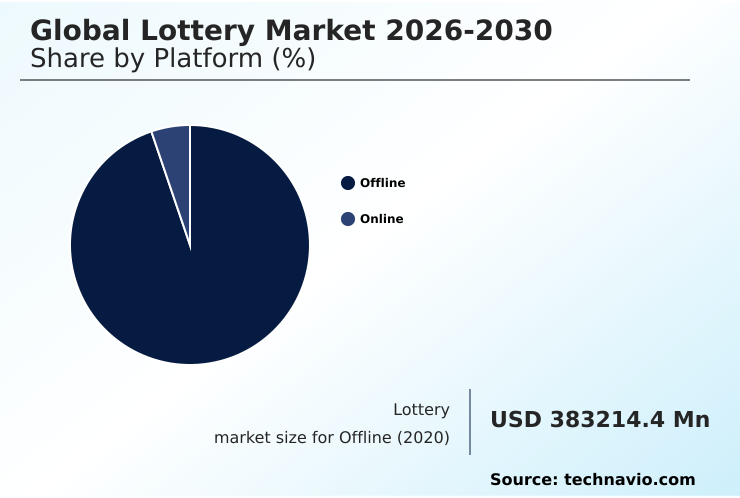
The Offline segment was valued at USD 489.50 billion in 2024 and showed a gradual increase during the forecast period.

Request Free Sample

Regional Analysis

APAC is estimated to contribute 36.7% to the growth of the global market during the forecast period.Technavio’s analysts have elaborately explained the regional trends and drivers that shape the market during the forecast period.

See How Lottery Market Demand is Rising in APAC Request Free Sample

The geographic landscape is defined by digital transformation, with operators in mature regions like North America leveraging cloud-based infrastructure and server-based gaming systems to enhance offerings.

The APAC region is experiencing the fastest growth, with a rate exceeding 8.5%, driven by regulatory modernization that has reduced market entry timelines by over 20% for compliant operators.

Advanced geolocation technology and biometric verification are becoming standard for securing online platforms across jurisdictions. The adoption of sophisticated lottery management software and integrated player management systems allows for predictive analytics to tailor games locally.

Technologies like blockchain technology for draw transparency and digital ticket storage are gaining traction, while contactless payment systems are improving retail experiences on unified gaming platforms, addressing complex licensing requirements.

Market Dynamics

Our researchers analyzed the data with 2025 as the base year, along with the key drivers, trends, and challenges. A holistic analysis of drivers will help companies refine their marketing strategies to gain a competitive advantage.

  • Strategic planning in the modern lottery landscape requires a multi-faceted approach. Operators are prioritizing digital lottery platform security practices to build consumer trust, which is fundamental for success. This focus extends to developing effective online lottery player retention strategies, moving beyond simple acquisition. A critical component is improving lottery platform user experience, as a seamless interface directly impacts engagement.
  • On the regulatory front, navigating the complexities of regulating multi jurisdictional lottery games is a constant challenge that demands legal and technical expertise. The impact of mobile payment integration has been transformative, simplifying transactions and boosting participation. Simultaneously, operators are refining omnichannel strategies for lottery retail to create a unified customer journey.
  • Innovation is evident in gamification techniques in instant win games, making them more appealing to younger demographics. Furthermore, lottery technology adoption in emerging markets presents a significant growth opportunity. The use of blockchain applications for draw transparency is becoming a key differentiator, enhancing credibility. For sustainability, using data analytics for responsible gaming is now a core business practice.
  • This is complemented by ai implementation for lottery fraud detection to protect both players and operators. Marketing efforts are also evolving through targeted digital marketing tactics for ilottery and strategies for enhancing lottery customer lifetime value. Product diversification is seen in sports lottery product development trends, while operational efficiency is gained through cloud infrastructure benefits for lottery operations.
  • Key business metrics include reducing user acquisition costs for ilottery. Looking ahead, future trends in retail lottery distribution, integrating loyalty programs in lottery apps, and effective prize pool management strategies are shaping investment decisions, all within the context of evolving legal frameworks for digital lotteries.
  • Businesses that excel in omnichannel integration report customer lifetime values over 25% higher than those focused on a single channel.

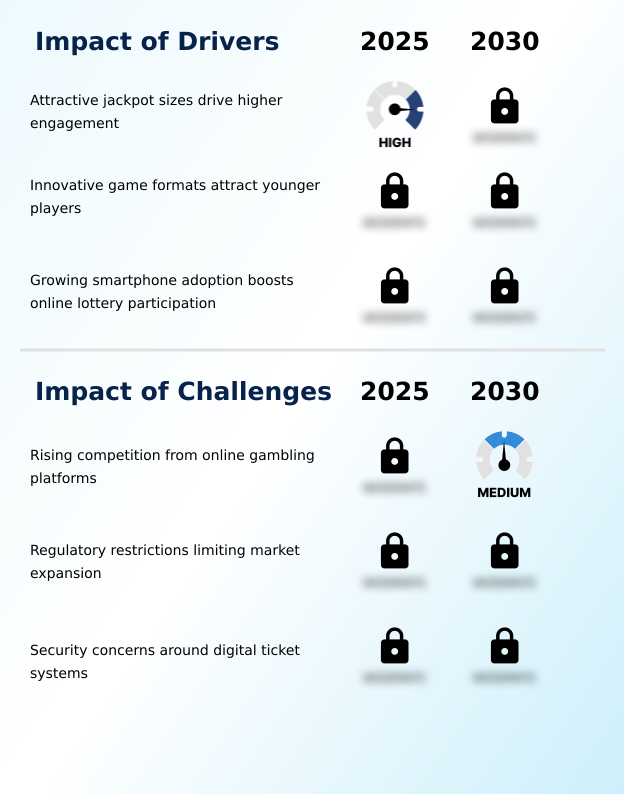
What are the key market drivers leading to the rise in the adoption of Lottery Industry?

  • Attractive jackpot sizes are a key driver of market growth, serving as a powerful psychological trigger that significantly boosts player engagement and participation rates.

  • Market growth is significantly driven by the allure of multi-jurisdictional jackpots, which attract widespread participation. The expansion of game portfolios to include sports lotteries and parlay-style sports lotteries is also attracting new demographics.
  • The proliferation of smartphone adoption globally enables cross-border lottery participation and supports advanced player retention strategies. Operators are leveraging real-time data processing to offer tailored promotional incentives and facilitate peer-to-peer gaming formats.
  • The modernization of draw management infrastructure, including new lottery drawing machines and video lottery terminals, enhances transparency and trust. The integration of third-party courier services has also improved accessibility, boosting ticket sales by up to 15% in urban areas.

What are the market trends shaping the Lottery Industry?

  • A significant trend shaping the industry is the accelerating shift toward online lottery platforms. This migration is fueled by consumer demand for greater convenience and personalized digital experiences.

  • A key trend is the rapid expansion of online lottery platforms and sophisticated digital gaming platforms. These systems offer immersive e-instant games and dynamic gamified draw systems, moving beyond classic lotto-style games. The adoption of mobile lottery services is accelerating, with operators focusing on innovative user acquisition strategies and data-driven personalization to build robust player engagement ecosystems.
  • The availability of mobile ticketing solutions has simplified participation, with some platforms seeing a 40% higher engagement rate from users who opt into gamification elements. The rise of social lottery formats is also notable, creating new avenues for growth in instant win games.

What challenges does the Lottery Industry face during its growth?

  • The industry faces a significant challenge from the rising competition posed by online gambling platforms, which vie for the same consumer discretionary spending and impact market growth.

  • Operators face significant challenges in securing digital ticket systems against sophisticated fraud, including automated bot purchases. Establishing robust responsible gaming frameworks and effective responsible gaming initiatives is critical for long-term sustainability and regulatory compliance.
  • The implementation of advanced fraud detection protocols and anti-money laundering protocols within iLottery solutions is now standard, with systems achieving a 95% accuracy rate in flagging suspicious activities. Ensuring secure gaming environments requires constant investment in end-to-end encryption and rigorous payout verification systems.
  • Furthermore, geofencing technology is essential for managing syndicate market management and complying with jurisdictional rules, while player behavior analytics helps mitigate risks.

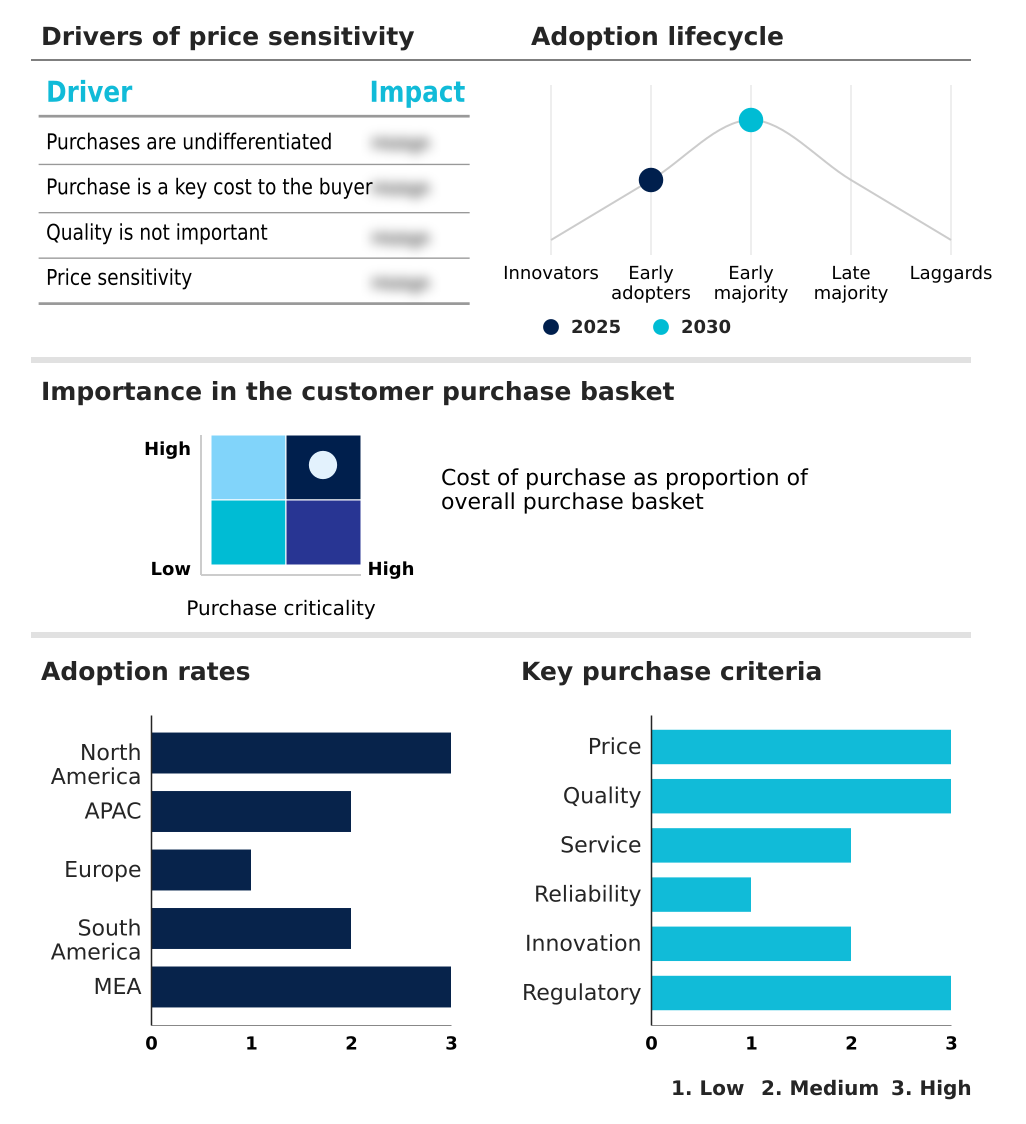
Exclusive Technavio Analysis on Customer Landscape

The lottery market forecasting report includes the adoption lifecycle of the market, covering from the innovator’s stage to the laggard’s stage. It focuses on adoption rates in different regions based on penetration. Furthermore, the lottery market report also includes key purchase criteria and drivers of price sensitivity to help companies evaluate and develop their market growth analysis strategies.

Customer Landscape of Lottery Industry

Competitive Landscape

Companies are implementing various strategies, such as strategic alliances, lottery market forecast, partnerships, mergers and acquisitions, geographical expansion, and product/service launches, to enhance their presence in the industry.

AGTech Holdings Ltd - Key offerings include integrated lottery technology platforms, mobile services, and comprehensive gaming systems designed for regulated markets.

The industry research and growth report includes detailed analyses of the competitive landscape of the market and information about key companies, including:

  • AGTech Holdings Ltd
  • Allwyn Entertainment
  • Arizona Lottery
  • Brightstar Group
  • China Ecotourism Group Ltd
  • Florida Lottery
  • Genlot Game Technology Co Ltd.
  • Innosoft Group
  • Inspired Entertainment Inc.
  • International Game Technology
  • INTRALOT SA
  • Lotto NZ
  • Macau SLOT Co. Ltd.
  • NeoGames S.A.
  • Pollard Banknote Ltd.
  • Smartplay International Inc.
  • SoftConstruct
  • STM LOTTERY SDN BHD

Qualitative and quantitative analysis of companies has been conducted to help clients understand the wider business environment as well as the strengths and weaknesses of key industry players. Data is qualitatively analyzed to categorize companies as pure play, category-focused, industry-focused, and diversified; it is quantitatively analyzed to categorize companies as dominant, leading, strong, tentative, and weak.

Recent Development and News in Lottery market

  • In February 2025, Scientific Games secured a ten-year contract to become the full-line provider for the New Mexico Lottery, transitioning the lottery to its Enhanced Partnership program.
  • In April 2025, the British Columbia Lottery Corporation entered a strategic partnership with SCCG Management to conduct a comprehensive review of its technology and market strategies.
  • In August 2025, India's Parliament enacted the Promotion and Regulation of Online Gaming Bill, creating a national regulatory body to oversee digital gaming and lottery activities.
  • In March 2025, the Massachusetts government passed a state budget that enabled the launch of online lottery sales, marking a significant policy shift in a key US market.

Dive into Technavio’s robust research methodology, blending expert interviews, extensive data synthesis, and validated models for unparalleled Lottery Market insights. See full methodology.

Market Scope
Page number 287
Base year 2025
Historic period 2020-2024
Forecast period 2026-2030
Growth momentum & CAGR Accelerate at a CAGR of 7.5%
Market growth 2026-2030 USD 243956.0 million
Market structure Fragmented
YoY growth 2025-2026(%) 7.2%
Key countries US, Canada, Mexico, China, Japan, India, South Korea, Australia, Thailand, UK, France, Germany, Italy, Spain, Russia, Brazil, Argentina, Colombia, South Africa, Morocco, UAE, Turkey and Saudi Arabia
Competitive landscape Leading Companies, Market Positioning of Companies, Competitive Strategies, and Industry Risks

Request Free Sample

Research Analyst Overview

  • The lottery market is undergoing a fundamental transformation, driven by the convergence of digital innovation and evolving consumer expectations. The transition from traditional terminal-based games and physical scratch-off games to dynamic online lottery platforms is reshaping the industry's core. Operators are now focused on deploying integrated iLottery solutions that feature e-instant games and interactive gamified draw systems.
  • This digital shift necessitates robust cloud-based infrastructure and server-based gaming systems to support mobile lottery services and complex lotto-style games. A key boardroom-level decision centers on balancing investment in new digital gaming platforms against modernizing retail point-of-sale technology for a complete omnichannel retail integration.
  • The integrity of operations hinges on secure digital ticket systems and transparent draw management infrastructure, including certified lottery drawing machines and digital random number generators. The market for sports lotteries, including parlay-style sports lotteries and video lottery terminals, introduces new revenue streams but also demands stringent responsible gaming frameworks.
  • Implementing advanced player management systems and lottery management software has become critical, with some operators seeing a 20% improvement in operational efficiency. Security measures like biometric verification and geolocation technology, along with blockchain technology for the prize distribution process, are no longer optional.
  • The entire ecosystem, from the random number generator to the payout verification systems, must operate within secure gaming environments to prevent issues like automated bot purchases and maintain trust, all as part of cohesive omnichannel strategies.

What are the Key Data Covered in this Lottery Market Research and Growth Report?

  • What is the expected growth of the Lottery Market between 2026 and 2030?

    • USD 243.96 billion, at a CAGR of 7.5%

  • What segmentation does the market report cover?

    • The report is segmented by Platform (Offline, and Online), Type (Terminal-based games, Scratch-off games, and Sports lotteries), Device (Desktop, and Mobile) and Geography (North America, APAC, Europe, South America, Middle East and Africa)

  • Which regions are analyzed in the report?

    • North America, APAC, Europe, South America and Middle East and Africa

  • What are the key growth drivers and market challenges?

    • Attractive jackpot sizes drive higher engagement, Rising competition from online gambling platforms

  • Who are the major players in the Lottery Market?

    • AGTech Holdings Ltd, Allwyn Entertainment, Arizona Lottery, Brightstar Group, China Ecotourism Group Ltd, Florida Lottery, Genlot Game Technology Co Ltd., Innosoft Group, Inspired Entertainment Inc., International Game Technology, INTRALOT SA, Lotto NZ, Macau SLOT Co. Ltd., NeoGames S.A., Pollard Banknote Ltd., Smartplay International Inc., SoftConstruct and STM LOTTERY SDN BHD

Market Research Insights

  • The market's dynamics are shaped by the dual forces of digital transformation and regulatory evolution. The increasing adoption of digital payment systems has streamlined the customer journey, with operators reporting up to a 15% increase in transaction completion rates on mobile platforms. This shift is supported by robust player engagement ecosystems designed to enhance customer lifetime value through data-driven personalization.
  • However, these advancements are balanced by the persistent challenge of security concerns around digital ticketing. To maintain trust, operators are investing in advanced fraud detection protocols and end-to-end encryption, which can increase operational costs by 10% but also reduce fraudulent activities by over 90%. Strategic success depends on leveraging technology for user acquisition while navigating complex responsible gaming initiatives.

We can help! Our analysts can customize this lottery market research report to meet your requirements.

Get in touch

1. Executive Summary

1.1 Market overview

Executive Summary - Chart on Market Overview
Executive Summary - Data Table on Market Overview
Executive Summary - Chart on Global Market Characteristics
Executive Summary - Chart on Market by Geography
Executive Summary - Chart on Market Segmentation by Platform
Executive Summary - Chart on Market Segmentation by Type
Executive Summary - Chart on Market Segmentation by Device
Executive Summary - Chart on Incremental Growth
Executive Summary - Data Table on Incremental Growth
Executive Summary - Chart on Company Market Positioning

2. Technavio Analysis

2.1 Analysis of price sensitivity, lifecycle, customer purchase basket, adoption rates, and purchase criteria

2.2 Criticality of inputs and Factors of differentiation

Chart on Overview on criticality of inputs and factors of differentiation

2.3 Factors of disruption

Chart on Overview on factors of disruption

2.4 Impact of drivers and challenges

Chart on Impact of drivers and challenges in 2025 and 2030

3. Market Landscape

3.1 Market ecosystem

Chart on Parent Market
Data Table on - Parent Market

3.2 Market characteristics

Chart on Market characteristics analysis

3.3 Value chain analysis

Chart on Value chain analysis

4. Market Sizing

4.1 Market definition

Data Table on Offerings of companies included in the market definition

4.2 Market segment analysis

Market segments

4.3 Market size 2025

4.4 Market outlook: Forecast for 2025-2030

Chart on Global - Market size and forecast 2025-2030 ($ million)
Data Table on Global - Market size and forecast 2025-2030 ($ million)
Chart on Global Market: Year-over-year growth 2025-2030 (%)
Data Table on Global Market: Year-over-year growth 2025-2030 (%)

5. Historic Market Size

5.1 Global Lottery Market 2020 - 2024

Historic Market Size - Data Table on Global Lottery Market 2020 - 2024 ($ million)

5.2 Platform segment analysis 2020 - 2024

Historic Market Size - Platform Segment 2020 - 2024 ($ million)

5.3 Type segment analysis 2020 - 2024

Historic Market Size - Type Segment 2020 - 2024 ($ million)

5.4 Device segment analysis 2020 - 2024

Historic Market Size - Device Segment 2020 - 2024 ($ million)

5.5 Geography segment analysis 2020 - 2024

Historic Market Size - Geography Segment 2020 - 2024 ($ million)

5.6 Country segment analysis 2020 - 2024

Historic Market Size - Country Segment 2020 - 2024 ($ million)

6. Qualitative Analysis

6.1 The AI impact on Global Lottery Market

6.2 Impact of Geopolitical Conflicts on Global Lottery Market

7. Five Forces Analysis

7.1 Five forces summary

Five forces analysis - Comparison between 2025 and 2030

7.2 Bargaining power of buyers

Bargaining power of buyers - Impact of key factors 2025 and 2030

7.3 Bargaining power of suppliers

Bargaining power of suppliers - Impact of key factors in 2025 and 2030

7.4 Threat of new entrants

Threat of new entrants - Impact of key factors in 2025 and 2030

7.5 Threat of substitutes

Threat of substitutes - Impact of key factors in 2025 and 2030

7.6 Threat of rivalry

Threat of rivalry - Impact of key factors in 2025 and 2030

7.7 Market condition

Chart on Market condition - Five forces 2025 and 2030

8. Market Segmentation by Platform

8.1 Market segments

Chart on Platform - Market share 2025-2030 (%)
Data Table on Platform - Market share 2025-2030 (%)

8.2 Comparison by Platform

Chart on Comparison by Platform
Data Table on Comparison by Platform

8.3 Offline - Market size and forecast 2025-2030

Chart on Offline - Market size and forecast 2025-2030 ($ million)
Data Table on Offline - Market size and forecast 2025-2030 ($ million)
Chart on Offline - Year-over-year growth 2025-2030 (%)
Data Table on Offline - Year-over-year growth 2025-2030 (%)

8.4 Online - Market size and forecast 2025-2030

Chart on Online - Market size and forecast 2025-2030 ($ million)
Data Table on Online - Market size and forecast 2025-2030 ($ million)
Chart on Online - Year-over-year growth 2025-2030 (%)
Data Table on Online - Year-over-year growth 2025-2030 (%)

8.5 Market opportunity by Platform

Market opportunity by Platform ($ million)
Data Table on Market opportunity by Platform ($ million)

9. Market Segmentation by Type

9.1 Market segments

Chart on Type - Market share 2025-2030 (%)
Data Table on Type - Market share 2025-2030 (%)

9.2 Comparison by Type

Chart on Comparison by Type
Data Table on Comparison by Type

9.3 Terminal-based games - Market size and forecast 2025-2030

Chart on Terminal-based games - Market size and forecast 2025-2030 ($ million)
Data Table on Terminal-based games - Market size and forecast 2025-2030 ($ million)
Chart on Terminal-based games - Year-over-year growth 2025-2030 (%)
Data Table on Terminal-based games - Year-over-year growth 2025-2030 (%)

9.4 Scratch-off games - Market size and forecast 2025-2030

Chart on Scratch-off games - Market size and forecast 2025-2030 ($ million)
Data Table on Scratch-off games - Market size and forecast 2025-2030 ($ million)
Chart on Scratch-off games - Year-over-year growth 2025-2030 (%)
Data Table on Scratch-off games - Year-over-year growth 2025-2030 (%)

9.5 Sports lotteries - Market size and forecast 2025-2030

Chart on Sports lotteries - Market size and forecast 2025-2030 ($ million)
Data Table on Sports lotteries - Market size and forecast 2025-2030 ($ million)
Chart on Sports lotteries - Year-over-year growth 2025-2030 (%)
Data Table on Sports lotteries - Year-over-year growth 2025-2030 (%)

9.6 Market opportunity by Type

Market opportunity by Type ($ million)
Data Table on Market opportunity by Type ($ million)

10. Market Segmentation by Device

10.1 Market segments

Chart on Device - Market share 2025-2030 (%)
Data Table on Device - Market share 2025-2030 (%)

10.2 Comparison by Device

Chart on Comparison by Device
Data Table on Comparison by Device

10.3 Desktop - Market size and forecast 2025-2030

Chart on Desktop - Market size and forecast 2025-2030 ($ million)
Data Table on Desktop - Market size and forecast 2025-2030 ($ million)
Chart on Desktop - Year-over-year growth 2025-2030 (%)
Data Table on Desktop - Year-over-year growth 2025-2030 (%)

10.4 Mobile - Market size and forecast 2025-2030

Chart on Mobile - Market size and forecast 2025-2030 ($ million)
Data Table on Mobile - Market size and forecast 2025-2030 ($ million)
Chart on Mobile - Year-over-year growth 2025-2030 (%)
Data Table on Mobile - Year-over-year growth 2025-2030 (%)

10.5 Market opportunity by Device

Market opportunity by Device ($ million)
Data Table on Market opportunity by Device ($ million)

11. Customer Landscape

11.1 Customer landscape overview

Analysis of price sensitivity, lifecycle, customer purchase basket, adoption rates, and purchase criteria

12. Geographic Landscape

12.1 Geographic segmentation

Chart on Market share by geography 2025-2030 (%)
Data Table on Market share by geography 2025-2030 (%)

12.2 Geographic comparison

Chart on Geographic comparison
Data Table on Geographic comparison

12.3 North America - Market size and forecast 2025-2030

Chart on North America - Market size and forecast 2025-2030 ($ million)
Data Table on North America - Market size and forecast 2025-2030 ($ million)
Chart on North America - Year-over-year growth 2025-2030 (%)
Data Table on North America - Year-over-year growth 2025-2030 (%)
Chart on Regional Comparison - North America
Data Table on Regional Comparison - North America

12.3.1 US - Market size and forecast 2025-2030

Chart on US - Market size and forecast 2025-2030 ($ million)
Data Table on US - Market size and forecast 2025-2030 ($ million)
Chart on US - Year-over-year growth 2025-2030 (%)
Data Table on US - Year-over-year growth 2025-2030 (%)

12.3.2 Canada - Market size and forecast 2025-2030

Chart on Canada - Market size and forecast 2025-2030 ($ million)
Data Table on Canada - Market size and forecast 2025-2030 ($ million)
Chart on Canada - Year-over-year growth 2025-2030 (%)
Data Table on Canada - Year-over-year growth 2025-2030 (%)

12.3.3 Mexico - Market size and forecast 2025-2030

Chart on Mexico - Market size and forecast 2025-2030 ($ million)
Data Table on Mexico - Market size and forecast 2025-2030 ($ million)
Chart on Mexico - Year-over-year growth 2025-2030 (%)
Data Table on Mexico - Year-over-year growth 2025-2030 (%)

12.4 APAC - Market size and forecast 2025-2030

Chart on APAC - Market size and forecast 2025-2030 ($ million)
Data Table on APAC - Market size and forecast 2025-2030 ($ million)
Chart on APAC - Year-over-year growth 2025-2030 (%)
Data Table on APAC - Year-over-year growth 2025-2030 (%)
Chart on Regional Comparison - APAC
Data Table on Regional Comparison - APAC

12.4.1 China - Market size and forecast 2025-2030

Chart on China - Market size and forecast 2025-2030 ($ million)
Data Table on China - Market size and forecast 2025-2030 ($ million)
Chart on China - Year-over-year growth 2025-2030 (%)
Data Table on China - Year-over-year growth 2025-2030 (%)

12.4.2 Japan - Market size and forecast 2025-2030

Chart on Japan - Market size and forecast 2025-2030 ($ million)
Data Table on Japan - Market size and forecast 2025-2030 ($ million)
Chart on Japan - Year-over-year growth 2025-2030 (%)
Data Table on Japan - Year-over-year growth 2025-2030 (%)

12.4.3 India - Market size and forecast 2025-2030

Chart on India - Market size and forecast 2025-2030 ($ million)
Data Table on India - Market size and forecast 2025-2030 ($ million)
Chart on India - Year-over-year growth 2025-2030 (%)
Data Table on India - Year-over-year growth 2025-2030 (%)

12.4.4 South Korea - Market size and forecast 2025-2030

Chart on South Korea - Market size and forecast 2025-2030 ($ million)
Data Table on South Korea - Market size and forecast 2025-2030 ($ million)
Chart on South Korea - Year-over-year growth 2025-2030 (%)
Data Table on South Korea - Year-over-year growth 2025-2030 (%)

12.4.5 Australia - Market size and forecast 2025-2030

Chart on Australia - Market size and forecast 2025-2030 ($ million)
Data Table on Australia - Market size and forecast 2025-2030 ($ million)
Chart on Australia - Year-over-year growth 2025-2030 (%)
Data Table on Australia - Year-over-year growth 2025-2030 (%)

12.4.6 Thailand - Market size and forecast 2025-2030

Chart on Thailand - Market size and forecast 2025-2030 ($ million)
Data Table on Thailand - Market size and forecast 2025-2030 ($ million)
Chart on Thailand - Year-over-year growth 2025-2030 (%)
Data Table on Thailand - Year-over-year growth 2025-2030 (%)

12.5 Europe - Market size and forecast 2025-2030

Chart on Europe - Market size and forecast 2025-2030 ($ million)
Data Table on Europe - Market size and forecast 2025-2030 ($ million)
Chart on Europe - Year-over-year growth 2025-2030 (%)
Data Table on Europe - Year-over-year growth 2025-2030 (%)
Chart on Regional Comparison - Europe
Data Table on Regional Comparison - Europe

12.5.1 UK - Market size and forecast 2025-2030

Chart on UK - Market size and forecast 2025-2030 ($ million)
Data Table on UK - Market size and forecast 2025-2030 ($ million)
Chart on UK - Year-over-year growth 2025-2030 (%)
Data Table on UK - Year-over-year growth 2025-2030 (%)

12.5.2 France - Market size and forecast 2025-2030

Chart on France - Market size and forecast 2025-2030 ($ million)
Data Table on France - Market size and forecast 2025-2030 ($ million)
Chart on France - Year-over-year growth 2025-2030 (%)
Data Table on France - Year-over-year growth 2025-2030 (%)

12.5.3 Germany - Market size and forecast 2025-2030

Chart on Germany - Market size and forecast 2025-2030 ($ million)
Data Table on Germany - Market size and forecast 2025-2030 ($ million)
Chart on Germany - Year-over-year growth 2025-2030 (%)
Data Table on Germany - Year-over-year growth 2025-2030 (%)

12.5.4 Italy - Market size and forecast 2025-2030

Chart on Italy - Market size and forecast 2025-2030 ($ million)
Data Table on Italy - Market size and forecast 2025-2030 ($ million)
Chart on Italy - Year-over-year growth 2025-2030 (%)
Data Table on Italy - Year-over-year growth 2025-2030 (%)

12.5.5 Spain - Market size and forecast 2025-2030

Chart on Spain - Market size and forecast 2025-2030 ($ million)
Data Table on Spain - Market size and forecast 2025-2030 ($ million)
Chart on Spain - Year-over-year growth 2025-2030 (%)
Data Table on Spain - Year-over-year growth 2025-2030 (%)

12.5.6 Russia - Market size and forecast 2025-2030

Chart on Russia - Market size and forecast 2025-2030 ($ million)
Data Table on Russia - Market size and forecast 2025-2030 ($ million)
Chart on Russia - Year-over-year growth 2025-2030 (%)
Data Table on Russia - Year-over-year growth 2025-2030 (%)

12.6 South America - Market size and forecast 2025-2030

Chart on South America - Market size and forecast 2025-2030 ($ million)
Data Table on South America - Market size and forecast 2025-2030 ($ million)
Chart on South America - Year-over-year growth 2025-2030 (%)
Data Table on South America - Year-over-year growth 2025-2030 (%)
Chart on Regional Comparison - South America
Data Table on Regional Comparison - South America

12.6.1 Brazil - Market size and forecast 2025-2030

Chart on Brazil - Market size and forecast 2025-2030 ($ million)
Data Table on Brazil - Market size and forecast 2025-2030 ($ million)
Chart on Brazil - Year-over-year growth 2025-2030 (%)
Data Table on Brazil - Year-over-year growth 2025-2030 (%)

12.6.2 Argentina - Market size and forecast 2025-2030

Chart on Argentina - Market size and forecast 2025-2030 ($ million)
Data Table on Argentina - Market size and forecast 2025-2030 ($ million)
Chart on Argentina - Year-over-year growth 2025-2030 (%)
Data Table on Argentina - Year-over-year growth 2025-2030 (%)

12.6.3 Colombia - Market size and forecast 2025-2030

Chart on Colombia - Market size and forecast 2025-2030 ($ million)
Data Table on Colombia - Market size and forecast 2025-2030 ($ million)
Chart on Colombia - Year-over-year growth 2025-2030 (%)
Data Table on Colombia - Year-over-year growth 2025-2030 (%)

12.7 Middle East and Africa - Market size and forecast 2025-2030

Chart on Middle East and Africa - Market size and forecast 2025-2030 ($ million)
Data Table on Middle East and Africa - Market size and forecast 2025-2030 ($ million)
Chart on Middle East and Africa - Year-over-year growth 2025-2030 (%)
Data Table on Middle East and Africa - Year-over-year growth 2025-2030 (%)
Chart on Regional Comparison - Middle East and Africa
Data Table on Regional Comparison - Middle East and Africa

12.7.1 South Africa - Market size and forecast 2025-2030

Chart on South Africa - Market size and forecast 2025-2030 ($ million)
Data Table on South Africa - Market size and forecast 2025-2030 ($ million)
Chart on South Africa - Year-over-year growth 2025-2030 (%)
Data Table on South Africa - Year-over-year growth 2025-2030 (%)

12.7.2 Morocco - Market size and forecast 2025-2030

Chart on Morocco - Market size and forecast 2025-2030 ($ million)
Data Table on Morocco - Market size and forecast 2025-2030 ($ million)
Chart on Morocco - Year-over-year growth 2025-2030 (%)
Data Table on Morocco - Year-over-year growth 2025-2030 (%)

12.7.3 UAE - Market size and forecast 2025-2030

Chart on UAE - Market size and forecast 2025-2030 ($ million)
Data Table on UAE - Market size and forecast 2025-2030 ($ million)
Chart on UAE - Year-over-year growth 2025-2030 (%)
Data Table on UAE - Year-over-year growth 2025-2030 (%)

12.7.4 Turkey - Market size and forecast 2025-2030

Chart on Turkey - Market size and forecast 2025-2030 ($ million)
Data Table on Turkey - Market size and forecast 2025-2030 ($ million)
Chart on Turkey - Year-over-year growth 2025-2030 (%)
Data Table on Turkey - Year-over-year growth 2025-2030 (%)

12.7.5 Saudi Arabia - Market size and forecast 2025-2030

Chart on Saudi Arabia - Market size and forecast 2025-2030 ($ million)
Data Table on Saudi Arabia - Market size and forecast 2025-2030 ($ million)
Chart on Saudi Arabia - Year-over-year growth 2025-2030 (%)
Data Table on Saudi Arabia - Year-over-year growth 2025-2030 (%)

12.8 Market opportunity by geography

Market opportunity by geography ($ million)
Data Tables on Market opportunity by geography ($ million)

13. Drivers, Challenges, and Opportunity

13.1 Market drivers

Attractive jackpot sizes drive higher engagement
Innovative game formats attract younger players
Growing smartphone adoption boosts online lottery participation

13.2 Market challenges

Rising competition from online gambling platforms
Regulatory restrictions limiting market expansion
Security concerns around digital ticket systems

13.3 Impact of drivers and challenges

Impact of drivers and challenges in 2025 and 2030

13.4 Market opportunities

Rapid shift toward online lottery platforms
Increasing adoption of digital payment systems
Strong demand for innovative scratch‑off games

14. Competitive Landscape

14.1 Overview

14.2

Overview on criticality of inputs and factors of differentiation

14.3 Landscape disruption

Overview on factors of disruption

14.4 Industry risks

Impact of key risks on business

15. Competitive Analysis

15.1 Companies profiled

Companies covered

15.2 Company ranking index

15.3 Market positioning of companies

Matrix on companies position and classification

15.4 AGTech Holdings Ltd

AGTech Holdings Ltd - Overview
AGTech Holdings Ltd - Business segments
AGTech Holdings Ltd - Key offerings
AGTech Holdings Ltd - Segment focus
SWOT

15.5 Allwyn Entertainment

Allwyn Entertainment - Overview
Allwyn Entertainment - Product / Service
Allwyn Entertainment - Key offerings
SWOT

15.6 Arizona Lottery

Arizona Lottery - Overview
Arizona Lottery - Product / Service
Arizona Lottery - Key offerings
SWOT

15.7 Brightstar Group

Brightstar Group - Overview
Brightstar Group - Product / Service
Brightstar Group - Key offerings
SWOT

15.8 Florida Lottery

Florida Lottery - Overview
Florida Lottery - Product / Service
Florida Lottery - Key offerings
SWOT

15.9 Genlot Game Technology Co Ltd.

Genlot Game Technology Co Ltd. - Overview
Genlot Game Technology Co Ltd. - Product / Service
Genlot Game Technology Co Ltd. - Key offerings
SWOT

15.10 Innosoft Group

Innosoft Group - Overview
Innosoft Group - Product / Service
Innosoft Group - Key offerings
SWOT

15.11 Inspired Entertainment Inc.

Inspired Entertainment Inc. - Overview
Inspired Entertainment Inc. - Product / Service
Inspired Entertainment Inc. - Key offerings
SWOT

15.12 International Game Technology

International Game Technology - Overview
International Game Technology - Business segments
International Game Technology - Key offerings
International Game Technology - Segment focus
SWOT

15.13 INTRALOT SA

INTRALOT SA - Overview
INTRALOT SA - Business segments
INTRALOT SA - Key offerings
INTRALOT SA - Segment focus
SWOT

15.14 Lotto NZ

Lotto NZ - Overview
Lotto NZ - Product / Service
Lotto NZ - Key offerings
SWOT

15.15 Pollard Banknote Ltd.

Pollard Banknote Ltd. - Overview
Pollard Banknote Ltd. - Business segments
Pollard Banknote Ltd. - Key offerings
Pollard Banknote Ltd. - Segment focus
SWOT

15.16 Smartplay International Inc.

Smartplay International Inc. - Overview
Smartplay International Inc. - Product / Service
Smartplay International Inc. - Key offerings
SWOT

15.17 SoftConstruct

SoftConstruct - Overview
SoftConstruct - Product / Service
SoftConstruct - Key offerings
SWOT

15.18 STM LOTTERY SDN BHD

STM LOTTERY SDN BHD - Overview
STM LOTTERY SDN BHD - Product / Service
STM LOTTERY SDN BHD - Key offerings
SWOT

16. Appendix

16.1 Scope of the report

Market definition
Objectives
Notes and caveats

16.2 Inclusions and exclusions checklist

Inclusions checklist
Exclusions checklist

16.3 Currency conversion rates for US$

16.4 Research methodology

16.5 Data procurement

Information sources

16.6 Data validation

16.7 Validation techniques employed for market sizing

16.8 Data synthesis

16.9 360 degree market analysis

16.10 List of abbreviations

Research Methodology

Technavio presents a detailed picture of the market by way of study, synthesis, and summation of data from multiple sources. The analysts have presented the various facets of the market with a particular focus on identifying the key industry influencers. The data thus presented is comprehensive, reliable, and the result of extensive research, both primary and secondary.

INFORMATION SOURCES

Primary sources

  • Manufacturers and suppliers
  • Channel partners
  • Industry experts
  • Strategic decision makers

Secondary sources

  • Industry journals and periodicals
  • Government data
  • Financial reports of key industry players
  • Historical data
  • Press releases

DATA ANALYSIS

Data Synthesis

  • Collation of data
  • Estimation of key figures
  • Analysis of derived insights

Data Validation

  • Triangulation with data models
  • Reference against proprietary databases
  • Corroboration with industry experts

REPORT WRITING

Qualitative

  • Market drivers
  • Market challenges
  • Market trends
  • Five forces analysis

Quantitative

  • Market size and forecast
  • Market segmentation
  • Geographical insights
  • Competitive landscape

Interested in this report?

Get your sample now to see our research methodology and insights!

Download Now

Frequently Asked Questions

Lottery market growth will increase by USD 243956.0 million during 2026-2030.

The Lottery market is expected to grow at a CAGR of 7.5% during 2026-2030.

Lottery market is segmented by Platform (Offline, Online) Type (Terminal-based games, Scratch-off games, Sports lotteries) Device (Desktop, Mobile)

AGTech Holdings Ltd, Allwyn Entertainment, Arizona Lottery, Brightstar Group, China Ecotourism Group Ltd, Florida Lottery, Genlot Game Technology Co Ltd., Innosoft Group, Inspired Entertainment Inc., International Game Technology, INTRALOT SA, Lotto NZ, Macau SLOT Co. Ltd., NeoGames S.A., Pollard Banknote Ltd., Smartplay International Inc., SoftConstruct, STM LOTTERY SDN BHD are a few of the key vendors in the Lottery market.

APAC will register the highest growth rate of 36.7% among the other regions. Therefore, the Lottery market in APAC is expected to garner significant business opportunities for the vendors during the forecast period.

US, Canada, Mexico, China, Japan, India, South Korea, Australia, Thailand, UK, France, Germany, Italy, Spain, Russia, Brazil, Argentina, Colombia, South Africa, Morocco, UAE, Turkey, Saudi Arabia

  • Attractive jackpot sizes drive higher engagement is the driving factor this market.

The Lottery market vendors should focus on grabbing business opportunities from the Platform segment as it accounted for the largest market share in the base year.
RIA - Research AI Assistant
Ask RIA