Gaming Market Analysis, Size, and Forecast 2026-2030: APAC (China, Japan, and India), North America (US, Canada, and Mexico), Europe (Germany, UK, and France), Middle East and Africa (Saudi Arabia, UAE, and South Africa), South America (Brazil and Argentina), and Rest of World (ROW)

Gaming Market Analysis, Size, and Forecast 2026-2030:
APAC (China, Japan, and India), North America (US, Canada, and Mexico), Europe (Germany, UK, and France), Middle East and Africa (Saudi Arabia, UAE, and South Africa), South America (Brazil and Argentina), and Rest of World (ROW)

Published: Apr 2026 288 Pages SKU: IRTNTR45494

Market Overview at a Glance

$117.60 B
Market Opportunity
9%
CAGR 2025 - 2030
52.7%
APAC Growth
$129.11 B
Casual gaming segment 2024

Gaming Market Size 2026-2030

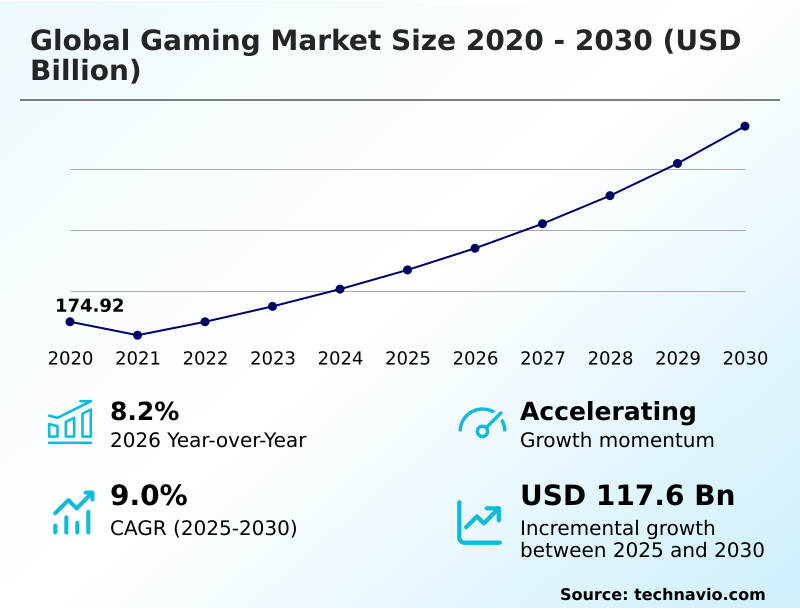
The gaming market size is valued to increase by USD 117.60 billion, at a CAGR of 9% from 2025 to 2030. Institutionalization of platform agnostic cloud gaming infrastructure will drive the gaming market.

Major Market Trends & Insights

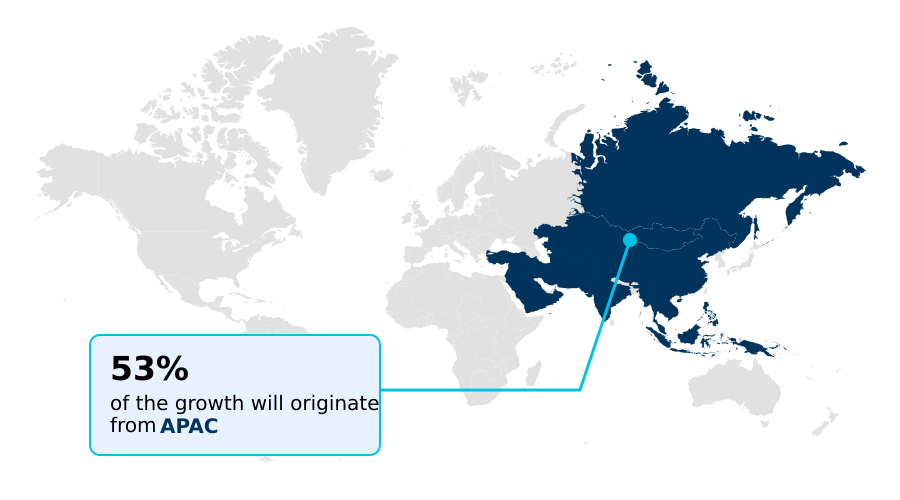
  • APAC dominated the market and accounted for a 52.7% growth during the forecast period.
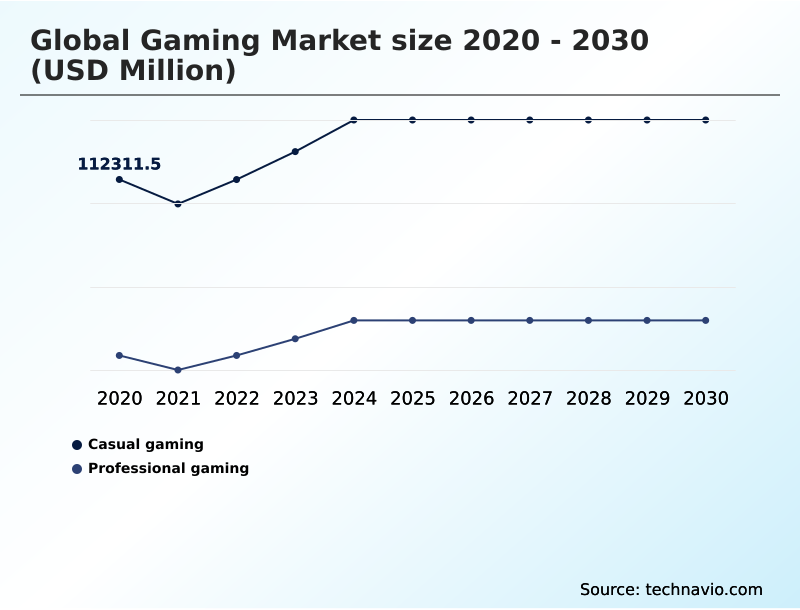
  • By Type - Casual gaming segment was valued at USD 129.11 billion in 2024
  • By Platform - Online segment accounted for the largest market revenue share in 2024

Market Size & Forecast

  • Market Opportunities: USD 160.01 billion
  • Market Future Opportunities: USD 117.60 billion
  • CAGR from 2025 to 2030 : 9%

Market Summary

  • The gaming market is undergoing a significant transformation, driven by the convergence of high-fidelity hardware, cloud-based distribution models, and the integration of artificial intelligence. This evolution is democratizing interactive entertainment across mobile, console, and PC platforms, attracting a broadening demographic. Key market dynamics include the rise of subscription-based services that offer vast content libraries, providing developers with more predictable revenue.
  • For instance, studios leverage AI-driven procedural content generation not just for expansive worlds but to optimize asset pipelines. This involves using machine learning for automated texture mapping and character rigging, reducing manual labor and redirecting resources to core gameplay innovation. However, the industry faces challenges in managing escalating production costs and navigating evolving monetization models to maintain player trust.
  • The expansion of 5G networks and cloud gaming services continues to lower hardware barriers, making high-end titles accessible on a diverse array of connected devices and shaping the future of interactive entertainment.

What will be the Size of the Gaming Market during the forecast period?

Get Key Insights on Market Forecast (PDF) Get Free Sample

How is the Gaming Market Segmented?

The gaming industry research report provides comprehensive data (region-wise segment analysis), with forecasts and estimates in "USD million" for the period 2026-2030, as well as historical data from 2020-2024 for the following segments.

  • Type
    • Casual gaming
    • Professional gaming
  • Platform
    • Online
    • Offline
  • Device
    • Mobile gaming
    • Console gaming
    • PC gaming
  • Geography
    • APAC
      • China
      • Japan
      • India
    • North America
      • US
      • Canada
      • Mexico
    • Europe
      • Germany
      • UK
      • France
    • Middle East and Africa
      • Saudi Arabia
      • UAE
      • South Africa
    • South America
      • Brazil
      • Argentina
    • Rest of World (ROW)

By Type Insights

The casual gaming segment is estimated to witness significant growth during the forecast period.

The casual gaming market is defined by its accessible, low-commitment entertainment, thriving on mobile devices.

This segment is evolving beyond simple mechanics toward hybrid-casual models, blending straightforward retention loops with deeper progression systems like player behavior analytics and personalized difficulty scaling. Integrating social gaming platforms fosters community through non-intensive leaderboards, crucial for player retention metrics.

The focus on community-driven experiences and intuitive hybrid-casual game design ensures long-term engagement. This evolution, supported by effective mobile gaming monetization, has led to a 20% increase in average session lengths.

This strategic shift allows developers to cater to the demand for immediate satisfaction while cultivating sustainable player communities within the vast landscape of digital entertainment.

Get Free Sample

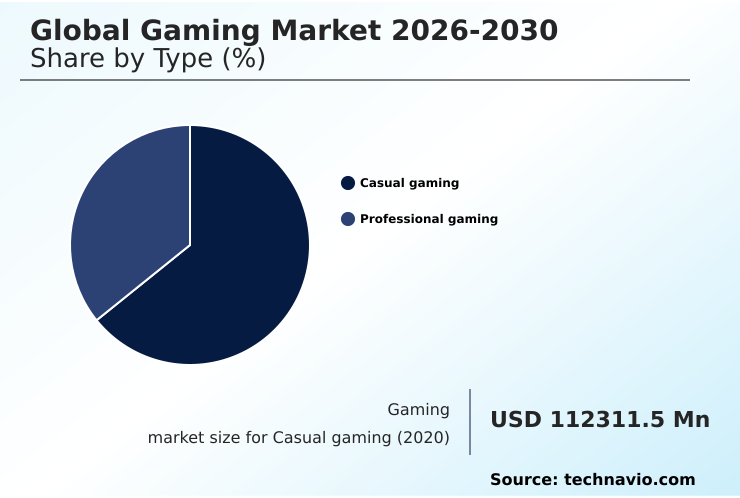
The Casual gaming segment was valued at USD 129.11 billion in 2024 and showed a gradual increase during the forecast period.

Get Free Sample

Regional Analysis

APAC is estimated to contribute 52.7% to the growth of the global market during the forecast period.Technavio’s analysts have elaborately explained the regional trends and drivers that shape the market during the forecast period.

See How Gaming Market Demand is Rising in APAC Get Free Sample

The gaming market's geographic landscape is characterized by the APAC region's dominance, which accounts for over 52% of incremental growth, largely fueled by widespread mobile gaming adoption and a robust esports ecosystem.

In North America, the focus is on cloud gaming infrastructure and AAA game production, where optimization has led to a 20% reduction in hardware-related customer service inquiries.

Europe's market is distinguished by its strong indie game development scene and a stringent focus on regulatory compliance for in-game monetization models.

Meanwhile, the Middle East and Africa is the fastest-growing region, with a strategic push into professional esports and live-service monetization.

This global distribution highlights diverse regional priorities, from mobile-first accessibility and haptic feedback systems in APAC to high-fidelity virtual reality and advanced game engine technology in Western markets.

Market Dynamics

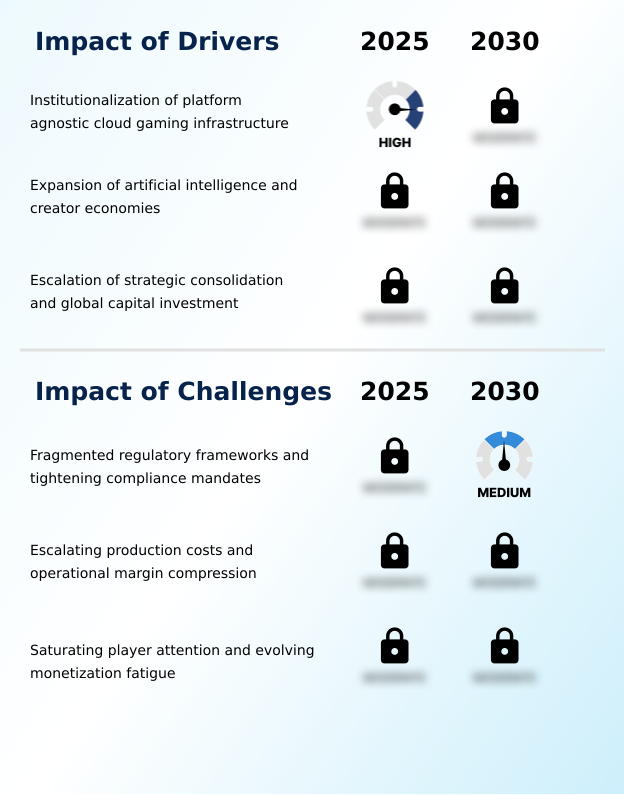
Our researchers analyzed the data with 2025 as the base year, along with the key drivers, trends, and challenges. A holistic analysis of drivers will help companies refine their marketing strategies to gain a competitive advantage.

  • The evolution of the gaming market hinges on resolving complex technical and business challenges. Successfully navigating the development of cross-platform interoperability platforms is paramount for unifying player experiences across disparate hardware. This directly influences the viability of user-generated content platform monetization, as creators require seamless access to a broad audience.
  • Concurrently, the industry is pushing the boundaries of immersion through the optimization of high-fidelity virtual reality experiences, which demand significant computational resources and advanced development techniques. A key strategy for managing content velocity and player engagement is the implementation of generative AI narrative frameworks.
  • Studios that effectively integrate these frameworks report being twice as likely to meet their content delivery schedules compared to those relying on traditional methods. This approach is critical for managing escalating AAA game production costs while delivering the continuous updates expected in live-service games.
  • Furthermore, addressing regulatory compliance in digital asset ownership and developing ethical in-game monetization models are essential for sustaining long-term growth and player trust. The integration of blockchain in virtual economies offers a potential solution, but it must be balanced with the need to build persistent and welcoming online gaming communities.

What are the key market drivers leading to the rise in the adoption of Gaming Industry?

  • The institutionalization of platform-agnostic cloud gaming infrastructure is a key driver for the market, fundamentally decoupling high-fidelity interactive experiences from expensive local hardware.

  • Market growth is significantly driven by the expansion of user-generated content platforms and the institutionalization of cloud-native frameworks. These platforms empower creators and foster a constant influx of community-driven experiences, which see engagement rates 50% higher than traditional developer-led content.
  • The proliferation of generative AI narrative tools further lowers the barrier to entry for high-quality content creation. This technological leap, combined with effective user acquisition strategies, enables smaller studios to rival major productions.
  • The shift to cloud gaming services expands the addressable market by an estimated 30% in regions with low console penetration, turning interactive entertainment into a utility-like service.
  • This dynamic is fueled by real-time content delivery and a focus on intellectual property franchising.

What are the market trends shaping the Gaming Industry?

  • The industrialization of generative AI narrative frameworks represents a key market trend. This development is transitioning game environments from static scripts to dynamic, player-responsive ecosystems.

  • Key trends are reshaping the gaming market, led by the advancement of spatial computing experiences and the adoption of a device-agnostic philosophy. Developers are increasingly focused on creating immersive social hubs and digital third places that transcend traditional gameplay.
  • The use of procedurally generated landscapes, driven by sophisticated algorithms, allows for near-infinite replayability and has been shown to increase long-term player retention by over 25%. Concurrently, the move away from hardware-locked exclusives toward seamless cross-platform data synchronization is becoming standard.
  • This shift enables a persistent player identity, with platforms that support this feature seeing engagement levels up to 40% higher than their siloed counterparts. This convergence of technology is fostering more dynamic player-responsive ecosystems and persistent online communities.

What challenges does the Gaming Industry face during its growth?

  • Fragmented regulatory frameworks and tightening domestic compliance mandates present a key challenge to the industry's growth, introducing significant administrative overhead and potential for market silos.

  • The gaming market faces significant challenges, primarily from escalating AAA title development costs and increasing player fatigue with certain monetization tactics. The financial pressures of AAA production have led to an average 15% increase in development budgets year-over-year, making single-game launches a high-risk endeavor. This is compounded by rising user acquisition costs, particularly in the competitive mobile sector.
  • Furthermore, players are demonstrating growing resistance to aggressive in-game advertising formats and a lack of transparency in battle pass monetization. Studios are observing churn rates as high as 40% within the first 90 days for games perceived as having unfair free-to-play business models, underscoring the need for more ethical, user-centric monetization that prioritizes long-term engagement.

Exclusive Technavio Analysis on Customer Landscape

The gaming market forecasting report includes the adoption lifecycle of the market, covering from the innovator’s stage to the laggard’s stage. It focuses on adoption rates in different regions based on penetration. Furthermore, the gaming market report also includes key purchase criteria and drivers of price sensitivity to help companies evaluate and develop their market growth analysis strategies.

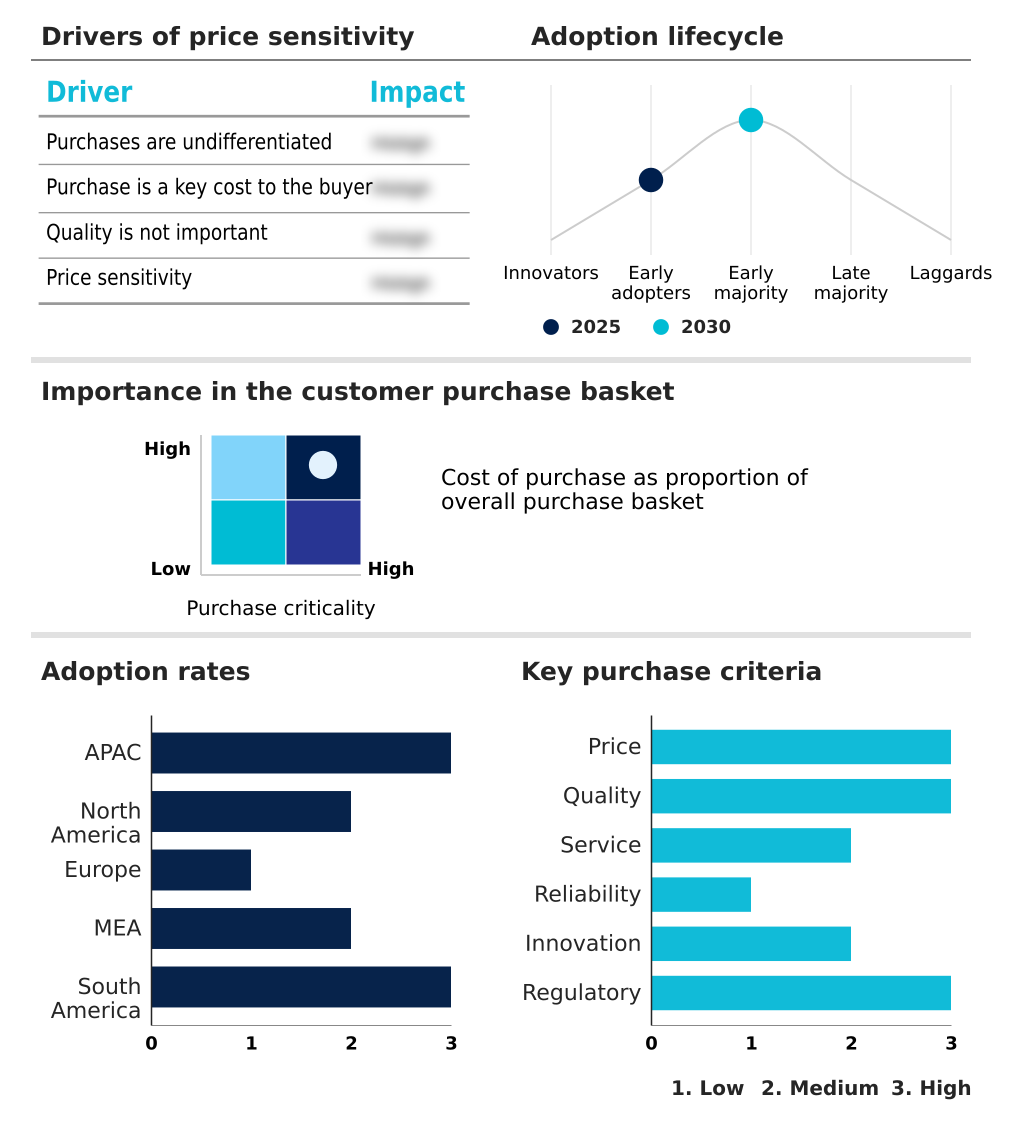
Customer Landscape of Gaming Industry

Competitive Landscape

Companies are implementing various strategies, such as strategic alliances, gaming market forecast, partnerships, mergers and acquisitions, geographical expansion, and product/service launches, to enhance their presence in the industry.

Activision Blizzard Inc. - Leveraging a portfolio of popular video game franchises and extensive digital content is central to driving market engagement and securing a broad, sustained player base.

The industry research and growth report includes detailed analyses of the competitive landscape of the market and information about key companies, including:

  • Activision Blizzard Inc.
  • Apple Inc.
  • BANDAI NAMCO Europe S.A.S
  • Bowlero Corp.
  • Chicago Gaming Co.
  • DeNA Co. Ltd.
  • Electronic Arts Inc.
  • Epic Games Inc.
  • GungHo Online Entertainment Inc
  • NetEase Inc.
  • Netmarble Corp.
  • Niantic Inc.
  • Nintendo Co. Ltd.
  • Rovio Entertainment Corp.
  • Sony Group Corp.
  • Square Enix Limited
  • Tencent Holdings Ltd.
  • The Walt Disney Co.
  • Ubisoft Entertainment SA
  • Zeptolab UK Ltd.

Qualitative and quantitative analysis of companies has been conducted to help clients understand the wider business environment as well as the strengths and weaknesses of key industry players. Data is qualitatively analyzed to categorize companies as pure play, category-focused, industry-focused, and diversified; it is quantitatively analyzed to categorize companies as dominant, leading, strong, tentative, and weak.

Recent Development and News in Gaming market

  • In September 2024, Ubisoft Entertainment SA initiated an organizational reset, decentralizing its global operations into five distinct Creative Houses to accelerate decision-making and sharpen its focus on open-world and games-as-a-service experiences.
  • In November 2024, Savvy Games Group finalized its multi-billion dollar acquisition of Moonton Technology, a strategic move to strengthen its portfolio and dominance in the competitive mobile gaming arena.
  • In January 2025, Nintendo Co. Ltd. began the formal release of its next-generation hybrid console in key South American markets, including Argentina, marking a significant expansion of next-generation hardware accessibility in the region.
  • In May 2025, Capcom announced that its new science-fiction IP, Pragmata, surpassed one million units sold within its first week, a success attributed to its innovative gameplay and advanced AI systems.

Dive into Technavio’s robust research methodology, blending expert interviews, extensive data synthesis, and validated models for unparalleled Gaming Market insights. See full methodology.

Market Scope
Page number 288
Base year 2025
Historic period 2020-2024
Forecast period 2026-2030
Growth momentum & CAGR Accelerate at a CAGR of 9%
Market growth 2026-2030 USD 117602.9 million
Market structure Fragmented
YoY growth 2025-2026(%) 8.2%
Key countries China, Japan, India, South Korea, Indonesia, Australia, US, Canada, Mexico, Germany, UK, France, Italy, Spain, The Netherlands, Saudi Arabia, UAE, South Africa, Turkey, Israel, Brazil, Argentina and Chile
Competitive landscape Leading Companies, Market Positioning of Companies, Competitive Strategies, and Industry Risks

Request Free Sample

Research Analyst Overview

  • The gaming market is rapidly evolving beyond traditional hardware cycles, driven by the strategic integration of generative artificial intelligence and the expansion of cloud gaming infrastructure. The industry-wide pivot toward platform-agnostic gaming is compelling boardroom-level re-evaluations of long-term investment, shifting focus from proprietary hardware to service-oriented ecosystems centered on cross-platform interoperability and subscription-based gaming services.
  • Studios are leveraging procedural content generation and advanced player behavior analytics to create dynamic experiences while optimizing game development pipelines. For example, firms that have integrated AI-driven asset creation tools have documented up to a 35% reduction in time-to-market for new content expansions.
  • This landscape requires a deep focus on live-service monetization, real-time ray tracing, user-generated content platforms, and low-latency streaming to remain competitive. The success of future titles will depend on mastering game engine technology, digital asset ownership models, and the growing esports ecosystem to capture and retain a global audience.

What are the Key Data Covered in this Gaming Market Research and Growth Report?

  • What is the expected growth of the Gaming Market between 2026 and 2030?

    • USD 117.60 billion, at a CAGR of 9%

  • What segmentation does the market report cover?

    • The report is segmented by Type (Casual gaming, and Professional gaming), Platform (Online, and Offline), Device (Mobile gaming, Console gaming, and PC gaming) and Geography (APAC, North America, Europe, Middle East and Africa, South America)

  • Which regions are analyzed in the report?

    • APAC, North America, Europe, Middle East and Africa and South America

  • What are the key growth drivers and market challenges?

    • Institutionalization of platform agnostic cloud gaming infrastructure, Fragmented regulatory frameworks and tightening compliance mandates

  • Who are the major players in the Gaming Market?

    • Activision Blizzard Inc., Apple Inc., BANDAI NAMCO Europe S.A.S, Bowlero Corp., Chicago Gaming Co., DeNA Co. Ltd., Electronic Arts Inc., Epic Games Inc., GungHo Online Entertainment Inc, NetEase Inc., Netmarble Corp., Niantic Inc., Nintendo Co. Ltd., Rovio Entertainment Corp., Sony Group Corp., Square Enix Limited, Tencent Holdings Ltd., The Walt Disney Co., Ubisoft Entertainment SA and Zeptolab UK Ltd.

Market Research Insights

  • The gaming market's dynamics are shaped by a strategic push toward more immersive and accessible experiences. The adoption of high-fidelity virtual reality has been shown to increase average player session times by over 30% compared to traditional screen-based formats. Concurrently, firms leveraging cloud-native frameworks report up to a 25% reduction in server deployment times, enhancing operational agility.
  • The implementation of generative AI narratives is a pivotal user acquisition strategy, capable of reducing content scripting costs by nearly 50% while vastly expanding narrative depth.
  • This shift toward a device-agnostic philosophy, supported by advancements in cross-platform data synchronization, is critical for maximizing player retention metrics and fostering persistent online communities in an increasingly competitive landscape where user-centric monetization is paramount.

We can help! Our analysts can customize this gaming market research report to meet your requirements.

Get in touch

1. Executive Summary

1.1 Market overview

Executive Summary - Chart on Market Overview
Executive Summary - Data Table on Market Overview
Executive Summary - Chart on Global Market Characteristics
Executive Summary - Chart on Market by Geography
Executive Summary - Chart on Market Segmentation by Type
Executive Summary - Chart on Market Segmentation by Platform
Executive Summary - Chart on Market Segmentation by Device
Executive Summary - Chart on Incremental Growth
Executive Summary - Data Table on Incremental Growth
Executive Summary - Chart on Company Market Positioning

2. Technavio Analysis

2.1 Analysis of price sensitivity, lifecycle, customer purchase basket, adoption rates, and purchase criteria

2.2 Criticality of inputs and Factors of differentiation

Chart on Overview on criticality of inputs and factors of differentiation

2.3 Factors of disruption

Chart on Overview on factors of disruption

2.4 Impact of drivers and challenges

Chart on Impact of drivers and challenges in 2025 and 2030

3. Market Landscape

3.1 Market ecosystem

Chart on Parent Market
Data Table on - Parent Market

3.2 Market characteristics

Chart on Market characteristics analysis

3.3 Value chain analysis

Chart on Value chain analysis

4. Market Sizing

4.1 Market definition

Data Table on Offerings of companies included in the market definition

4.2 Market segment analysis

Market segments

4.3 Market size 2025

4.4 Market outlook: Forecast for 2025-2030

Chart on Global - Market size and forecast 2025-2030 ($ million)
Data Table on Global - Market size and forecast 2025-2030 ($ million)
Chart on Global Market: Year-over-year growth 2025-2030 (%)
Data Table on Global Market: Year-over-year growth 2025-2030 (%)

5. Historic Market Size

5.1 Global Gaming Market 2020 - 2024

Historic Market Size - Data Table on Global Gaming Market 2020 - 2024 ($ million)

5.2 Type segment analysis 2020 - 2024

Historic Market Size - Type Segment 2020 - 2024 ($ million)

5.3 Platform segment analysis 2020 - 2024

Historic Market Size - Platform Segment 2020 - 2024 ($ million)

5.4 Device segment analysis 2020 - 2024

Historic Market Size - Device Segment 2020 - 2024 ($ million)

5.5 Geography segment analysis 2020 - 2024

Historic Market Size - Geography Segment 2020 - 2024 ($ million)

5.6 Country segment analysis 2020 - 2024

Historic Market Size - Country Segment 2020 - 2024 ($ million)

6. Qualitative Analysis

6.1 Impact of AI in global gaming market

6.2 Impact of geopolitical conflict on global gaming market

7. Five Forces Analysis

7.1 Five forces summary

Five forces analysis - Comparison between 2025 and 2030

7.2 Bargaining power of buyers

Bargaining power of buyers - Impact of key factors 2025 and 2030

7.3 Bargaining power of suppliers

Bargaining power of suppliers - Impact of key factors in 2025 and 2030

7.4 Threat of new entrants

Threat of new entrants - Impact of key factors in 2025 and 2030

7.5 Threat of substitutes

Threat of substitutes - Impact of key factors in 2025 and 2030

7.6 Threat of rivalry

Threat of rivalry - Impact of key factors in 2025 and 2030

7.7 Market condition

Chart on Market condition - Five forces 2025 and 2030

8. Market Segmentation by Type

8.1 Market segments

Chart on Type - Market share 2025-2030 (%)
Data Table on Type - Market share 2025-2030 (%)

8.2 Comparison by Type

Chart on Comparison by Type
Data Table on Comparison by Type

8.3 Casual gaming - Market size and forecast 2025-2030

Chart on Casual gaming - Market size and forecast 2025-2030 ($ million)
Data Table on Casual gaming - Market size and forecast 2025-2030 ($ million)
Chart on Casual gaming - Year-over-year growth 2025-2030 (%)
Data Table on Casual gaming - Year-over-year growth 2025-2030 (%)

8.4 Professional gaming - Market size and forecast 2025-2030

Chart on Professional gaming - Market size and forecast 2025-2030 ($ million)
Data Table on Professional gaming - Market size and forecast 2025-2030 ($ million)
Chart on Professional gaming - Year-over-year growth 2025-2030 (%)
Data Table on Professional gaming - Year-over-year growth 2025-2030 (%)

8.5 Market opportunity by Type

Market opportunity by Type ($ million)
Data Table on Market opportunity by Type ($ million)

9. Market Segmentation by Platform

9.1 Market segments

Chart on Platform - Market share 2025-2030 (%)
Data Table on Platform - Market share 2025-2030 (%)

9.2 Comparison by Platform

Chart on Comparison by Platform
Data Table on Comparison by Platform

9.3 Online - Market size and forecast 2025-2030

Chart on Online - Market size and forecast 2025-2030 ($ million)
Data Table on Online - Market size and forecast 2025-2030 ($ million)
Chart on Online - Year-over-year growth 2025-2030 (%)
Data Table on Online - Year-over-year growth 2025-2030 (%)

9.4 Offline - Market size and forecast 2025-2030

Chart on Offline - Market size and forecast 2025-2030 ($ million)
Data Table on Offline - Market size and forecast 2025-2030 ($ million)
Chart on Offline - Year-over-year growth 2025-2030 (%)
Data Table on Offline - Year-over-year growth 2025-2030 (%)

9.5 Market opportunity by Platform

Market opportunity by Platform ($ million)
Data Table on Market opportunity by Platform ($ million)

10. Market Segmentation by Device

10.1 Market segments

Chart on Device - Market share 2025-2030 (%)
Data Table on Device - Market share 2025-2030 (%)

10.2 Comparison by Device

Chart on Comparison by Device
Data Table on Comparison by Device

10.3 Mobile gaming - Market size and forecast 2025-2030

Chart on Mobile gaming - Market size and forecast 2025-2030 ($ million)
Data Table on Mobile gaming - Market size and forecast 2025-2030 ($ million)
Chart on Mobile gaming - Year-over-year growth 2025-2030 (%)
Data Table on Mobile gaming - Year-over-year growth 2025-2030 (%)

10.4 Console gaming - Market size and forecast 2025-2030

Chart on Console gaming - Market size and forecast 2025-2030 ($ million)
Data Table on Console gaming - Market size and forecast 2025-2030 ($ million)
Chart on Console gaming - Year-over-year growth 2025-2030 (%)
Data Table on Console gaming - Year-over-year growth 2025-2030 (%)

10.5 PC gaming - Market size and forecast 2025-2030

Chart on PC gaming - Market size and forecast 2025-2030 ($ million)
Data Table on PC gaming - Market size and forecast 2025-2030 ($ million)
Chart on PC gaming - Year-over-year growth 2025-2030 (%)
Data Table on PC gaming - Year-over-year growth 2025-2030 (%)

10.6 Market opportunity by Device

Market opportunity by Device ($ million)
Data Table on Market opportunity by Device ($ million)

11. Customer Landscape

11.1 Customer landscape overview

Analysis of price sensitivity, lifecycle, customer purchase basket, adoption rates, and purchase criteria

12. Geographic Landscape

12.1 Geographic segmentation

Chart on Market share by geography 2025-2030 (%)
Data Table on Market share by geography 2025-2030 (%)

12.2 Geographic comparison

Chart on Geographic comparison
Data Table on Geographic comparison

12.3 APAC - Market size and forecast 2025-2030

Chart on APAC - Market size and forecast 2025-2030 ($ million)
Data Table on APAC - Market size and forecast 2025-2030 ($ million)
Chart on APAC - Year-over-year growth 2025-2030 (%)
Data Table on APAC - Year-over-year growth 2025-2030 (%)
Chart on Regional Comparison - APAC
Data Table on Regional Comparison - APAC

12.3.1 China - Market size and forecast 2025-2030

Chart on China - Market size and forecast 2025-2030 ($ million)
Data Table on China - Market size and forecast 2025-2030 ($ million)
Chart on China - Year-over-year growth 2025-2030 (%)
Data Table on China - Year-over-year growth 2025-2030 (%)

12.3.2 Japan - Market size and forecast 2025-2030

Chart on Japan - Market size and forecast 2025-2030 ($ million)
Data Table on Japan - Market size and forecast 2025-2030 ($ million)
Chart on Japan - Year-over-year growth 2025-2030 (%)
Data Table on Japan - Year-over-year growth 2025-2030 (%)

12.3.3 India - Market size and forecast 2025-2030

Chart on India - Market size and forecast 2025-2030 ($ million)
Data Table on India - Market size and forecast 2025-2030 ($ million)
Chart on India - Year-over-year growth 2025-2030 (%)
Data Table on India - Year-over-year growth 2025-2030 (%)

12.3.4 South Korea - Market size and forecast 2025-2030

Chart on South Korea - Market size and forecast 2025-2030 ($ million)
Data Table on South Korea - Market size and forecast 2025-2030 ($ million)
Chart on South Korea - Year-over-year growth 2025-2030 (%)
Data Table on South Korea - Year-over-year growth 2025-2030 (%)

12.3.5 Indonesia - Market size and forecast 2025-2030

Chart on Indonesia - Market size and forecast 2025-2030 ($ million)
Data Table on Indonesia - Market size and forecast 2025-2030 ($ million)
Chart on Indonesia - Year-over-year growth 2025-2030 (%)
Data Table on Indonesia - Year-over-year growth 2025-2030 (%)

12.3.6 Australia - Market size and forecast 2025-2030

Chart on Australia - Market size and forecast 2025-2030 ($ million)
Data Table on Australia - Market size and forecast 2025-2030 ($ million)
Chart on Australia - Year-over-year growth 2025-2030 (%)
Data Table on Australia - Year-over-year growth 2025-2030 (%)

12.4 North America - Market size and forecast 2025-2030

Chart on North America - Market size and forecast 2025-2030 ($ million)
Data Table on North America - Market size and forecast 2025-2030 ($ million)
Chart on North America - Year-over-year growth 2025-2030 (%)
Data Table on North America - Year-over-year growth 2025-2030 (%)
Chart on Regional Comparison - North America
Data Table on Regional Comparison - North America

12.4.1 US - Market size and forecast 2025-2030

Chart on US - Market size and forecast 2025-2030 ($ million)
Data Table on US - Market size and forecast 2025-2030 ($ million)
Chart on US - Year-over-year growth 2025-2030 (%)
Data Table on US - Year-over-year growth 2025-2030 (%)

12.4.2 Canada - Market size and forecast 2025-2030

Chart on Canada - Market size and forecast 2025-2030 ($ million)
Data Table on Canada - Market size and forecast 2025-2030 ($ million)
Chart on Canada - Year-over-year growth 2025-2030 (%)
Data Table on Canada - Year-over-year growth 2025-2030 (%)

12.4.3 Mexico - Market size and forecast 2025-2030

Chart on Mexico - Market size and forecast 2025-2030 ($ million)
Data Table on Mexico - Market size and forecast 2025-2030 ($ million)
Chart on Mexico - Year-over-year growth 2025-2030 (%)
Data Table on Mexico - Year-over-year growth 2025-2030 (%)

12.5 Europe - Market size and forecast 2025-2030

Chart on Europe - Market size and forecast 2025-2030 ($ million)
Data Table on Europe - Market size and forecast 2025-2030 ($ million)
Chart on Europe - Year-over-year growth 2025-2030 (%)
Data Table on Europe - Year-over-year growth 2025-2030 (%)
Chart on Regional Comparison - Europe
Data Table on Regional Comparison - Europe

12.5.1 Germany - Market size and forecast 2025-2030

Chart on Germany - Market size and forecast 2025-2030 ($ million)
Data Table on Germany - Market size and forecast 2025-2030 ($ million)
Chart on Germany - Year-over-year growth 2025-2030 (%)
Data Table on Germany - Year-over-year growth 2025-2030 (%)

12.5.2 UK - Market size and forecast 2025-2030

Chart on UK - Market size and forecast 2025-2030 ($ million)
Data Table on UK - Market size and forecast 2025-2030 ($ million)
Chart on UK - Year-over-year growth 2025-2030 (%)
Data Table on UK - Year-over-year growth 2025-2030 (%)

12.5.3 France - Market size and forecast 2025-2030

Chart on France - Market size and forecast 2025-2030 ($ million)
Data Table on France - Market size and forecast 2025-2030 ($ million)
Chart on France - Year-over-year growth 2025-2030 (%)
Data Table on France - Year-over-year growth 2025-2030 (%)

12.5.4 Italy - Market size and forecast 2025-2030

Chart on Italy - Market size and forecast 2025-2030 ($ million)
Data Table on Italy - Market size and forecast 2025-2030 ($ million)
Chart on Italy - Year-over-year growth 2025-2030 (%)
Data Table on Italy - Year-over-year growth 2025-2030 (%)

12.5.5 Spain - Market size and forecast 2025-2030

Chart on Spain - Market size and forecast 2025-2030 ($ million)
Data Table on Spain - Market size and forecast 2025-2030 ($ million)
Chart on Spain - Year-over-year growth 2025-2030 (%)
Data Table on Spain - Year-over-year growth 2025-2030 (%)

12.5.6 The Netherlands - Market size and forecast 2025-2030

Chart on The Netherlands - Market size and forecast 2025-2030 ($ million)
Data Table on The Netherlands - Market size and forecast 2025-2030 ($ million)
Chart on The Netherlands - Year-over-year growth 2025-2030 (%)
Data Table on The Netherlands - Year-over-year growth 2025-2030 (%)

12.6 Middle East and Africa - Market size and forecast 2025-2030

Chart on Middle East and Africa - Market size and forecast 2025-2030 ($ million)
Data Table on Middle East and Africa - Market size and forecast 2025-2030 ($ million)
Chart on Middle East and Africa - Year-over-year growth 2025-2030 (%)
Data Table on Middle East and Africa - Year-over-year growth 2025-2030 (%)
Chart on Regional Comparison - Middle East and Africa
Data Table on Regional Comparison - Middle East and Africa

12.6.1 Saudi Arabia - Market size and forecast 2025-2030

Chart on Saudi Arabia - Market size and forecast 2025-2030 ($ million)
Data Table on Saudi Arabia - Market size and forecast 2025-2030 ($ million)
Chart on Saudi Arabia - Year-over-year growth 2025-2030 (%)
Data Table on Saudi Arabia - Year-over-year growth 2025-2030 (%)

12.6.2 UAE - Market size and forecast 2025-2030

Chart on UAE - Market size and forecast 2025-2030 ($ million)
Data Table on UAE - Market size and forecast 2025-2030 ($ million)
Chart on UAE - Year-over-year growth 2025-2030 (%)
Data Table on UAE - Year-over-year growth 2025-2030 (%)

12.6.3 South Africa - Market size and forecast 2025-2030

Chart on South Africa - Market size and forecast 2025-2030 ($ million)
Data Table on South Africa - Market size and forecast 2025-2030 ($ million)
Chart on South Africa - Year-over-year growth 2025-2030 (%)
Data Table on South Africa - Year-over-year growth 2025-2030 (%)

12.6.4 Turkey - Market size and forecast 2025-2030

Chart on Turkey - Market size and forecast 2025-2030 ($ million)
Data Table on Turkey - Market size and forecast 2025-2030 ($ million)
Chart on Turkey - Year-over-year growth 2025-2030 (%)
Data Table on Turkey - Year-over-year growth 2025-2030 (%)

12.6.5 Israel - Market size and forecast 2025-2030

Chart on Israel - Market size and forecast 2025-2030 ($ million)
Data Table on Israel - Market size and forecast 2025-2030 ($ million)
Chart on Israel - Year-over-year growth 2025-2030 (%)
Data Table on Israel - Year-over-year growth 2025-2030 (%)

12.7 South America - Market size and forecast 2025-2030

Chart on South America - Market size and forecast 2025-2030 ($ million)
Data Table on South America - Market size and forecast 2025-2030 ($ million)
Chart on South America - Year-over-year growth 2025-2030 (%)
Data Table on South America - Year-over-year growth 2025-2030 (%)
Chart on Regional Comparison - South America
Data Table on Regional Comparison - South America

12.7.1 Brazil - Market size and forecast 2025-2030

Chart on Brazil - Market size and forecast 2025-2030 ($ million)
Data Table on Brazil - Market size and forecast 2025-2030 ($ million)
Chart on Brazil - Year-over-year growth 2025-2030 (%)
Data Table on Brazil - Year-over-year growth 2025-2030 (%)

12.7.2 Argentina - Market size and forecast 2025-2030

Chart on Argentina - Market size and forecast 2025-2030 ($ million)
Data Table on Argentina - Market size and forecast 2025-2030 ($ million)
Chart on Argentina - Year-over-year growth 2025-2030 (%)
Data Table on Argentina - Year-over-year growth 2025-2030 (%)

12.7.3 Chile - Market size and forecast 2025-2030

Chart on Chile - Market size and forecast 2025-2030 ($ million)
Data Table on Chile - Market size and forecast 2025-2030 ($ million)
Chart on Chile - Year-over-year growth 2025-2030 (%)
Data Table on Chile - Year-over-year growth 2025-2030 (%)

12.8 Market opportunity by geography

Market opportunity by geography ($ million)
Data Tables on Market opportunity by geography ($ million)

13. Drivers, Challenges, and Opportunity

13.1 Market drivers

Institutionalization of platform agnostic cloud gaming infrastructure
Expansion of artificial intelligence and creator economies
Escalation of strategic consolidation and global capital investment

13.2 Market challenges

Fragmented regulatory frameworks and tightening compliance mandates
Escalating production costs and operational margin compression
Saturating player attention and evolving monetization fatigue

13.3 Impact of drivers and challenges

Impact of drivers and challenges in 2025 and 2030

13.4 Market opportunities

Industrialization of generative AI narrative frameworks
Advancements in cloud-native cross-platform interoperability platforms
Evolution of immersive spatial computing experiences

14. Competitive Landscape

14.1 Overview

14.2

Overview on criticality of inputs and factors of differentiation

14.3 Landscape disruption

Overview on factors of disruption

14.4 Industry risks

Impact of key risks on business

15. Competitive Analysis

15.1 Companies profiled

Companies covered

15.2 Company ranking index

15.3 Market positioning of companies

Matrix on companies position and classification

15.4 Apple Inc.

Apple Inc. - Overview
Apple Inc. - Business segments
Apple Inc. - Key news
Apple Inc. - Key offerings
Apple Inc. - Segment focus
SWOT

15.5 DeNA Co. Ltd.

DeNA Co. Ltd. - Overview
DeNA Co. Ltd. - Business segments
DeNA Co. Ltd. - Key offerings
DeNA Co. Ltd. - Segment focus
SWOT

15.6 Electronic Arts Inc.

Electronic Arts Inc. - Overview
Electronic Arts Inc. - Product / Service
Electronic Arts Inc. - Key offerings
SWOT

15.7 Epic Games Inc.

Epic Games Inc. - Overview
Epic Games Inc. - Product / Service
Epic Games Inc. - Key offerings
SWOT

15.8 GungHo Online Entertainment Inc

GungHo Online Entertainment Inc - Overview
GungHo Online Entertainment Inc - Product / Service
GungHo Online Entertainment Inc - Key offerings
SWOT

15.9 NetEase Inc.

NetEase Inc. - Overview
NetEase Inc. - Product / Service
NetEase Inc. - Key offerings
SWOT

15.10 Netmarble Corp.

Netmarble Corp. - Overview
Netmarble Corp. - Product / Service
Netmarble Corp. - Key offerings
SWOT

15.11 Niantic Inc.

Niantic Inc. - Overview
Niantic Inc. - Product / Service
Niantic Inc. - Key offerings
SWOT

15.12 Rovio Entertainment Corp.

Rovio Entertainment Corp. - Overview
Rovio Entertainment Corp. - Business segments
Rovio Entertainment Corp. - Key offerings
Rovio Entertainment Corp. - Segment focus
SWOT

15.13 Sony Group Corp.

Sony Group Corp. - Overview
Sony Group Corp. - Business segments
Sony Group Corp. - Key news
Sony Group Corp. - Key offerings
Sony Group Corp. - Segment focus
SWOT

15.14 Square Enix Limited

Square Enix Limited - Overview
Square Enix Limited - Product / Service
Square Enix Limited - Key offerings
SWOT

15.15 Tencent Holdings Ltd.

Tencent Holdings Ltd. - Overview
Tencent Holdings Ltd. - Business segments
Tencent Holdings Ltd. - Key offerings
Tencent Holdings Ltd. - Segment focus
SWOT

15.16 The Walt Disney Co.

The Walt Disney Co. - Overview
The Walt Disney Co. - Business segments
The Walt Disney Co. - Key offerings
The Walt Disney Co. - Segment focus
SWOT

15.17 Ubisoft Entertainment SA

Ubisoft Entertainment SA - Overview
Ubisoft Entertainment SA - Business segments
Ubisoft Entertainment SA - Key offerings
Ubisoft Entertainment SA - Segment focus
SWOT

15.18 Zeptolab UK Ltd.

Zeptolab UK Ltd. - Overview
Zeptolab UK Ltd. - Product / Service
Zeptolab UK Ltd. - Key offerings
SWOT

16. Appendix

16.1 Scope of the report

Market definition
Objectives
Notes and caveats

16.2 Inclusions and exclusions checklist

Inclusions checklist
Exclusions checklist

16.3 Currency conversion rates for US$

16.4 Research methodology

16.5 Data procurement

Information sources

16.6 Data validation

16.7 Validation techniques employed for market sizing

16.8 Data synthesis

16.9 360 degree market analysis

16.10 List of abbreviations

Research Methodology

Technavio presents a detailed picture of the market by way of study, synthesis, and summation of data from multiple sources. The analysts have presented the various facets of the market with a particular focus on identifying the key industry influencers. The data thus presented is comprehensive, reliable, and the result of extensive research, both primary and secondary.

INFORMATION SOURCES

Primary sources

  • Manufacturers and suppliers
  • Channel partners
  • Industry experts
  • Strategic decision makers

Secondary sources

  • Industry journals and periodicals
  • Government data
  • Financial reports of key industry players
  • Historical data
  • Press releases

DATA ANALYSIS

Data Synthesis

  • Collation of data
  • Estimation of key figures
  • Analysis of derived insights

Data Validation

  • Triangulation with data models
  • Reference against proprietary databases
  • Corroboration with industry experts

REPORT WRITING

Qualitative

  • Market drivers
  • Market challenges
  • Market trends
  • Five forces analysis

Quantitative

  • Market size and forecast
  • Market segmentation
  • Geographical insights
  • Competitive landscape

Interested in this report?

Get your sample now to see our research methodology and insights!

Download Now

Frequently Asked Questions

Gaming market growth will increase by USD 117602.9 million during 2026-2030.

The Gaming market is expected to grow at a CAGR of 9% during 2026-2030.

Gaming market is segmented by Type (Casual gaming, Professional gaming) Platform (Online, Offline) Device (Mobile gaming, Console gaming, PC gaming)

Activision Blizzard Inc., Apple Inc., BANDAI NAMCO Europe S.A.S, Bowlero Corp., Chicago Gaming Co., DeNA Co. Ltd., Electronic Arts Inc., Epic Games Inc., GungHo Online Entertainment Inc, NetEase Inc., Netmarble Corp., Niantic Inc., Nintendo Co. Ltd., Rovio Entertainment Corp., Sony Group Corp., Square Enix Limited, Tencent Holdings Ltd., The Walt Disney Co., Ubisoft Entertainment SA, Zeptolab UK Ltd. are a few of the key vendors in the Gaming market.

APAC will register the highest growth rate of 52.7% among the other regions. Therefore, the Gaming market in APAC is expected to garner significant business opportunities for the vendors during the forecast period.

China, Japan, India, South Korea, Indonesia, Australia, US, Canada, Mexico, Germany, UK, France, Italy, Spain, The Netherlands, Saudi Arabia, UAE, South Africa, Turkey, Israel, Brazil, Argentina, Chile

  • Institutionalization of platform agnostic cloud gaming infrastructure is the driving factor this market.

The Gaming market vendors should focus on grabbing business opportunities from the Type segment as it accounted for the largest market share in the base year.
RIA - Research AI Assistant
Ask RIA