Mobile Gaming Market Analysis, Size, and Forecast 2026-2030: APAC (China, Japan, and India), North America (US, Canada, and Mexico), Europe (Germany, UK, and France), Middle East and Africa (Saudi Arabia, South Africa, and UAE), South America (Brazil and Argentina), and Rest of World (ROW)

Mobile Gaming Market Analysis, Size, and Forecast 2026-2030:
APAC (China, Japan, and India), North America (US, Canada, and Mexico), Europe (Germany, UK, and France), Middle East and Africa (Saudi Arabia, South Africa, and UAE), South America (Brazil and Argentina), and Rest of World (ROW)

Published: Apr 2026 289 Pages SKU: IRTNTR40192

Market Overview at a Glance

$101.47 B
Market Opportunity
12.4%
CAGR 2025 - 2030
54.9%
APAC Growth
$61.18 B
Online segment 2024

Mobile Gaming Market Size 2026-2030

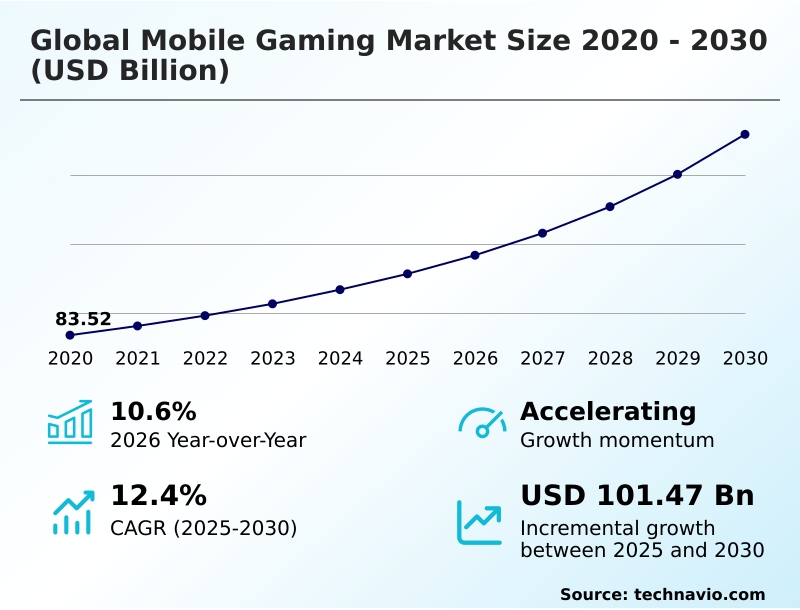
The mobile gaming market size is valued to increase by USD 101.47 billion, at a CAGR of 12.4% from 2025 to 2030. Institutionalization of high-fidelity cloud streaming and hyper-connectivity will drive the mobile gaming market.

Major Market Trends & Insights

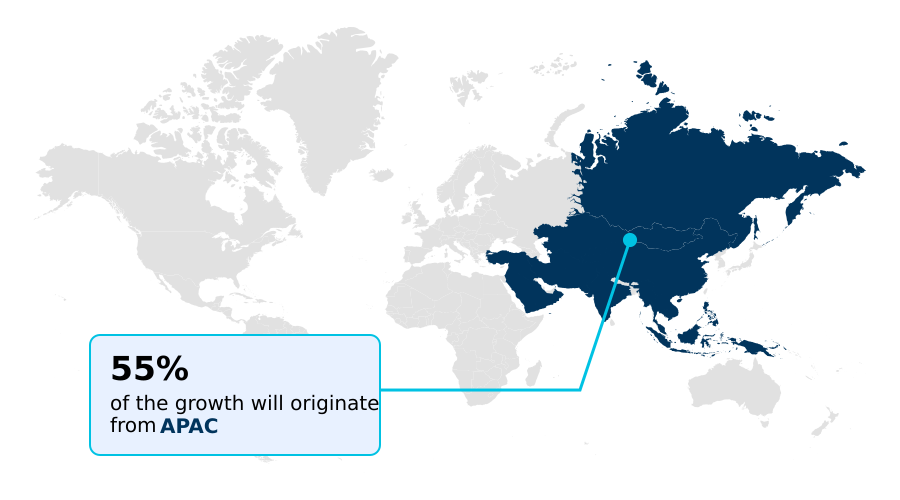
  • APAC dominated the market and accounted for a 54.9% growth during the forecast period.
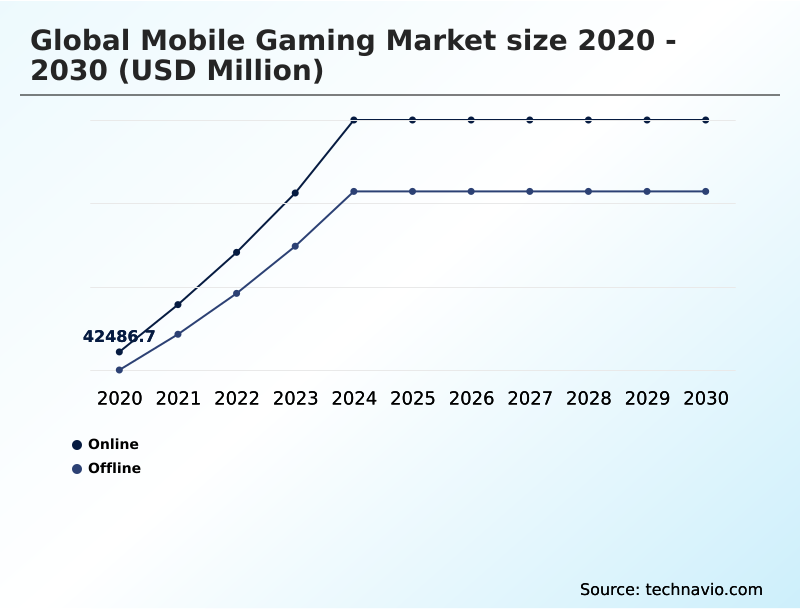
  • By Platform - Online segment was valued at USD 61.18 billion in 2024
  • By Type - Casual gaming segment accounted for the largest market revenue share in 2024

Market Size & Forecast

  • Market Opportunities: USD 146.07 billion
  • Market Future Opportunities: USD 101.47 billion
  • CAGR from 2025 to 2030 : 12.4%

Market Summary

  • The mobile gaming market is undergoing a sophisticated evolution, moving beyond simple diversions to become a primary ecosystem for immersive entertainment. This growth is underpinned by the adoption of high-performance mobile processors and 5G, enabling high-fidelity cloud streaming and complex real-time multiplayer performance. Developers utilize cloud-native architectures and agentic artificial intelligence for live-ops optimization, reducing overhead while enhancing user retention.
  • A key business scenario sees studios implementing cross-platform interoperability and automated content pipelines, allowing users to transition seamlessly. This shift toward hardware-agnostic gaming is powered by cloud-native game development, redefining the experience. As a result, business models are shifting toward hybrid-casual monetization and direct-to-consumer monetization to maximize player retention and lifetime value.
  • The focus on social ecosystem integration, data-driven personalization, and engaging single-player narratives ensures long-term player investment, solidifying mobile gaming as a cornerstone of digital entertainment.

What will be the Size of the Mobile Gaming Market during the forecast period?

Get Key Insights on Market Forecast (PDF) Request Free Sample

How is the Mobile Gaming Market Segmented?

The mobile gaming industry research report provides comprehensive data (region-wise segment analysis), with forecasts and estimates in "USD million" for the period 2026-2030, as well as historical data from 2020-2024 for the following segments.

  • Platform
    • Online
    • Offline
  • Type
    • Casual gaming
    • Professional gaming
  • End-user
    • Casual gamers
    • Mid-core gamers
    • Hardcore gamers
    • Others
  • Geography
    • APAC
      • China
      • Japan
      • India
    • North America
      • US
      • Canada
      • Mexico
    • Europe
      • Germany
      • UK
      • France
    • Middle East and Africa
      • Saudi Arabia
      • South Africa
      • UAE
    • South America
      • Brazil
      • Argentina
    • Rest of World (ROW)

By Platform Insights

The online segment is estimated to witness significant growth during the forecast period.

The online segment represents the technological vanguard of the industry, characterized by persistent connectivity and real-time social interaction. This platform leverages powerful cloud-native architectures for high-fidelity cloud streaming and live-ops optimization, delivering console-quality titles to mobile devices.

Developers are implementing cross-platform interoperability and agentic artificial intelligence to create vast digital entertainment ecosystems. The adoption of generative AI narrative frameworks results in dynamic, player-responsive ecosystems that move beyond static scripts.

The re-launch of a major title following a platform dispute led to approximately 7.5 million downloads in a single month, underscoring the consumer appetite for this interconnected social experience, which fosters high-LTV genres and supports the use of procedural generation tools for continuous content delivery.

Request Free Sample

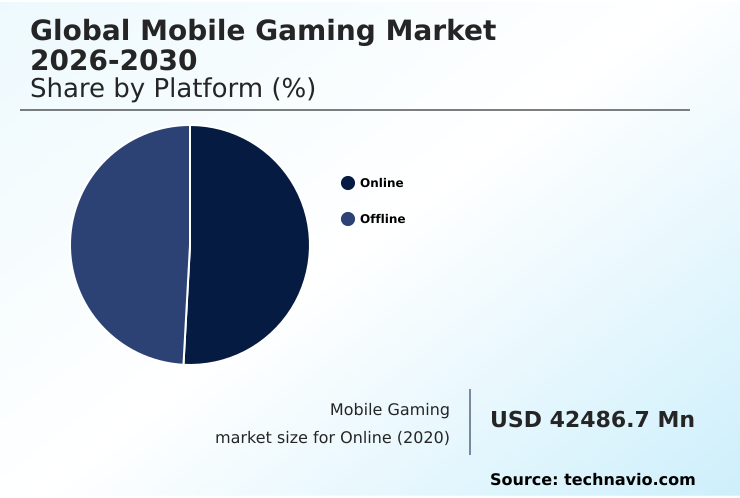
The Online segment was valued at USD 61.18 billion in 2024 and showed a gradual increase during the forecast period.

Request Free Sample

Regional Analysis

APAC is estimated to contribute 54.9% to the growth of the global market during the forecast period.Technavio’s analysts have elaborately explained the regional trends and drivers that shape the market during the forecast period.

See How Mobile Gaming Market Demand is Rising in APAC Request Free Sample

The geographic landscape is characterized by high-growth emerging markets and mature, high-value regions. APAC accounts for over 54% of the market’s incremental growth, driven by a mobile-first consumer psychology.

In contrast, regulatory maturation in regions like South America is evident; a recent tax framework adjustment in Brazil increased federal revenue from the sector by 23%.

This global diversity requires developers to use sophisticated game development engines and digital distribution platforms. Key considerations include implementing digital safety measures, addressing screen time management, and providing transparent loot box disclosures.

The focus is on creating sustainable in-game economies within the freemium monetization model, supported by robust anti-cheat systems and compelling single-player narratives, to drive both cognitive stimulation and long-term engagement across multiplayer online battle arenas and real-time strategy games.

Market Dynamics

Our researchers analyzed the data with 2025 as the base year, along with the key drivers, trends, and challenges. A holistic analysis of drivers will help companies refine their marketing strategies to gain a competitive advantage.

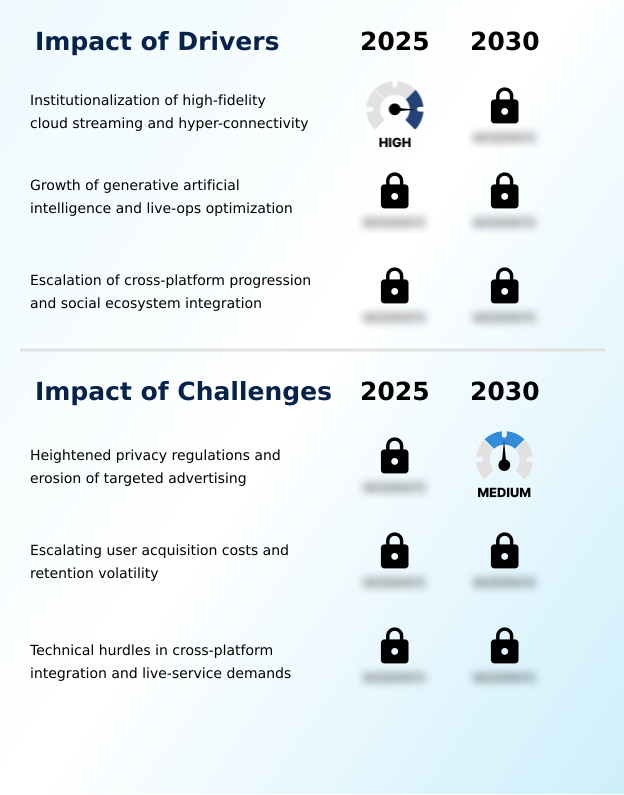
  • Strategic decision-making in the mobile gaming sector is increasingly complex, shaped by technological and regulatory shifts. A core consideration is the cross-platform progression for Global Mobile Gaming Market 2026-2030, which has become a standard user expectation, forcing a unified development approach.
  • Simultaneously, the role of generative AI in Global Mobile Gaming Market 2026-2030 asset creation is transitioning from a novelty to a necessity, promising to reduce production timelines and operational costs significantly. The cloud streaming impact on Global Mobile Gaming Market 2026-2030 hardware requirements is another critical factor, decoupling premium experiences from on-device processing power and broadening the potential audience.
  • To manage these new ecosystems, effective live-ops management strategies in Global Mobile Gaming Market 2026-2030 are paramount for maintaining player engagement and driving long-term revenue. This is particularly vital in a market where over 95% of users typically abandon new titles within thirty days, highlighting the razor-thin margins for error in player retention.
  • Furthermore, exploring direct-to-consumer monetization models for Global Mobile Gaming Market 2026-2030 allows publishers to build direct relationships with their most valuable players, bypassing traditional storefront commissions and gaining deeper insights into player behavior.

What are the key market drivers leading to the rise in the adoption of Mobile Gaming Industry?

  • A key driver for the market is the institutionalization of high-fidelity cloud streaming and hyper-connectivity, enabling premium gaming experiences on mobile devices.

  • The institutionalization of high-fidelity cloud streaming and hyper-connectivity is a primary market driver. This is enabled by cloud-native game development and a move toward a hardware-agnostic future. The proliferation of automated content pipelines and social ecosystem integration enhances user engagement.
  • The use of advanced neural networks for user modeling achieved a 20% reduction in churn rates, demonstrating the power of algorithmic precision.
  • Furthermore, the focus on high-LTV genres has seen in-app purchase revenue increase by 20% in the strategy segment alone. These developments, supported by mobile-first cloud access and the implementation of cross-save and cross-play functionalities, create a stickier environment.
  • The deployment of server-side ray tracing and interactive ad formats further pushes the boundaries of hardware-agnostic gaming, supporting community-driven content and digital wallets.

What are the market trends shaping the Mobile Gaming Industry?

  • The mobile gaming market is witnessing the industrialization of AI narrative frameworks. This trend transitions mobile environments from static scripts to dynamic, player-responsive ecosystems.

  • A structural shift is underway toward the industrialization of generative AI and direct-to-consumer monetization strategies. Studios are moving to player-responsive ecosystems using on-device neural processing for data-driven personalization. This focus on player retention and lifetime value is critical. The adoption of cloud-enabled architectures has already reduced latency for cross-platform infrastructure by nearly 30%, enabling high-quality real-time multiplayer performance.
  • The use of user acquisition and retention modeling is also key, with advanced neural networks achieving a 20% reduction in churn rates. This trend is optimizing hybrid-casual monetization and creating digital third places within low-latency network environments, catering to a mobile-first consumer psychology and supporting the expansion of esports infrastructure through dynamic difficulty curves and targeted in-app purchase recommendations.

What challenges does the Mobile Gaming Industry face during its growth?

  • A primary challenge affecting industry growth is the combination of heightened privacy regulations and the subsequent erosion of targeted advertising capabilities.

  • The market faces structural challenges from escalating user acquisition costs and privacy-related advertising erosion. Publishers are forced to increase spending by over 20% just to maintain active users, a response to rapid player churn where over 95% of users abandon new titles within 30 days.
  • This landscape is complicated by the variety of mobile operating systems and the performance demands on high-performance mobile processors. The reliance on digital storefronts and their commission structures puts pressure on in-game monetization strategies. To counter this, some are exploring user-generated content platforms and real-time narrative adjustments.
  • However, the capital required to build out proprietary cloud-based gaming services remains high, challenging the viability of premium ad-free versions and data-efficient casual games without sophisticated advanced analytics software and mobile payment systems.

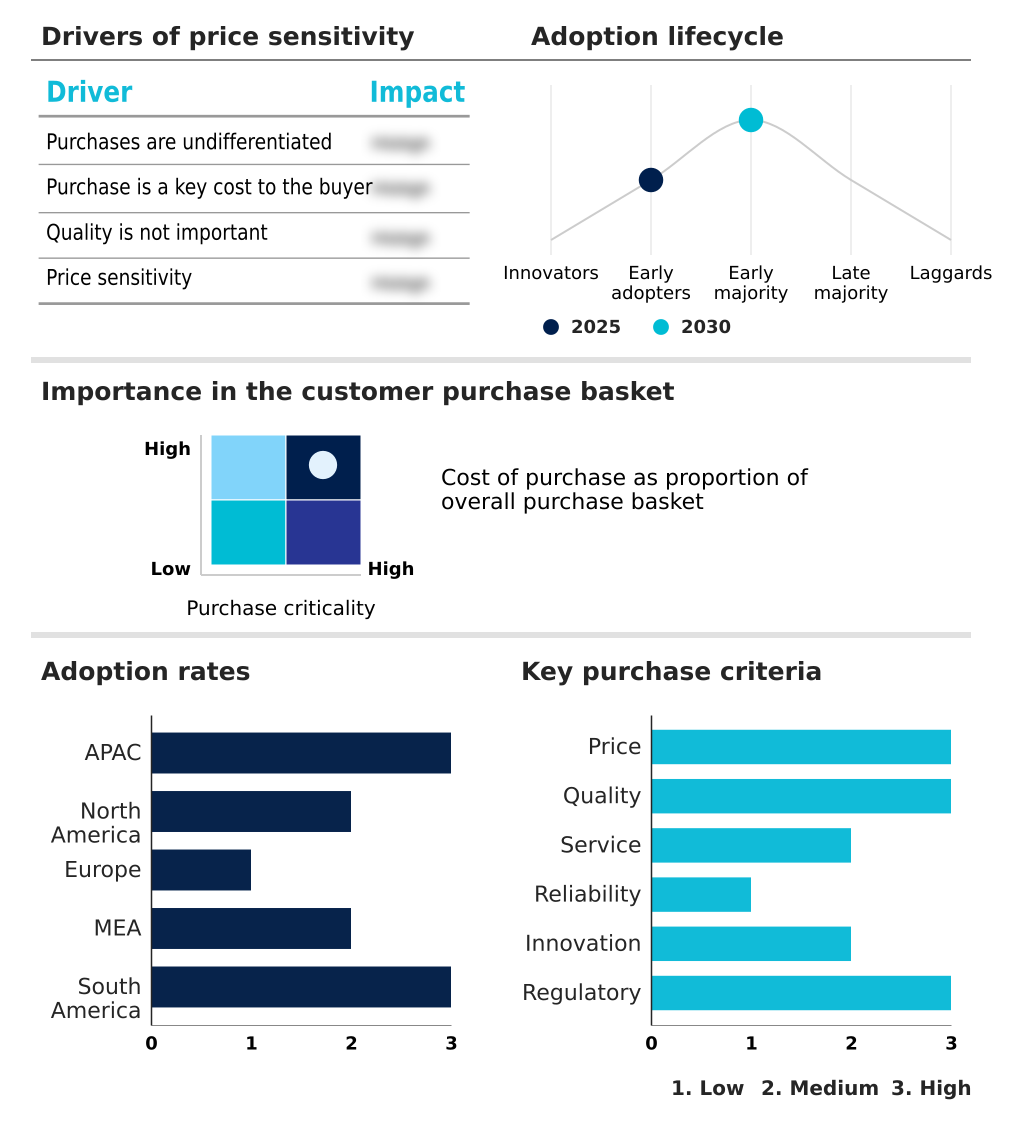
Exclusive Technavio Analysis on Customer Landscape

The mobile gaming market forecasting report includes the adoption lifecycle of the market, covering from the innovator’s stage to the laggard’s stage. It focuses on adoption rates in different regions based on penetration. Furthermore, the mobile gaming market report also includes key purchase criteria and drivers of price sensitivity to help companies evaluate and develop their market growth analysis strategies.

Customer Landscape of Mobile Gaming Industry

Competitive Landscape

Companies are implementing various strategies, such as strategic alliances, mobile gaming market forecast, partnerships, mergers and acquisitions, geographical expansion, and product/service launches, to enhance their presence in the industry.

BANDAI NAMCO Europe S.A.S - Vendors provide a diverse portfolio, from casual puzzles to complex multiplayer experiences, leveraging mobile operating systems for broad distribution and engagement.

The industry research and growth report includes detailed analyses of the competitive landscape of the market and information about key companies, including:

  • BANDAI NAMCO Europe S.A.S
  • Electronic Arts Inc.
  • Epic Games Inc.
  • King Digital Entertainment plc
  • Konami Group Corp.
  • Miniclip SA
  • Moon Active Ltd.
  • NetEase Inc.
  • Netmarble Corp.
  • NEXON Co. Ltd.
  • Niantic Inc.
  • Outfit7 Ltd.
  • Playtika Holding Corp.
  • Roblox Corp.
  • Rovio Entertainment Corp.
  • Scopely Inc.
  • Supercell Oy
  • Tencent Holdings Ltd.
  • Voodoo SAS
  • Zynga Inc.

Qualitative and quantitative analysis of companies has been conducted to help clients understand the wider business environment as well as the strengths and weaknesses of key industry players. Data is qualitatively analyzed to categorize companies as pure play, category-focused, industry-focused, and diversified; it is quantitatively analyzed to categorize companies as dominant, leading, strong, tentative, and weak.

Recent Development and News in Mobile gaming market

  • In April 2025, Roblox Corp. initiated a significant technological update by launching agentic artificial intelligence tools, including a novel Planning Mode and procedural mesh generation, which allow creators to transform single text prompts into editable, structured game development roadmaps.
  • In April 2025, NetEase Inc. advanced its global reach by launching the competitive racing title Racing Master in Europe and North America, following a period of intensive regional localization and testing.
  • In February 2025, Scopely Inc. solidified its position as a primary consolidator in the mobile sector by acquiring a majority stake in the Istanbul-based developer of a breakout puzzle title, in a transaction valuing the studio in excess of a billion dollars.
  • In August 2024, Samsung Electronics initiated a comprehensive beta rollout of its mobile cloud gaming platform across the United Kingdom and Germany, allowing its device users to stream technically demanding titles without extensive local processing power.

Dive into Technavio’s robust research methodology, blending expert interviews, extensive data synthesis, and validated models for unparalleled Mobile Gaming Market insights. See full methodology.

Market Scope
Page number 289
Base year 2025
Historic period 2020-2024
Forecast period 2026-2030
Growth momentum & CAGR Accelerate at a CAGR of 12.4%
Market growth 2026-2030 USD 101469.1 million
Market structure Fragmented
YoY growth 2025-2026(%) 10.6%
Key countries China, Japan, India, South Korea, Indonesia, Australia, US, Canada, Mexico, Germany, UK, France, Italy, Spain, The Netherlands, Saudi Arabia, South Africa, UAE, Turkey, Israel, Brazil, Argentina and Chile
Competitive landscape Leading Companies, Market Positioning of Companies, Competitive Strategies, and Industry Risks

Request Free Sample

Research Analyst Overview

  • The mobile gaming market is characterized by a strategic fusion of advanced technologies. Cloud-native architectures and high-fidelity cloud streaming are enabling hardware-agnostic gaming, supported by the increasing power of high-performance mobile processors and diverse mobile operating systems. At the core of development, procedural generation tools and automated content pipelines are powered by agentic artificial intelligence and sophisticated cloud-native game development.
  • This allows for generative AI narrative frameworks and real-time narrative adjustments, creating dynamic experiences. Monetization is evolving through direct-to-consumer monetization, hybrid-casual monetization, and complex in-game economies managed within a freemium monetization model. For live titles, live-ops optimization, robust anti-cheat systems, and constant data-driven personalization are key.
  • Studios are leveraging user acquisition and retention modeling with algorithmic precision to combat high costs, especially as some face margin compression from increasing ad spend by over 20%. The focus is on seamless cross-platform interoperability, including cross-save and cross-play functionalities, within a unified social ecosystem integration. This necessitates low-latency network environments for real-time multiplayer performance.
  • On the user end, features like on-device neural processing, server-side ray tracing, and engaging single-player narratives enhance the experience, while digital safety, screen time management, and cognitive stimulation become important considerations alongside the core gameplay offered via digital storefronts and cloud-based gaming services.

What are the Key Data Covered in this Mobile Gaming Market Research and Growth Report?

  • What is the expected growth of the Mobile Gaming Market between 2026 and 2030?

    • USD 101.47 billion, at a CAGR of 12.4%

  • What segmentation does the market report cover?

    • The report is segmented by Platform (Online, and Offline), Type (Casual gaming, and Professional gaming), End-user (Casual gamers, Mid-core gamers, Hardcore gamers, and Others) and Geography (APAC, North America, Europe, Middle East and Africa, South America)

  • Which regions are analyzed in the report?

    • APAC, North America, Europe, Middle East and Africa and South America

  • What are the key growth drivers and market challenges?

    • Institutionalization of high-fidelity cloud streaming and hyper-connectivity, Heightened privacy regulations and erosion of targeted advertising

  • Who are the major players in the Mobile Gaming Market?

    • BANDAI NAMCO Europe S.A.S, Electronic Arts Inc., Epic Games Inc., King Digital Entertainment plc, Konami Group Corp., Miniclip SA, Moon Active Ltd., NetEase Inc., Netmarble Corp., NEXON Co. Ltd., Niantic Inc., Outfit7 Ltd., Playtika Holding Corp., Roblox Corp., Rovio Entertainment Corp., Scopely Inc., Supercell Oy, Tencent Holdings Ltd., Voodoo SAS and Zynga Inc.

Market Research Insights

  • The market's dynamics are shaped by a strategic pivot from aggressive user acquisition to intensive monetization of existing player bases. This is evident in the rise of console-quality titles and high-LTV genres that leverage sophisticated live service operations.
  • The effectiveness of this approach is quantifiable; studios using advanced analytics software for hyper-personalized content have achieved a 20% reduction in churn rates. Furthermore, the adoption of cloud-enabled architectures has reduced infrastructure latency by nearly 30%, which is crucial for the esports infrastructure.
  • This focus on player retention and lifetime value, supported by the integration of digital wallets and transparent loot box disclosures within interconnected social experiences, is transforming the digital entertainment ecosystem. The shift supports a mobile-first consumer psychology, where players expect deep, persistent engagement.

We can help! Our analysts can customize this mobile gaming market research report to meet your requirements.

Get in touch

1. Executive Summary

1.1 Market overview

Executive Summary - Chart on Market Overview
Executive Summary - Data Table on Market Overview
Executive Summary - Chart on Global Market Characteristics
Executive Summary - Chart on Market by Geography
Executive Summary - Chart on Market Segmentation by Platform
Executive Summary - Chart on Market Segmentation by Type
Executive Summary - Chart on Market Segmentation by End-user
Executive Summary - Chart on Incremental Growth
Executive Summary - Data Table on Incremental Growth
Executive Summary - Chart on Company Market Positioning

2. Technavio Analysis

2.1 Analysis of price sensitivity, lifecycle, customer purchase basket, adoption rates, and purchase criteria

2.2 Criticality of inputs and Factors of differentiation

Chart on Overview on criticality of inputs and factors of differentiation

2.3 Factors of disruption

Chart on Overview on factors of disruption

2.4 Impact of drivers and challenges

Chart on Impact of drivers and challenges in 2025 and 2030

3. Market Landscape

3.1 Market ecosystem

Chart on Parent Market
Data Table on - Parent Market

3.2 Market characteristics

Chart on Market characteristics analysis

3.3 Value chain analysis

Chart on Value chain analysis

4. Market Sizing

4.1 Market definition

Data Table on Offerings of companies included in the market definition

4.2 Market segment analysis

Market segments

4.3 Market size 2025

4.4 Market outlook: Forecast for 2025-2030

Chart on Global - Market size and forecast 2025-2030 ($ million)
Data Table on Global - Market size and forecast 2025-2030 ($ million)
Chart on Global Market: Year-over-year growth 2025-2030 (%)
Data Table on Global Market: Year-over-year growth 2025-2030 (%)

5. Historic Market Size

5.1 Global Mobile Gaming Market 2020 - 2024

Historic Market Size - Data Table on Global Mobile Gaming Market 2020 - 2024 ($ million)

5.2 Platform segment analysis 2020 - 2024

Historic Market Size - Platform Segment 2020 - 2024 ($ million)

5.3 Type segment analysis 2020 - 2024

Historic Market Size - Type Segment 2020 - 2024 ($ million)

5.4 End-user segment analysis 2020 - 2024

Historic Market Size - End-user Segment 2020 - 2024 ($ million)

5.5 Geography segment analysis 2020 - 2024

Historic Market Size - Geography Segment 2020 - 2024 ($ million)

5.6 Country segment analysis 2020 - 2024

Historic Market Size - Country Segment 2020 - 2024 ($ million)

6. Qualitative Analysis

6.1 Impact of AI in global mobile gaming market

6.2 Impact of geopolitical conflict on global mobile gaming market

7. Five Forces Analysis

7.1 Five forces summary

Five forces analysis - Comparison between 2025 and 2030

7.2 Bargaining power of buyers

Bargaining power of buyers - Impact of key factors 2025 and 2030

7.3 Bargaining power of suppliers

Bargaining power of suppliers - Impact of key factors in 2025 and 2030

7.4 Threat of new entrants

Threat of new entrants - Impact of key factors in 2025 and 2030

7.5 Threat of substitutes

Threat of substitutes - Impact of key factors in 2025 and 2030

7.6 Threat of rivalry

Threat of rivalry - Impact of key factors in 2025 and 2030

7.7 Market condition

Chart on Market condition - Five forces 2025 and 2030

8. Market Segmentation by Platform

8.1 Market segments

Chart on Platform - Market share 2025-2030 (%)
Data Table on Platform - Market share 2025-2030 (%)

8.2 Comparison by Platform

Chart on Comparison by Platform
Data Table on Comparison by Platform

8.3 Online - Market size and forecast 2025-2030

Chart on Online - Market size and forecast 2025-2030 ($ million)
Data Table on Online - Market size and forecast 2025-2030 ($ million)
Chart on Online - Year-over-year growth 2025-2030 (%)
Data Table on Online - Year-over-year growth 2025-2030 (%)

8.4 Offline - Market size and forecast 2025-2030

Chart on Offline - Market size and forecast 2025-2030 ($ million)
Data Table on Offline - Market size and forecast 2025-2030 ($ million)
Chart on Offline - Year-over-year growth 2025-2030 (%)
Data Table on Offline - Year-over-year growth 2025-2030 (%)

8.5 Market opportunity by Platform

Market opportunity by Platform ($ million)
Data Table on Market opportunity by Platform ($ million)

9. Market Segmentation by Type

9.1 Market segments

Chart on Type - Market share 2025-2030 (%)
Data Table on Type - Market share 2025-2030 (%)

9.2 Comparison by Type

Chart on Comparison by Type
Data Table on Comparison by Type

9.3 Casual gaming - Market size and forecast 2025-2030

Chart on Casual gaming - Market size and forecast 2025-2030 ($ million)
Data Table on Casual gaming - Market size and forecast 2025-2030 ($ million)
Chart on Casual gaming - Year-over-year growth 2025-2030 (%)
Data Table on Casual gaming - Year-over-year growth 2025-2030 (%)

9.4 Professional gaming - Market size and forecast 2025-2030

Chart on Professional gaming - Market size and forecast 2025-2030 ($ million)
Data Table on Professional gaming - Market size and forecast 2025-2030 ($ million)
Chart on Professional gaming - Year-over-year growth 2025-2030 (%)
Data Table on Professional gaming - Year-over-year growth 2025-2030 (%)

9.5 Market opportunity by Type

Market opportunity by Type ($ million)
Data Table on Market opportunity by Type ($ million)

10. Market Segmentation by End-user

10.1 Market segments

Chart on End-user - Market share 2025-2030 (%)
Data Table on End-user - Market share 2025-2030 (%)

10.2 Comparison by End-user

Chart on Comparison by End-user
Data Table on Comparison by End-user

10.3 Casual gamers - Market size and forecast 2025-2030

Chart on Casual gamers - Market size and forecast 2025-2030 ($ million)
Data Table on Casual gamers - Market size and forecast 2025-2030 ($ million)
Chart on Casual gamers - Year-over-year growth 2025-2030 (%)
Data Table on Casual gamers - Year-over-year growth 2025-2030 (%)

10.4 Mid-core gamers - Market size and forecast 2025-2030

Chart on Mid-core gamers - Market size and forecast 2025-2030 ($ million)
Data Table on Mid-core gamers - Market size and forecast 2025-2030 ($ million)
Chart on Mid-core gamers - Year-over-year growth 2025-2030 (%)
Data Table on Mid-core gamers - Year-over-year growth 2025-2030 (%)

10.5 Hardcore gamers - Market size and forecast 2025-2030

Chart on Hardcore gamers - Market size and forecast 2025-2030 ($ million)
Data Table on Hardcore gamers - Market size and forecast 2025-2030 ($ million)
Chart on Hardcore gamers - Year-over-year growth 2025-2030 (%)
Data Table on Hardcore gamers - Year-over-year growth 2025-2030 (%)

10.6 Others - Market size and forecast 2025-2030

Chart on Others - Market size and forecast 2025-2030 ($ million)
Data Table on Others - Market size and forecast 2025-2030 ($ million)
Chart on Others - Year-over-year growth 2025-2030 (%)
Data Table on Others - Year-over-year growth 2025-2030 (%)

10.7 Market opportunity by End-user

Market opportunity by End-user ($ million)
Data Table on Market opportunity by End-user ($ million)

11. Customer Landscape

11.1 Customer landscape overview

Analysis of price sensitivity, lifecycle, customer purchase basket, adoption rates, and purchase criteria

12. Geographic Landscape

12.1 Geographic segmentation

Chart on Market share by geography 2025-2030 (%)
Data Table on Market share by geography 2025-2030 (%)

12.2 Geographic comparison

Chart on Geographic comparison
Data Table on Geographic comparison

12.3 APAC - Market size and forecast 2025-2030

Chart on APAC - Market size and forecast 2025-2030 ($ million)
Data Table on APAC - Market size and forecast 2025-2030 ($ million)
Chart on APAC - Year-over-year growth 2025-2030 (%)
Data Table on APAC - Year-over-year growth 2025-2030 (%)
Chart on Regional Comparison - APAC
Data Table on Regional Comparison - APAC

12.3.1 China - Market size and forecast 2025-2030

Chart on China - Market size and forecast 2025-2030 ($ million)
Data Table on China - Market size and forecast 2025-2030 ($ million)
Chart on China - Year-over-year growth 2025-2030 (%)
Data Table on China - Year-over-year growth 2025-2030 (%)

12.3.2 Japan - Market size and forecast 2025-2030

Chart on Japan - Market size and forecast 2025-2030 ($ million)
Data Table on Japan - Market size and forecast 2025-2030 ($ million)
Chart on Japan - Year-over-year growth 2025-2030 (%)
Data Table on Japan - Year-over-year growth 2025-2030 (%)

12.3.3 India - Market size and forecast 2025-2030

Chart on India - Market size and forecast 2025-2030 ($ million)
Data Table on India - Market size and forecast 2025-2030 ($ million)
Chart on India - Year-over-year growth 2025-2030 (%)
Data Table on India - Year-over-year growth 2025-2030 (%)

12.3.4 South Korea - Market size and forecast 2025-2030

Chart on South Korea - Market size and forecast 2025-2030 ($ million)
Data Table on South Korea - Market size and forecast 2025-2030 ($ million)
Chart on South Korea - Year-over-year growth 2025-2030 (%)
Data Table on South Korea - Year-over-year growth 2025-2030 (%)

12.3.5 Indonesia - Market size and forecast 2025-2030

Chart on Indonesia - Market size and forecast 2025-2030 ($ million)
Data Table on Indonesia - Market size and forecast 2025-2030 ($ million)
Chart on Indonesia - Year-over-year growth 2025-2030 (%)
Data Table on Indonesia - Year-over-year growth 2025-2030 (%)

12.3.6 Australia - Market size and forecast 2025-2030

Chart on Australia - Market size and forecast 2025-2030 ($ million)
Data Table on Australia - Market size and forecast 2025-2030 ($ million)
Chart on Australia - Year-over-year growth 2025-2030 (%)
Data Table on Australia - Year-over-year growth 2025-2030 (%)

12.4 North America - Market size and forecast 2025-2030

Chart on North America - Market size and forecast 2025-2030 ($ million)
Data Table on North America - Market size and forecast 2025-2030 ($ million)
Chart on North America - Year-over-year growth 2025-2030 (%)
Data Table on North America - Year-over-year growth 2025-2030 (%)
Chart on Regional Comparison - North America
Data Table on Regional Comparison - North America

12.4.1 US - Market size and forecast 2025-2030

Chart on US - Market size and forecast 2025-2030 ($ million)
Data Table on US - Market size and forecast 2025-2030 ($ million)
Chart on US - Year-over-year growth 2025-2030 (%)
Data Table on US - Year-over-year growth 2025-2030 (%)

12.4.2 Canada - Market size and forecast 2025-2030

Chart on Canada - Market size and forecast 2025-2030 ($ million)
Data Table on Canada - Market size and forecast 2025-2030 ($ million)
Chart on Canada - Year-over-year growth 2025-2030 (%)
Data Table on Canada - Year-over-year growth 2025-2030 (%)

12.4.3 Mexico - Market size and forecast 2025-2030

Chart on Mexico - Market size and forecast 2025-2030 ($ million)
Data Table on Mexico - Market size and forecast 2025-2030 ($ million)
Chart on Mexico - Year-over-year growth 2025-2030 (%)
Data Table on Mexico - Year-over-year growth 2025-2030 (%)

12.5 Europe - Market size and forecast 2025-2030

Chart on Europe - Market size and forecast 2025-2030 ($ million)
Data Table on Europe - Market size and forecast 2025-2030 ($ million)
Chart on Europe - Year-over-year growth 2025-2030 (%)
Data Table on Europe - Year-over-year growth 2025-2030 (%)
Chart on Regional Comparison - Europe
Data Table on Regional Comparison - Europe

12.5.1 Germany - Market size and forecast 2025-2030

Chart on Germany - Market size and forecast 2025-2030 ($ million)
Data Table on Germany - Market size and forecast 2025-2030 ($ million)
Chart on Germany - Year-over-year growth 2025-2030 (%)
Data Table on Germany - Year-over-year growth 2025-2030 (%)

12.5.2 UK - Market size and forecast 2025-2030

Chart on UK - Market size and forecast 2025-2030 ($ million)
Data Table on UK - Market size and forecast 2025-2030 ($ million)
Chart on UK - Year-over-year growth 2025-2030 (%)
Data Table on UK - Year-over-year growth 2025-2030 (%)

12.5.3 France - Market size and forecast 2025-2030

Chart on France - Market size and forecast 2025-2030 ($ million)
Data Table on France - Market size and forecast 2025-2030 ($ million)
Chart on France - Year-over-year growth 2025-2030 (%)
Data Table on France - Year-over-year growth 2025-2030 (%)

12.5.4 Italy - Market size and forecast 2025-2030

Chart on Italy - Market size and forecast 2025-2030 ($ million)
Data Table on Italy - Market size and forecast 2025-2030 ($ million)
Chart on Italy - Year-over-year growth 2025-2030 (%)
Data Table on Italy - Year-over-year growth 2025-2030 (%)

12.5.5 Spain - Market size and forecast 2025-2030

Chart on Spain - Market size and forecast 2025-2030 ($ million)
Data Table on Spain - Market size and forecast 2025-2030 ($ million)
Chart on Spain - Year-over-year growth 2025-2030 (%)
Data Table on Spain - Year-over-year growth 2025-2030 (%)

12.5.6 The Netherlands - Market size and forecast 2025-2030

Chart on The Netherlands - Market size and forecast 2025-2030 ($ million)
Data Table on The Netherlands - Market size and forecast 2025-2030 ($ million)
Chart on The Netherlands - Year-over-year growth 2025-2030 (%)
Data Table on The Netherlands - Year-over-year growth 2025-2030 (%)

12.6 Middle East and Africa - Market size and forecast 2025-2030

Chart on Middle East and Africa - Market size and forecast 2025-2030 ($ million)
Data Table on Middle East and Africa - Market size and forecast 2025-2030 ($ million)
Chart on Middle East and Africa - Year-over-year growth 2025-2030 (%)
Data Table on Middle East and Africa - Year-over-year growth 2025-2030 (%)
Chart on Regional Comparison - Middle East and Africa
Data Table on Regional Comparison - Middle East and Africa

12.6.1 Saudi Arabia - Market size and forecast 2025-2030

Chart on Saudi Arabia - Market size and forecast 2025-2030 ($ million)
Data Table on Saudi Arabia - Market size and forecast 2025-2030 ($ million)
Chart on Saudi Arabia - Year-over-year growth 2025-2030 (%)
Data Table on Saudi Arabia - Year-over-year growth 2025-2030 (%)

12.6.2 South Africa - Market size and forecast 2025-2030

Chart on South Africa - Market size and forecast 2025-2030 ($ million)
Data Table on South Africa - Market size and forecast 2025-2030 ($ million)
Chart on South Africa - Year-over-year growth 2025-2030 (%)
Data Table on South Africa - Year-over-year growth 2025-2030 (%)

12.6.3 UAE - Market size and forecast 2025-2030

Chart on UAE - Market size and forecast 2025-2030 ($ million)
Data Table on UAE - Market size and forecast 2025-2030 ($ million)
Chart on UAE - Year-over-year growth 2025-2030 (%)
Data Table on UAE - Year-over-year growth 2025-2030 (%)

12.6.4 Turkey - Market size and forecast 2025-2030

Chart on Turkey - Market size and forecast 2025-2030 ($ million)
Data Table on Turkey - Market size and forecast 2025-2030 ($ million)
Chart on Turkey - Year-over-year growth 2025-2030 (%)
Data Table on Turkey - Year-over-year growth 2025-2030 (%)

12.6.5 Israel - Market size and forecast 2025-2030

Chart on Israel - Market size and forecast 2025-2030 ($ million)
Data Table on Israel - Market size and forecast 2025-2030 ($ million)
Chart on Israel - Year-over-year growth 2025-2030 (%)
Data Table on Israel - Year-over-year growth 2025-2030 (%)

12.7 South America - Market size and forecast 2025-2030

Chart on South America - Market size and forecast 2025-2030 ($ million)
Data Table on South America - Market size and forecast 2025-2030 ($ million)
Chart on South America - Year-over-year growth 2025-2030 (%)
Data Table on South America - Year-over-year growth 2025-2030 (%)
Chart on Regional Comparison - South America
Data Table on Regional Comparison - South America

12.7.1 Brazil - Market size and forecast 2025-2030

Chart on Brazil - Market size and forecast 2025-2030 ($ million)
Data Table on Brazil - Market size and forecast 2025-2030 ($ million)
Chart on Brazil - Year-over-year growth 2025-2030 (%)
Data Table on Brazil - Year-over-year growth 2025-2030 (%)

12.7.2 Argentina - Market size and forecast 2025-2030

Chart on Argentina - Market size and forecast 2025-2030 ($ million)
Data Table on Argentina - Market size and forecast 2025-2030 ($ million)
Chart on Argentina - Year-over-year growth 2025-2030 (%)
Data Table on Argentina - Year-over-year growth 2025-2030 (%)

12.7.3 Chile - Market size and forecast 2025-2030

Chart on Chile - Market size and forecast 2025-2030 ($ million)
Data Table on Chile - Market size and forecast 2025-2030 ($ million)
Chart on Chile - Year-over-year growth 2025-2030 (%)
Data Table on Chile - Year-over-year growth 2025-2030 (%)

12.8 Market opportunity by geography

Market opportunity by geography ($ million)
Data Tables on Market opportunity by geography ($ million)

13. Drivers, Challenges, and Opportunity

13.1 Market drivers

Institutionalization of high-fidelity cloud streaming and hyper-connectivity
Growth of generative artificial intelligence and live-ops optimization
Escalation of cross-platform progression and social ecosystem integration

13.2 Market challenges

Heightened privacy regulations and erosion of targeted advertising
Escalating user acquisition costs and retention volatility
Technical hurdles in cross-platform integration and live-service demands

13.3 Impact of drivers and challenges

Impact of drivers and challenges in 2025 and 2030

13.4 Market opportunities

Industrialization of AI narrative frameworks of mobile transition
Increase in cloud native cross platform interoperability
Rise of direct-to-consumer monetization

14. Competitive Landscape

14.1 Overview

14.2

Overview on criticality of inputs and factors of differentiation

14.3 Landscape disruption

Overview on factors of disruption

14.4 Industry risks

Impact of key risks on business

15. Competitive Analysis

15.1 Companies profiled

Companies covered

15.2 Company ranking index

15.3 Market positioning of companies

Matrix on companies position and classification

15.4 BANDAI NAMCO Europe S.A.S

BANDAI NAMCO Europe S.A.S - Overview
BANDAI NAMCO Europe S.A.S - Product / Service
BANDAI NAMCO Europe S.A.S - Key offerings
SWOT

15.5 Electronic Arts Inc.

Electronic Arts Inc. - Overview
Electronic Arts Inc. - Product / Service
Electronic Arts Inc. - Key offerings
SWOT

15.6 Epic Games Inc.

Epic Games Inc. - Overview
Epic Games Inc. - Product / Service
Epic Games Inc. - Key offerings
SWOT

15.7 King Digital Entertainment plc

King Digital Entertainment plc - Overview
King Digital Entertainment plc - Product / Service
King Digital Entertainment plc - Key offerings
SWOT

15.8 Konami Group Corp.

Konami Group Corp. - Overview
Konami Group Corp. - Business segments
Konami Group Corp. - Key offerings
Konami Group Corp. - Segment focus
SWOT

15.9 Miniclip SA

Miniclip SA - Overview
Miniclip SA - Product / Service
Miniclip SA - Key offerings
SWOT

15.10 NetEase Inc.

NetEase Inc. - Overview
NetEase Inc. - Product / Service
NetEase Inc. - Key offerings
SWOT

15.11 Netmarble Corp.

Netmarble Corp. - Overview
Netmarble Corp. - Product / Service
Netmarble Corp. - Key offerings
SWOT

15.12 NEXON Co. Ltd.

NEXON Co. Ltd. - Overview
NEXON Co. Ltd. - Product / Service
NEXON Co. Ltd. - Key offerings
SWOT

15.13 Playtika Holding Corp.

Playtika Holding Corp. - Overview
Playtika Holding Corp. - Product / Service
Playtika Holding Corp. - Key offerings
SWOT

15.14 Roblox Corp.

Roblox Corp. - Overview
Roblox Corp. - Product / Service
Roblox Corp. - Key offerings
SWOT

15.15 Rovio Entertainment Corp.

Rovio Entertainment Corp. - Overview
Rovio Entertainment Corp. - Business segments
Rovio Entertainment Corp. - Key offerings
Rovio Entertainment Corp. - Segment focus
SWOT

15.16 Tencent Holdings Ltd.

Tencent Holdings Ltd. - Overview
Tencent Holdings Ltd. - Business segments
Tencent Holdings Ltd. - Key offerings
Tencent Holdings Ltd. - Segment focus
SWOT

15.17 Voodoo SAS

Voodoo SAS - Overview
Voodoo SAS - Product / Service
Voodoo SAS - Key offerings
SWOT

15.18 Zynga Inc.

Zynga Inc. - Overview
Zynga Inc. - Product / Service
Zynga Inc. - Key offerings
SWOT

16. Appendix

16.1 Scope of the report

Market definition
Objectives
Notes and caveats

16.2 Inclusions and exclusions checklist

Inclusions checklist
Exclusions checklist

16.3 Currency conversion rates for US$

16.4 Research methodology

16.5 Data procurement

Information sources

16.6 Data validation

16.7 Validation techniques employed for market sizing

16.8 Data synthesis

16.9 360 degree market analysis

16.10 List of abbreviations

Research Methodology

Technavio presents a detailed picture of the market by way of study, synthesis, and summation of data from multiple sources. The analysts have presented the various facets of the market with a particular focus on identifying the key industry influencers. The data thus presented is comprehensive, reliable, and the result of extensive research, both primary and secondary.

INFORMATION SOURCES

Primary sources

  • Manufacturers and suppliers
  • Channel partners
  • Industry experts
  • Strategic decision makers

Secondary sources

  • Industry journals and periodicals
  • Government data
  • Financial reports of key industry players
  • Historical data
  • Press releases

DATA ANALYSIS

Data Synthesis

  • Collation of data
  • Estimation of key figures
  • Analysis of derived insights

Data Validation

  • Triangulation with data models
  • Reference against proprietary databases
  • Corroboration with industry experts

REPORT WRITING

Qualitative

  • Market drivers
  • Market challenges
  • Market trends
  • Five forces analysis

Quantitative

  • Market size and forecast
  • Market segmentation
  • Geographical insights
  • Competitive landscape

Interested in this report?

Get your sample now to see our research methodology and insights!

Download Now

Frequently Asked Questions

Mobile Gaming market growth will increase by USD 101469.1 million during 2026-2030.

The Mobile Gaming market is expected to grow at a CAGR of 12.4% during 2026-2030.

Mobile Gaming market is segmented by Platform (Online, Offline) Type (Casual gaming, Professional gaming) End-user (Casual gamers, Mid-core gamers, Hardcore gamers, Others)

BANDAI NAMCO Europe S.A.S, Electronic Arts Inc., Epic Games Inc., King Digital Entertainment plc, Konami Group Corp., Miniclip SA, Moon Active Ltd., NetEase Inc., Netmarble Corp., NEXON Co. Ltd., Niantic Inc., Outfit7 Ltd., Playtika Holding Corp., Roblox Corp., Rovio Entertainment Corp., Scopely Inc., Supercell Oy, Tencent Holdings Ltd., Voodoo SAS, Zynga Inc. are a few of the key vendors in the Mobile Gaming market.

APAC will register the highest growth rate of 54.9% among the other regions. Therefore, the Mobile Gaming market in APAC is expected to garner significant business opportunities for the vendors during the forecast period.

China, Japan, India, South Korea, Indonesia, Australia, US, Canada, Mexico, Germany, UK, France, Italy, Spain, The Netherlands, Saudi Arabia, South Africa, UAE, Turkey, Israel, Brazil, Argentina, Chile

  • Institutionalization of high-fidelity cloud streaming and hyper-connectivity is the driving factor this market.

The Mobile Gaming market vendors should focus on grabbing business opportunities from the Platform segment as it accounted for the largest market share in the base year.
RIA - Research AI Assistant
Ask RIA