
Digital Payment Market Size 2025-2029
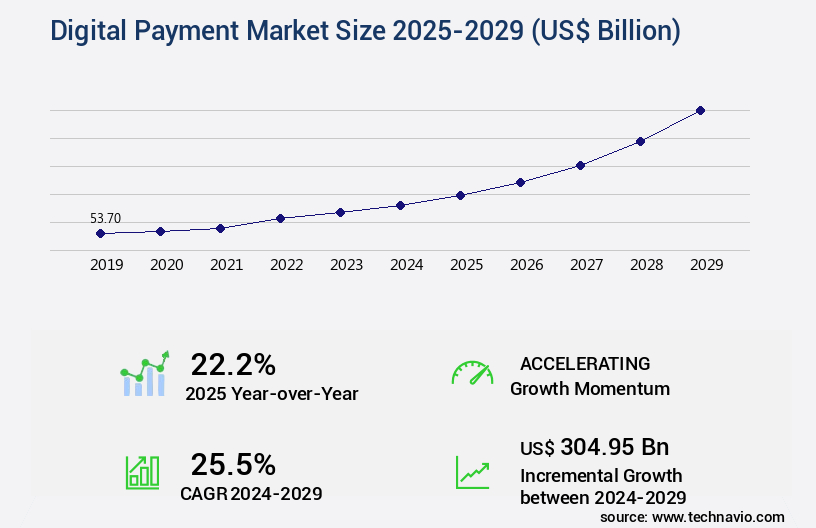
The digital payment market size is valued to increase USD 304.95 billion, at a CAGR of 25.5% from 2024 to 2029. Rising number of online transactions will drive the digital payment market.
Major Market Trends & Insights
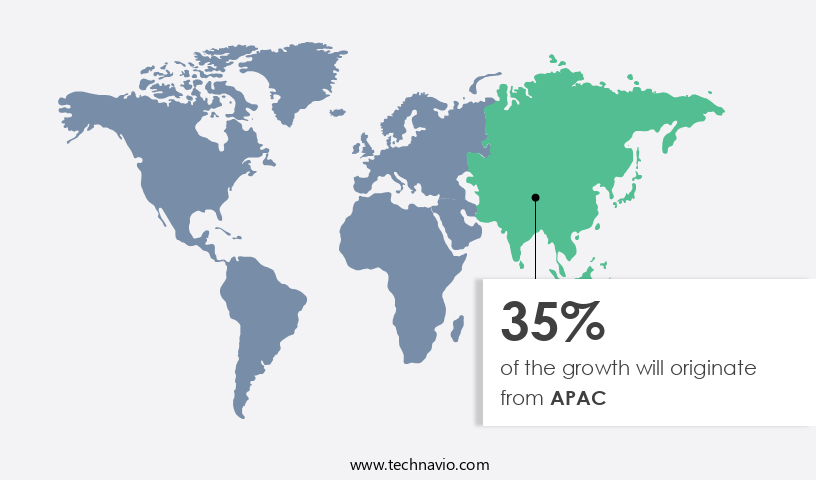
- APAC dominated the market and accounted for a 35% growth during the forecast period.
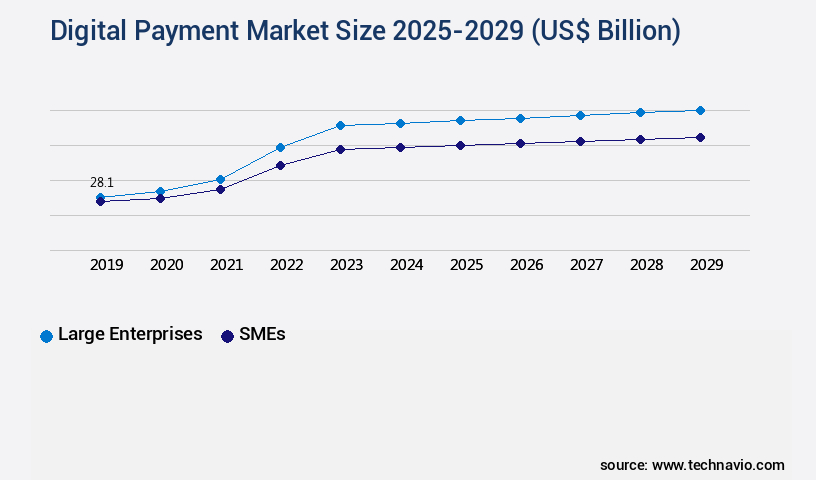
- By End-user - Large enterprises segment was valued at USD 28.10 billion in 2023
- By Component - Solutions segment accounted for the largest market revenue share in 2023
Market Size & Forecast
- Market Opportunities: USD 735.94 billion
- Market Future Opportunities: USD 304952.40 billion
- CAGR from 2024 to 2029 : 25.5%
Market Summary
- The market is a dynamic and ever-evolving landscape shaped by advancements in core technologies and applications. With the rising number of online transactions, the market is witnessing a growing emergence of mobile apps for shopping transactions, now accounting for over 50% of all e-commerce sales. However, this shift towards digital payments also brings challenges, including privacy and concerns related to security. As of 2021, contactless payments are expected to represent approximately 25% of all digital transactions, underscoring the market's continuous evolution.
- Regulations, such as the European Union's Strong Customer Authentication (SCA) and PSD2, further influence the market, ensuring secure and compliant transactions. Staying updated on these trends and regulations is crucial for businesses aiming to capitalize on the opportunities presented by the market.
What will be the Size of the Digital Payment Market during the forecast period?
Get Key Insights on Market Forecast (PDF) Request Free Sample
How is the Digital Payment Market Segmented ?
The digital payment industry research report provides comprehensive data (region-wise segment analysis), with forecasts and estimates in "USD billion" for the period 2025-2029, as well as historical data from 2019-2023 for the following segments.
- End-user
- Large enterprises
- SMEs
- Component
- Solutions
- Services
- Deployment
- On-premises
- Cloud
- Method
- Digital wallets
- Bank cards
- Digital currencies
- Application
- BFSI
- Media and entertainment
- IT and telecommunication
- Hospitality
- Healthcare
- Geography
- North America
- US
- Canada
- Europe
- France
- Germany
- UK
- APAC
- China
- India
- Japan
- South Korea
- South America
- Brazil
- Rest of World (ROW)
- North America
By End-user Insights
The large enterprises segment is estimated to witness significant growth during the forecast period.
In today's business landscape, digital payment adoption has witnessed significant growth, particularly among large enterprises in sectors such as banking, securities, finance and insurance (BSFI), information technology, and manufacturing. This trend is driven by the increasing number of transactions and the expansion of BSFI enterprises, as well as the rise of intraregional and cross-border banking activities. Contactless and card-based payments have become the norm in various industries, including modern vending machines, hotels, restaurants, grocery stores, shopping malls, and event management companies. Real-time payment systems, secure data transmission, and regulatory compliance are essential components of these digital payment solutions. Tokenization security, customer onboarding processes, and chargeback management are critical elements ensuring the success of digital payment transactions.
Data encryption methods, payment reconciliation, and payment processing fees are also essential considerations. Payment gateway integration, transaction success rates, and payment authorization protocols are key factors in providing seamless and efficient payment processing. Customer support channels, fraud prevention measures, and biometric authentication are essential for maintaining customer trust and satisfaction. Settlement cycle times, two-factor authentication, and mobile payment adoption are ongoing trends in the market. Recurring billing systems, e-commerce payment processing, and dispute resolution processes are crucial for businesses in various industries. API integration services, risk management strategies, payment gateway security, and cryptocurrency integration are essential features for digital payment providers.
Merchant acquiring services, omnichannel payment solutions, PCI DSS compliance, and financial transaction security are also crucial elements in the digital payment ecosystem. The market is expected to grow substantially, with a reported 30% of businesses worldwide adopting digital payments in 2021. Furthermore, industry experts predict that the market will reach a value of 7.5 trillion USD by 2026. These trends reflect the continuous evolution of digital payment technologies and their increasing importance in the business world.
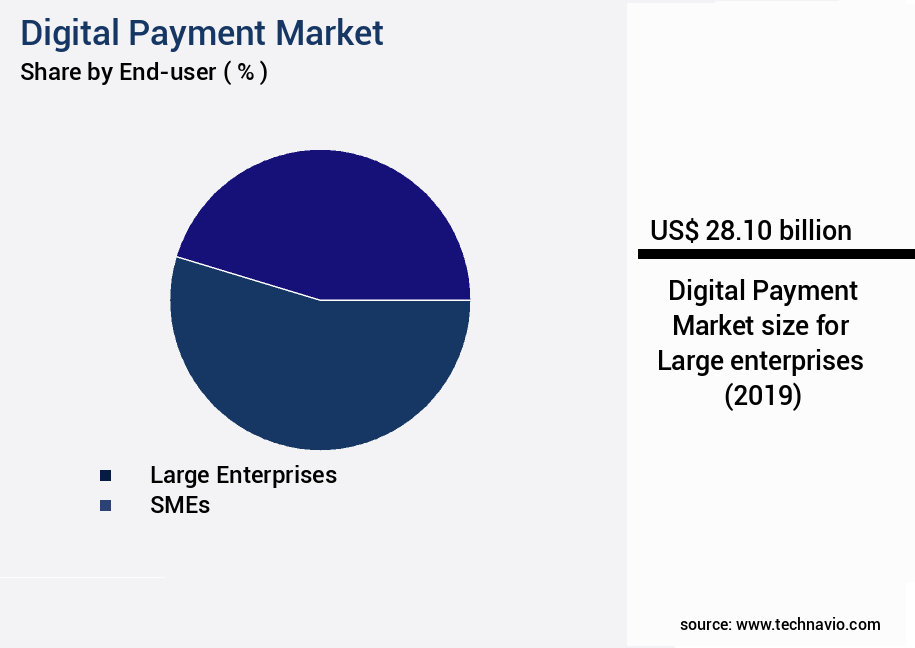
The Large enterprises segment was valued at USD 28.10 billion in 2019 and showed a gradual increase during the forecast period.
Regional Analysis
APAC is estimated to contribute 35% to the growth of the global market during the forecast period.Technavio’s analysts have elaborately explained the regional trends and drivers that shape the market during the forecast period.
See How Digital Payment Market Demand is Rising in APAC Request Free Sample
The market in APAC is experiencing significant expansion, driven by the region's rapid urbanization and increasing Internet penetration. This growth can be attributed to the widespread adoption of digital payment methods, including wallets and payment gateways. Notably, semi-closed wallets, like Airtel Money and PayU, are gaining popularity. These wallets, which are linked to bank accounts and operate through payment gateways, contribute to the market's growth.
APAC's adoption of payment gateway technology outpaces other regions. Despite varying levels of mobile penetration across countries, such as Australia, Hong Kong, and Singapore, compared to China, India, and Indonesia, the region's the market continues to thrive.
Market Dynamics
Our researchers analyzed the data with 2024 as the base year, along with the key drivers, trends, and challenges. A holistic analysis of drivers will help companies refine their marketing strategies to gain a competitive advantage.
The market is witnessing significant growth as businesses strive to implement secure payment gateways and reduce processing fees, leading to improved transaction success rates. This shift is driven by the increasing need to enhance fraud prevention measures and optimize payment gateway security. API payment services have become integral to streamlining customer onboarding processes and developing secure payment systems. Moreover, managing chargeback dispute resolution and maintaining PCI DSS compliance standards are essential aspects of digital payment systems, ensuring a seamless user experience. Effective payment reconciliation methods and enhancing transaction authorization procedures are also critical to maintaining efficiency and trust.
Boosting mobile wallet user adoption and implementing biometric authentication and two-factor authentication are key trends in the market. Contactless payment technology and leveraging real-time payment systems are gaining popularity due to their convenience and speed. Integrating cryptocurrency payment options and mitigating risks in payment processing are essential considerations for market players. According to market intelligence, adoption rates in emerging economies are nearly double those in developed regions, highlighting the significant potential for growth in these markets. This trend is expected to continue as digital payment infrastructure improves and financial inclusion initiatives gain traction. In conclusion, the market is witnessing robust growth, driven by the need for secure and efficient payment processing, fraud prevention, and customer convenience.
Market players are focusing on implementing advanced technologies and complying with regulatory requirements to cater to the evolving needs of businesses and consumers.
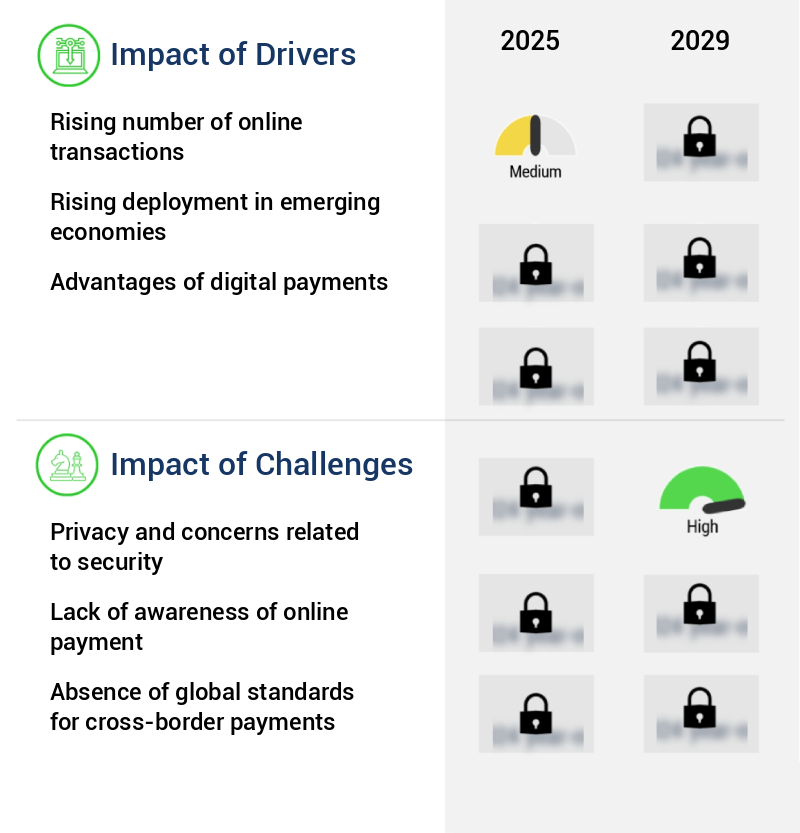
What are the key market drivers leading to the rise in the adoption of Digital Payment Industry?
- The increasing prevalence of online transactions serves as the primary catalyst for market growth.
- Online transactions have become increasingly preferred by individual consumers due to their ease, speed, and convenience compared to traditional methods. The proliferation of smartphones has enabled consumers to make transactions anytime and anywhere, leading to a surge in mobile payments. Digital wallets, with their easy registration and login processes, robust merchant and consumer payment processing capabilities, and user-friendly dashboards, have become the most popular mode of payment. The adoption of mobile devices and wearables has popularized mobile payments, with many retailers integrating platforms such as NFC POS terminals to facilitate these transactions.
- NFC POS terminals not only simplify payment processes but also enhance retailers' marketing efforts by providing valuable customer data and insights. Overall, the digital payment landscape is continuously evolving, with mobile payments leading the charge in transforming the way consumers make transactions across various sectors.
What are the market trends shaping the Digital Payment Industry?
- The growing trend in the market involves the increasing emergence of mobile applications for shopping transactions. This trend is mandatory for businesses seeking to stay competitive in the modern retail landscape.
- The mobile commerce landscape is witnessing a significant shift towards app usage, with transactions in mobile apps surpassing those on websites. This trend is driven by the expanding smart device market penetration and the increasing preference for convenience and personalized experiences. In developing countries like India, mobile payments are experiencing rapid growth as consumers and businesses embrace digital transactions, especially during the pandemic. However, transitioning to app-only services can pose challenges for e-commerce providers in countries where Internet connectivity remains an issue, such as Indonesia and Thailand.
- Globally, the adoption of app-only services varies, with some e-commerce giants successfully making the switch while others face hurdles. Companies must carefully consider the unique market dynamics and consumer behaviors to navigate this evolving landscape.
What challenges does the Digital Payment Industry face during its growth?
- The integration of privacy and security concerns is a significant challenge that can hinder industry growth. This issue necessitates the implementation of robust solutions to protect data and maintain trust with customers.
- Digital payment methods, while offering convenience and efficiency, present challenges related to privacy and security. With the sensitive nature of financial and personal information, data breaches and hacking pose significant risks to digital payment portals. This compromise of personal information negatively impacts user trust and confidence. Furthermore, third-party access is a growing concern as digital payment companies share customer data with external entities for marketing purposes. Criminals and hackers exploit this vulnerability by sending phishing emails, messages, and creating fake websites to obtain sensitive information.
- These malicious activities not only harm individual users but also impact businesses that rely on digital payment systems. As the digital payment landscape continues to evolve, addressing these privacy and security concerns is crucial to ensure growth and adoption across various sectors.
Exclusive Technavio Analysis on Customer Landscape
The digital payment market forecasting report includes the adoption lifecycle of the market, covering from the innovator’s stage to the laggard’s stage. It focuses on adoption rates in different regions based on penetration. Furthermore, the digital payment market report also includes key purchase criteria and drivers of price sensitivity to help companies evaluate and develop their market growth analysis strategies.
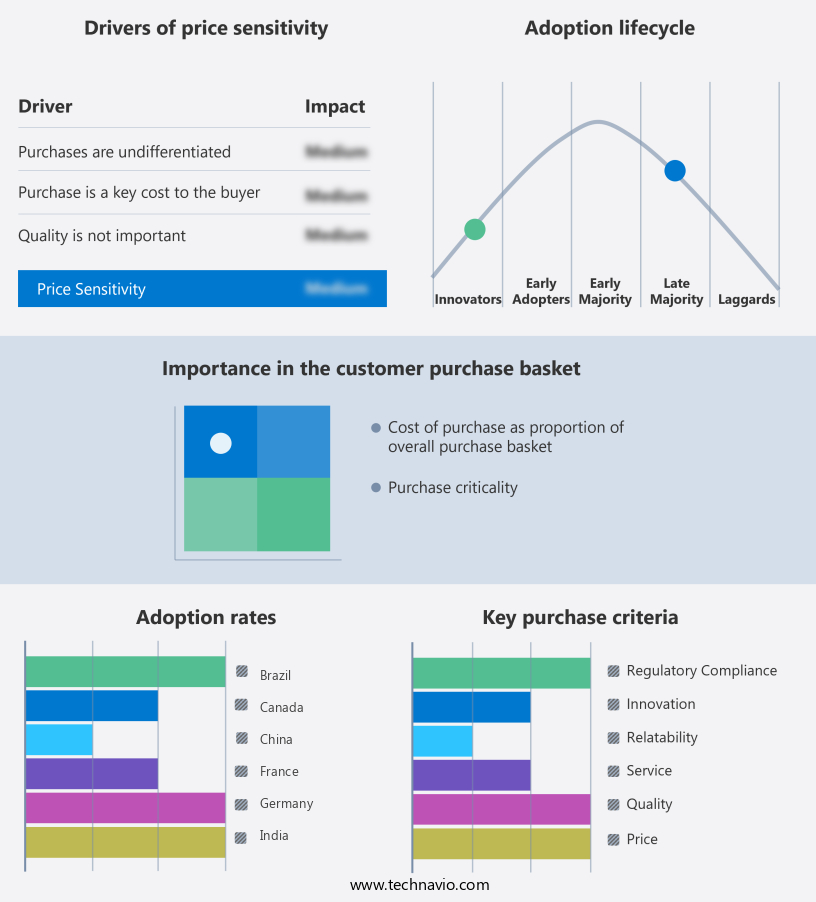
Customer Landscape of Digital Payment Industry
Competitive Landscape
Companies are implementing various strategies, such as strategic alliances, digital payment market forecast, partnerships, mergers and acquisitions, geographical expansion, and product/service launches, to enhance their presence in the industry.
ACI Worldwide Inc. - This company specializes in providing real-time digital payment overlay solutions for individual investors, enabling instant settlements. Their services facilitate seamless transactions, enhancing the investment process.
The industry research and growth report includes detailed analyses of the competitive landscape of the market and information about key companies, including:
- ACI Worldwide Inc.
- Adyen NV
- Apple Inc.
- Aurus Inc.
- Block Inc.
- Due Inc.
- Fidelity National Information Services Inc.
- Fiserv Inc.
- Global Payments Inc.
- Intuit Inc.
- JPMorgan Chase and Co.
- Mastercard Inc.
- PayPal Holdings Inc.
- Paysafe Ltd.
- PayTrace Inc.
- Stripe Inc.
- VeriFone Inc.
- Visa Inc.
- WEX Inc.
- Worldline SA
Qualitative and quantitative analysis of companies has been conducted to help clients understand the wider business environment as well as the strengths and weaknesses of key industry players. Data is qualitatively analyzed to categorize companies as pure play, category-focused, industry-focused, and diversified; it is quantitatively analyzed to categorize companies as dominant, leading, strong, tentative, and weak.
Recent Development and News in Digital Payment Market
- In January 2024, PayPal Holdings, Inc. Announced the acquisition of Honey Science Corporation, a leading digital commerce technology company, for approximately USD4 billion. This acquisition aimed to strengthen PayPal's presence in the e-commerce sector and expand its offerings beyond digital payments (PayPal Press Release, 2024).
- In March 2024, Mastercard and Alibaba Group entered into a strategic partnership to collaborate on digital payment solutions, enabling Mastercard cardholders to use their cards for transactions on Alibaba's platforms, including Alipay and Fliggy (Mastercard Newsroom, 2024).
- In May 2024, Apple Pay surpassed 3 billion transactions, marking a significant milestone in the market. This growth was attributed to the increasing adoption of contactless payments and Apple's expanding partnerships with retailers and financial institutions (Apple Investor Relations, 2024).
- In February 2025, the European Union's Revised Payment Services Directive (PSD2) came into effect, mandating open banking and enabling third-party providers to access customers' banking data with their consent, promoting innovation and competition in the market (European Commission, 2025).
Dive into Technavio’s robust research methodology, blending expert interviews, extensive data synthesis, and validated models for unparalleled Digital Payment Market insights. See full methodology.
|
Market Scope |
|
|
Report Coverage |
Details |
|
Page number |
255 |
|
Base year |
2024 |
|
Historic period |
2019-2023 |
|
Forecast period |
2025-2029 |
|
Growth momentum & CAGR |
Accelerate at a CAGR of 25.5% |
|
Market growth 2025-2029 |
USD 304.95 billion |
|
Market structure |
Fragmented |
|
YoY growth 2024-2025(%) |
22.2 |
|
Key countries |
US, Canada, China, Japan, Germany, France, Brazil, UK, South Korea, and India |
|
Competitive landscape |
Leading Companies, Market Positioning of Companies, Competitive Strategies, and Industry Risks |
Research Analyst Overview
- In the ever-evolving digital payment landscape, adoption of digital wallets continues to surge, offering convenience and security to customers. Tokenization, a critical security measure, ensures sensitive financial data is replaced with unique identifiers, enhancing transaction security. The customer onboarding process, streamlined through digital means, reduces friction and accelerates adoption. Chargeback management systems minimize financial losses from disputed transactions, while real-time payment systems enable instant transaction processing and authorization. Contactless payment technology and secure data transmission protocols further bolster the market's appeal. Regulatory compliance and fraud detection systems are integral components, ensuring adherence to industry standards and safeguarding against unauthorized activities.
- Payment reconciliation and transaction processing fees are essential factors influencing market dynamics, with integration services offering API solutions to streamline operations. Payment authorization protocols and customer support channels prioritize user experience, fostering loyalty and repeat business. Fraud prevention measures, such as biometric authentication and two-factor authentication, fortify security. Mobile payment adoption and recurring billing systems cater to the e-commerce sector, with settlement cycle times optimized for efficiency. Omnichannel payment solutions, PCI DSS compliance, and merchant acquiring services expand market reach and accessibility. Cryptocurrency integration and risk management strategies further diversify offerings, as the market continues to unfold, adapting to the evolving needs of businesses and consumers alike.
What are the Key Data Covered in this Digital Payment Market Research and Growth Report?
-
What is the expected growth of the Digital Payment Market between 2025 and 2029?
-
USD 304.95 billion, at a CAGR of 25.5%
-
-
What segmentation does the market report cover?
-
The report is segmented by End-user (Large enterprises and SMEs), Component (Solutions and Services), Deployment (On-premises and Cloud), Method (Digital wallets, Bank cards, and Digital currencies), Application (BFSI, Media and entertainment, IT and telecommunication, Hospitality, and Healthcare), and Geography (APAC, North America, Europe, South America, and Middle East and Africa)
-
-
Which regions are analyzed in the report?
-
APAC, North America, Europe, South America, and Middle East and Africa
-
-
What are the key growth drivers and market challenges?
-
Rising number of online transactions, Privacy and concerns related to security
-
-
Who are the major players in the Digital Payment Market?
-
ACI Worldwide Inc., Adyen NV, Apple Inc., Aurus Inc., Block Inc., Due Inc., Fidelity National Information Services Inc., Fiserv Inc., Global Payments Inc., Intuit Inc., JPMorgan Chase and Co., Mastercard Inc., PayPal Holdings Inc., Paysafe Ltd., PayTrace Inc., Stripe Inc., VeriFone Inc., Visa Inc., WEX Inc., and Worldline SA
-
Market Research Insights
- The market continues to evolve, with transaction processing speed and payment system scalability becoming increasingly important factors. According to internal market data, digital transactions reached 500 billion in volume last year, a 25% increase from the previous year. Payment method diversification is also a significant trend, with mobile wallet technology and cross-border payment processing gaining traction. Fraud detection algorithms and payment security protocols are essential components in ensuring a secure payment environment. Payment gateway selection and payment processing software play a crucial role in payment system integration and reliability. Transaction cost analysis and customer experience metrics are key differentiators among payment platform providers.
- Risk assessment modeling and transaction authorization are integral to maintaining payment system security. With the growing importance of online payment platforms, transaction volume analysis and transaction speed metrics are vital for optimizing payment network infrastructure. Mobile payment security and secure payment environment are essential considerations for businesses and consumers alike.
We can help! Our analysts can customize this digital payment market research report to meet your requirements.
 RIA -
RIA - 
