
UK Facility Management Market Size 2026-2030
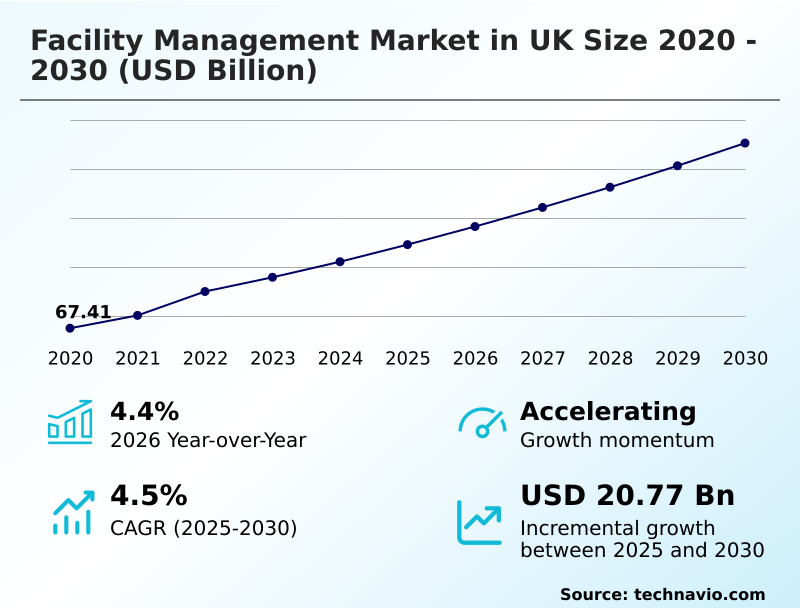
The uk facility management market size is valued to increase by USD 20.77 billion, at a CAGR of 4.5% from 2025 to 2030. Decarbonization and energy efficiency mandates will drive the uk facility management market.
Major Market Trends & Insights
- By Type - Soft facility management segment was valued at USD 54.10 billion in 2024
- By End-user - Commercial segment accounted for the largest market revenue share in 2024
Market Size & Forecast
- Market Opportunities: USD 37.87 billion
- Market Future Opportunities: USD 20.77 billion
- CAGR from 2025 to 2030 : 4.5%
Market Summary
- The facility management market in UK is undergoing a structural shift from reactive maintenance to predictive, technology-enabled service delivery. This evolution is driven by stringent decarbonization mandates and the need for greater operational resilience in complex built environments.
- Core to this transformation is the integration of smart building systems and iot platforms, which enable data-driven operational services and predictive maintenance, thereby optimizing asset lifecycle management.
- For instance, a commercial real estate portfolio manager can leverage a cloud-based fm solution to monitor energy consumption across multiple properties in real time, identifying anomalies and dispatching technical services for hvac maintenance before a failure occurs. This proactive approach not only reduces costs but also ensures compliance with evolving energy efficiency standards and esg integration requirements.
- However, the increasing sophistication of these technologies creates a significant challenge related to a shortage of skilled technicians capable of managing and maintaining these advanced systems, forcing firms to invest heavily in upskilling programs to maintain a competitive edge and deliver on client expectations for technical resilience and asset value optimization.
What will be the Size of the UK Facility Management Market during the forecast period?
Get Key Insights on Market Forecast (PDF) Request Free Sample
How is the UK Facility Management Market Segmented?
The uk facility management industry research report provides comprehensive data (region-wise segment analysis), with forecasts and estimates in "USD million" for the period 2026-2030, as well as historical data from 2020-2024 for the following segments.
- Type
- Soft facility management
- Hard facility management
- End-user
- Commercial
- Government
- Residential
- Service type
- Outsourced
- In-house
- Geography
- Europe
- UK
- Europe
By Type Insights
The soft facility management segment is estimated to witness significant growth during the forecast period.
The soft facility management segment is undergoing a significant transformation, driven by technological adoption and a focus on user experience.
As providers grapple with operational costs, with nearly 90% of cleaning professionals citing this as a primary challenge, the pivot to automation is accelerating. This includes the deployment of autonomous robotic cleaning and intelligent systems for real-time occupancy monitoring.
The integration of digital performance management platforms has become standard for ensuring transparency in cleaning and security delivery. Service models are shifting toward a consultancy-led niche, providing specialized support for emergency planning and compliance.
This evolution emphasizes data-driven decision making and client-centric services to enhance both efficiency and workplace experience optimization within the built environment.
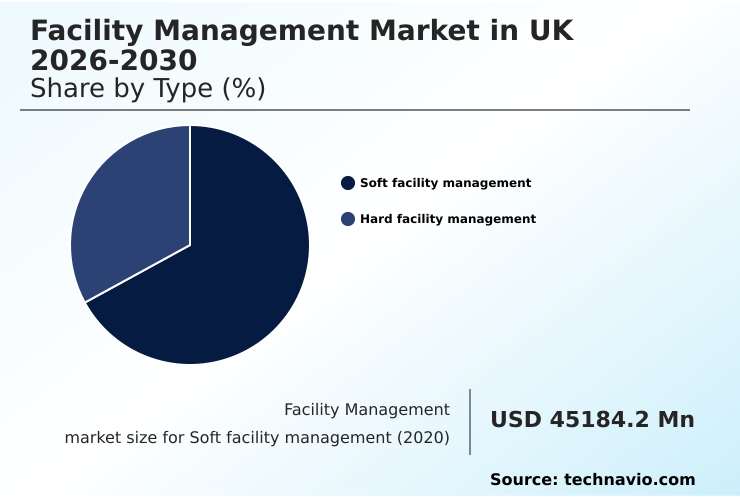
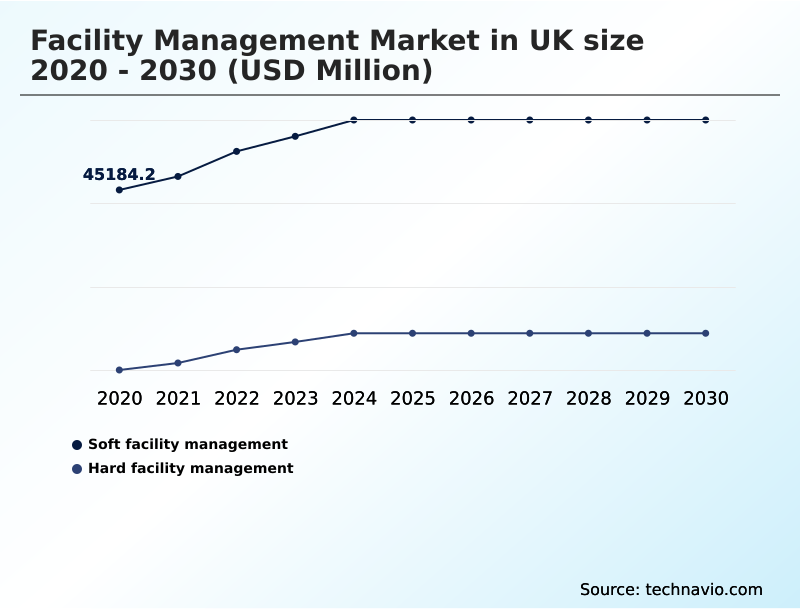
The Soft facility management segment was valued at USD 54.10 billion in 2024 and showed a gradual increase during the forecast period.
Market Dynamics
Our researchers analyzed the data with 2025 as the base year, along with the key drivers, trends, and challenges. A holistic analysis of drivers will help companies refine their marketing strategies to gain a competitive advantage.
- The facility management market is evolving beyond traditional services, with specialization becoming key to capturing value in high-growth niches. For instance, facility management services for data centers now demand expertise in hard services for hyperscale data centers, including advanced cooling systems and telemetry-enabled maintenance, to ensure maximum uptime.
- Concurrently, AI predictive maintenance for hvac systems is transitioning from a premium offering to a standard expectation in commercial contracts, with firms using digital twin technology in building management reporting up to a 30% reduction in unplanned equipment failures compared to those on fixed schedules.
- The integration of iot platforms for real-time asset monitoring is crucial for managing aging infrastructure in commercial buildings and ensuring fire safety compliance for residential properties. This data is also central to esg reporting in facility management contracts and achieving waste management and circular economy in fm goals. As companies evaluate outsourced vs.
- in-house facility management costs, the conversation now includes the building safety act impact on fm services and the need for robust supplier relationship management in fm. This complexity highlights the growing technical skill gap solutions in fm, as providers seek talent proficient in everything from robotic process automation in cleaning services to developing decarbonization strategies for the built environment.
- Cloud-based solutions for hybrid workplaces and outcome-based contracts for sustainability goals are now essential for delivering modern, resilient services, particularly in managing compliance for heritage properties and executing energy efficiency retrofitting for retail spaces or integrated soft services for public sector.
What are the key market drivers leading to the rise in the adoption of UK Facility Management Industry?
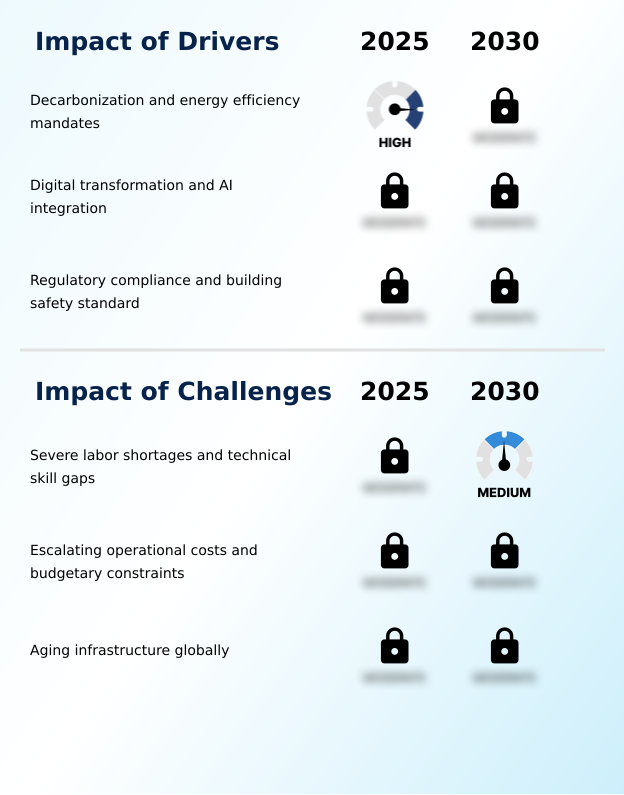
- Decarbonization goals and stringent energy efficiency mandates are key drivers for the facility management market.
- Regulatory pressure and corporate sustainability goals are the primary drivers propelling the market forward. Government-led decarbonization mandates and stringent energy efficiency standards are compelling organizations to invest in technical services that support a net-zero compliance strategy.
- This has led to a marked increase in energy performance contracting and deep retrofitting projects focused on electrical system upkeep and plumbing services.
- For instance, a number of large corporations have initiated comprehensive infrastructure refreshes of their refrigeration and lighting systems, achieving an average energy reduction of 12%.
- The move toward more rigorous carbon disclosure frameworks makes demonstrable energy savings a contractual necessity, cementing the role of facility management as a critical pillar for achieving environmental objectives and ensuring long-term operational resilience and compliance assurance.
What are the market trends shaping the UK Facility Management Industry?
- A prominent market trend is the shift from traditional input-based agreements to outcome-based contracts, which increasingly integrate environmental, social, and governance (ESG) targets.
- A defining trend is the market's migration toward strategic procurement models that prioritize measurable outcomes over transactional tasks. The adoption of outcome-based contracting models is accelerating, with contracts increasingly featuring sustainability-linked kpis and specific carbon reduction milestones. This shift reflects a broader demand for asset value optimization and net-zero compliance strategy.
- Service providers are responding by offering holistic solutions that blend infrastructure refreshes with workplace experience optimization. The use of an integrated workplace management system (iwms) has become more common, with some organizations reporting an 18% improvement in space utilization efficiency.
- This data-centric approach, often described as a one team approach, ensures that facility management contributes directly to corporate sustainability and operational goals, moving beyond simple maintenance to strategic asset stewardship.
What challenges does the UK Facility Management Industry face during its growth?
- Severe labor shortages and widening technical skill gaps present a key challenge to the industry's growth.
- The market faces a critical challenge from a deepening labor crisis, characterized by acute shortages of skilled personnel and a widening technical skill gap. Approximately 68% of industry leaders report persistent difficulties in recruitment and retention, particularly for roles requiring expertise in hvac maintenance and fire safety requirements.
- This scarcity leads to a reliance on reactive maintenance rather than proactive, data-driven strategies. Furthermore, over 70% of hiring managers identify the growing complexity of smart building systems as a significant barrier, as existing workforces often lack the capabilities to manage modern iot platforms.
- This deficit in technical proficiency necessitates costly and extensive upskilling programs, straining operational budgets that are already under pressure and hindering the industry's ability to fully leverage technological advancements for risk-controlled operations.
Exclusive Technavio Analysis on Customer Landscape
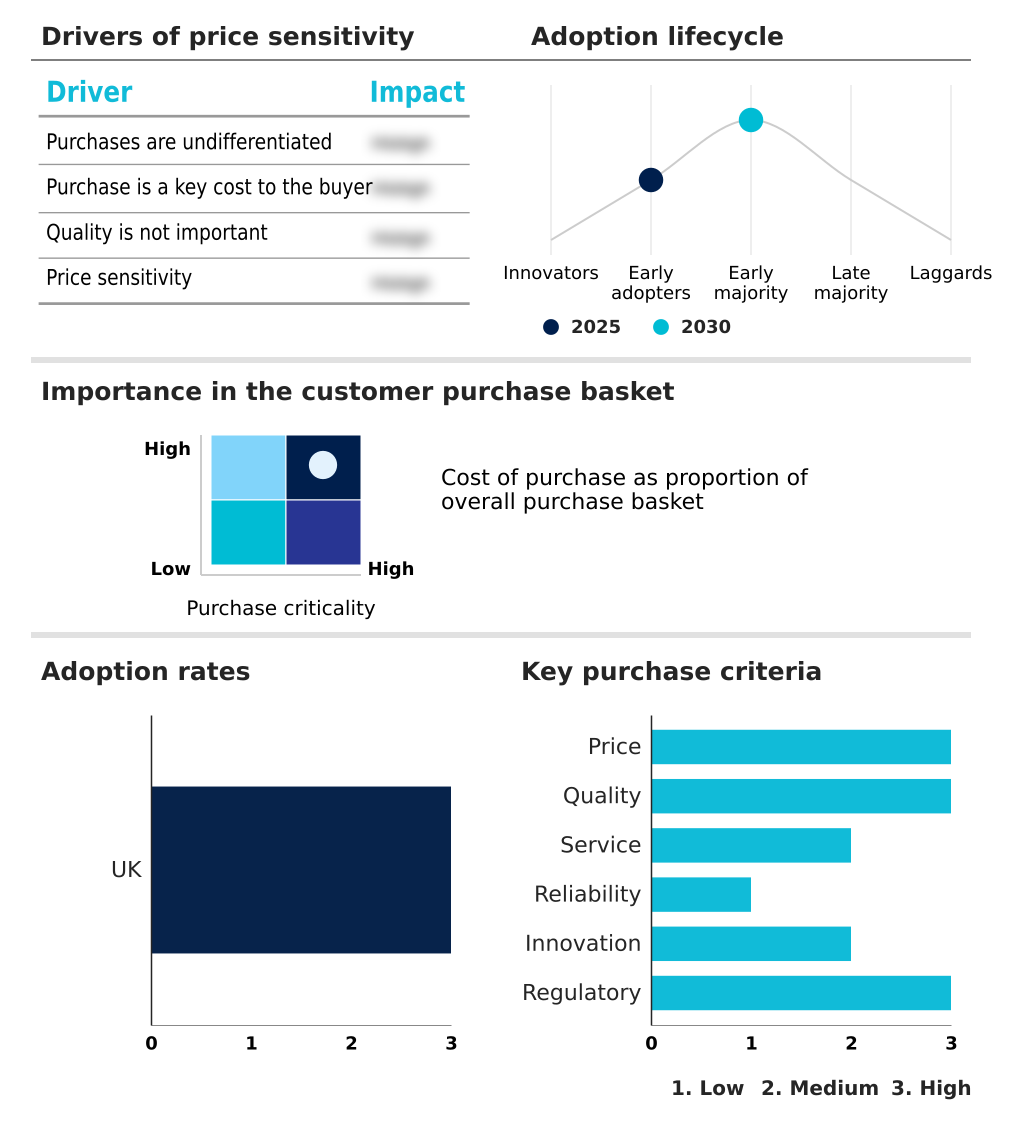
The uk facility management market forecasting report includes the adoption lifecycle of the market, covering from the innovator’s stage to the laggard’s stage. It focuses on adoption rates in different regions based on penetration. Furthermore, the uk facility management market report also includes key purchase criteria and drivers of price sensitivity to help companies evaluate and develop their market growth analysis strategies.
Customer Landscape of UK Facility Management Industry
Competitive Landscape
Companies are implementing various strategies, such as strategic alliances, uk facility management market forecast, partnerships, mergers and acquisitions, geographical expansion, and product/service launches, to enhance their presence in the industry.
Amey Ltd. - Delivering integrated facility management solutions focused on technical services, compliance assurance, and strategic asset optimization to enhance operational efficiency and sustainability.
The industry research and growth report includes detailed analyses of the competitive landscape of the market and information about key companies, including:
- Amey Ltd.
- Bellrock Property and FM
- Bilfinger SE
- CBRE Group Inc.
- Churchill Services Group
- Compass Group Plc
- Cushman and Wakefield Plc
- EMCOR Group Inc.
- G4S Ltd.
- ISS AS
- Jones Lang LaSalle Inc.
- Mitie Group plc
- OCS Group International Ltd.
- Robertson Group
- Savills plc
- Servest Pty Ltd.
- Sodexo SA
- Total FM Ltd.
- Vinci SA
- WW Grainger Inc.
Qualitative and quantitative analysis of companies has been conducted to help clients understand the wider business environment as well as the strengths and weaknesses of key industry players. Data is qualitatively analyzed to categorize companies as pure play, category-focused, industry-focused, and diversified; it is quantitatively analyzed to categorize companies as dominant, leading, strong, tentative, and weak.
Recent Development and News in Uk facility management market
- In January, 2025, OCS Group expanded its partnership with GKN into a total facilities management agreement and acquired Maxim FM to strengthen its regional presence and service capabilities.
- In January, 2025, British Airways awarded a five-year contract to ABM Group UK Limited for specialized aircraft cabin cleaning and secure cleaning services at London Heathrow, highlighting demand in critical infrastructure.
- In January, 2025, Medirest, a division of Compass Group, secured a new contract with a major London healthcare trust to provide essential patient-centric services, including cleaning and catering.
- In April, 2025, the Terrorism (Protection of Premises) Act, also known as Martyn's Law, received royal assent, creating new compliance and security-related service demands within the facility management sector.
Dive into Technavio’s robust research methodology, blending expert interviews, extensive data synthesis, and validated models for unparalleled UK Facility Management Market insights. See full methodology.
| Market Scope | |
|---|---|
| Page number | 177 |
| Base year | 2025 |
| Historic period | 2020-2024 |
| Forecast period | 2026-2030 |
| Growth momentum & CAGR | Accelerate at a CAGR of 4.5% |
| Market growth 2026-2030 | USD 20766.1 million |
| Market structure | Fragmented |
| YoY growth 2025-2026(%) | 4.4% |
| Key countries | UK |
| Competitive landscape | Leading Companies, Market Positioning of Companies, Competitive Strategies, and Industry Risks |
Research Analyst Overview
- The facility management market is pivoting from a cost-focused function to a strategic enabler of business continuity and sustainability. This shift is driven by the imperative for decarbonization mandates and stringent building safety standards, compelling organizations to adopt integrated facilities management.
- Core to this evolution is the deployment of technology, with over 70% of UK businesses now using cloud-based platforms for property portfolio management. The integration of smart building systems and iot platforms for energy performance monitoring and real-time occupancy monitoring is no longer a niche capability but a fundamental component of modern workplace solutions.
- Boardroom decisions are increasingly influenced by the need for compliance assurance and operational resilience, which are delivered through data-driven operational services. Providers are focused on technical services like mechanical and electrical maintenance and hvac maintenance, alongside specialized maintenance for critical assets.
- The emphasis on esg integration and asset lifecycle management has created a competitive landscape where technical resilience and the ability to perform deep retrofitting are key differentiators, forcing a move beyond traditional soft facility management and hard facility management silos.
What are the Key Data Covered in this UK Facility Management Market Research and Growth Report?
-
What is the expected growth of the UK Facility Management Market between 2026 and 2030?
-
USD 20.77 billion, at a CAGR of 4.5%
-
-
What segmentation does the market report cover?
-
The report is segmented by Type (Soft facility management, and Hard facility management), End-user (Commercial, Government, and Residential), Service Type (Outsourced, and In-house) and Geography (Europe)
-
-
Which regions are analyzed in the report?
-
Europe
-
-
What are the key growth drivers and market challenges?
-
Decarbonization and energy efficiency mandates, Severe labor shortages and technical skill gaps
-
-
Who are the major players in the UK Facility Management Market?
-
Amey Ltd., Bellrock Property and FM, Bilfinger SE, CBRE Group Inc., Churchill Services Group, Compass Group Plc, Cushman and Wakefield Plc, EMCOR Group Inc., G4S Ltd., ISS AS, Jones Lang LaSalle Inc., Mitie Group plc, OCS Group International Ltd., Robertson Group, Savills plc, Servest Pty Ltd., Sodexo SA, Total FM Ltd., Vinci SA and WW Grainger Inc.
-
Market Research Insights
- Market dynamics are shaped by a strategic pivot toward integrated service models that prioritize technical resilience and data-driven decision making. Organizations are adopting holistic solutions to achieve net-zero compliance strategy objectives and enhance workplace experience optimization. This push for efficiency is evident as firms implement cloud-based fm solutions to manage resources, with some achieving significant improvements in asset uptime.
- However, this progress is met with considerable friction from workforce challenges; approximately 68% of leaders struggle with staff retention, while over 70% of hiring managers report that the complexity of modern building systems is a major barrier to recruitment.
- This tension between technological advancement and skill availability defines the current competitive landscape, forcing providers to balance innovation with practical workforce development.
We can help! Our analysts can customize this uk facility management market research report to meet your requirements.
 RIA -
RIA - 
