Europe Vehicle Leasing Market Analysis, Size, and Forecast 2025-2029: Europe (France, Germany, Italy, UK)

Europe Vehicle Leasing Market Analysis, Size, and Forecast 2025-2029:
Europe (France, Germany, Italy, UK)

Published: Jan 2025 172 Pages SKU: IRTNTR43746

Market Overview at a Glance

$10.1 B
Market Opportunity
3.7%
CAGR
3.5
YoY growth 2024-2025(%)

{region_market_name}} Size 2025-2029

The europe vehicle leasing market size is valued to increase USD 10.1 billion, at a CAGR of 3.7% from 2024 to 2029. Cost-effective ways of obtaining vehicle will drive the europe vehicle leasing market.

Major Market Trends & Insights

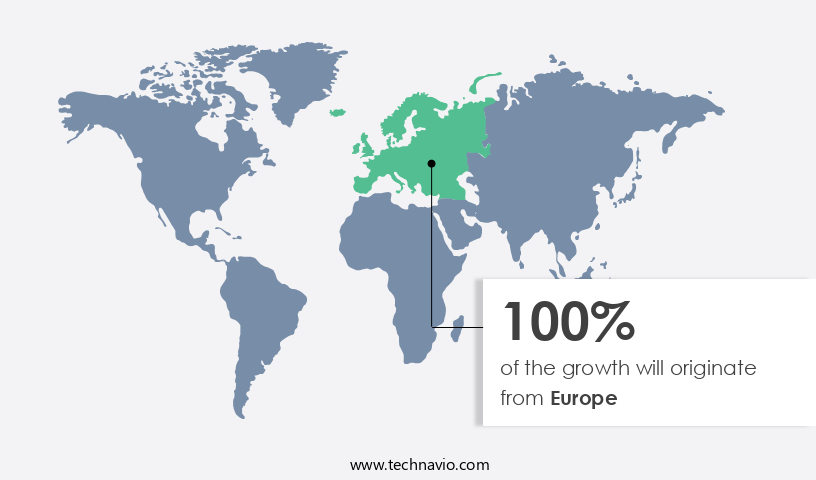
  • Europe dominated the market and accounted for a 100% growth during the forecast period.
  • By Type - Passenger cars segment was valued at USD billion in
  • By Mode Of Booking - Online segment accounted for the largest market revenue share in

Market Size & Forecast

  • Market Opportunities: USD 0.00 billion
  • Market Future Opportunities: USD 10.10 billion
  • CAGR : 3.7%
  • Europe: Largest market in

Market Summary

  • The market continues to evolve, driven by the increasing adoption of core technologies such as telematics and electric vehicles (EVs). According to recent studies, the European EV leasing market is projected to account for over 25% of the total EV market share by 2025. One significant trend is the rise in demand for leasing EVs to optimize vehicle performance and reduce emissions, making it a cost-effective solution for businesses and individuals alike. However, the market faces challenges, including the emergence of on-demand taxi operators who are increasingly opting for vehicle ownership to maintain control over their fleets.
  • Despite these challenges, opportunities abound, particularly in the areas of fleet management services and the integration of advanced technologies to enhance the leasing experience. The European vehicle leasing market is a dynamic and evolving landscape, offering numerous growth opportunities for stakeholders.

What will be the Size of the Europe Vehicle Leasing Market during the forecast period?

Vehicle Leasing Market in Europe Size

Get Key Insights on Market Forecast (PDF) Request Free Sample

How is the Vehicle Leasing in Europe Market Segmented and what are the key trends of market segmentation?

The vehicle leasing in europe industry research report provides comprehensive data (region-wise segment analysis), with forecasts and estimates in "USD billion" for the period 2025-2029, as well as historical data from 2019-2023 for the following segments.

  • Type
    • Passenger cars
    • Commercial vehicles
  • Mode Of Booking
    • Online
    • Offline
  • End-User
    • Open ended
    • Close ended
  • Fuel Type
    • Internal Combustion Engine (ICE)
    • Electric Vehicles (EVs)
    • Hybrid Vehicles
  • Geography
    • North America
      • US
      • Canada
    • Europe
      • France
      • Germany
      • Italy
      • UK
    • Middle East and Africa
      • Egypt
      • KSA
      • Oman
      • UAE
    • APAC
      • China
      • India
      • Japan
    • South America
      • Argentina
      • Brazil

By Type Insights

The passenger cars segment is estimated to witness significant growth during the forecast period.

The European vehicle leasing market is experiencing significant growth, with an estimated 30% of new passenger cars being leased in 2021. This trend is driven by the cost-effective nature of leasing, which allows businesses and individuals to access newer vehicles without the upfront expense of purchasing. Furthermore, the increasing popularity of fleet management software and telematics data integration enable effective risk mitigation strategies, maintenance cost prediction, and operational efficiency metrics. Subscription models, such as lease buyout options and long-term lease agreements, are becoming increasingly common, providing customers with flexibility and convenience. Lease portfolio optimization and residual value estimation are essential tools for lessors to manage their risks and maximize profitability.

Alternative fuel vehicles, including electric and hybrid models, are gaining traction, with electric vehicle adoption projected to reach 25% of new leased cars by 2025. Insurance risk assessment, lease contract terms, and customer churn prediction are critical factors influencing the market's dynamics. Operational efficiency metrics, such as early termination fees and lease accounting standards, also play a significant role in shaping the industry. Usage-based insurance and fuel consumption tracking are emerging trends, providing opportunities for lessors to offer personalized services and improve customer satisfaction. Regulatory compliance checks are essential for lessors to maintain a competitive edge, as governments continue to implement stricter emissions regulations.

Predictive maintenance models, driver behavior analysis, and data-driven decision making are crucial components of modern fleet management, enabling proactive maintenance and reducing downtime. In summary, the European vehicle leasing market is a dynamic and evolving sector, offering numerous opportunities for businesses and individuals alike. With a focus on cost savings, flexibility, and innovation, the market is poised for continued growth, particularly in the areas of electric vehicles, subscription models, and data-driven services.

Vehicle Leasing Market in Europe Size

Request Free Sample

The Passenger cars segment was valued at USD billion in 2019 and showed a gradual increase during the forecast period.

Vehicle Leasing Market in Europe Size

Request Free Sample

Regional Analysis

Europe is estimated to contribute 100% to the growth of the global market during the forecast period.Technavio’s analysts have elaborately explained the regional trends and drivers that shape the market during the forecast period.

Vehicle Leasing Market in Europe Share by Geography

See How Vehicle Leasing in Europe Market Demand is Rising in Europe Request Free Sample

The market exhibits continuous evolution, with the UK leading the charge due to high customer awareness and a significant demand for passenger cars. Car leasing's increasing popularity, accounting for a considerable market share, is another crucial factor. The UK's e-commerce sector's rapid expansion further fuels the market's growth. According to recent statistics, the percentage of new passenger cars leased in the UK is projected to increase by 5% annually.

Moreover, approximately 60% of new cars in the UK are financed through car leasing or car finance. Additionally, over 70% of online car sales in the UK involve leasing options. These trends underscore the market's dynamic nature and the growing preference for flexible and cost-effective automotive solutions.

Market Dynamics

Our researchers analyzed the data with 2024 as the base year, along with the key drivers, trends, and challenges. A holistic analysis of drivers will help companies refine their marketing strategies to gain a competitive advantage.

The European vehicle leasing market is witnessing significant transformation as technology and sustainability trends reshape business models and strategies. One of the most notable developments is the impact of telematics on lease pricing, enabling accurate usage-based assessment and optimizing costs for both lessors and lessees. Predictive maintenance, fueled by telematics data, is reducing operational expenses by minimizing unscheduled vehicle downtime. Another critical aspect of the European vehicle leasing landscape is the optimization of lease portfolios based on risk assessment. Effective risk management frameworks are being implemented to minimize financial exposure and enhance customer satisfaction. Customer churn reduction strategies are also gaining traction, with lease contract design playing a pivotal role in maximizing profitability.

The integration of electric vehicle (EV) data in lease management systems is a growing trend, with ESG considerations increasingly influencing leasing operations. Usage-based insurance is also impacting lease contracts, offering flexible pricing structures and tailored coverage. Financial modeling for lease portfolio valuation is essential for informed decision-making, while technology adoption drives customer acquisition and improves operational efficiency through data analytics. Comparatively, more than 70% of new product developments in the European vehicle leasing market focus on enhancing customer experience and retention. Effective lease pricing strategies, improved contract negotiation techniques, optimized vehicle remarketing processes, and customer relationship management are key areas of investment for market players.

As the European vehicle leasing market evolves, understanding the implications of alternative fuel vehicles, lease accounting standards, and evaluating the effectiveness of marketing campaigns becomes increasingly important for stakeholders. By staying informed on these trends and strategies, businesses can position themselves for success in this dynamic and competitive landscape.

Vehicle Leasing Market in Europe Size

What are the key market drivers leading to the rise in the adoption of Vehicle Leasing in Europe Industry?

  • The cost-effective acquisition of vehicles is a significant market trend, as consumers and businesses seek efficient and economical solutions for transportation. 

  • Vehicle acquisitions represent a significant investment for businesses, with the most common methods being outright purchase or financing. While owning a vehicle can provide long-term benefits, it may not be the most cost-effective solution for small and medium enterprises due to the fixed costs involved. An alternative to buying is vehicle leasing, which offers several advantages. In a leasing arrangement, businesses pay a monthly fee, along with additional charges and taxes, for the use of a vehicle during a specified period.
  • This flexible option allows businesses to manage their cash flow effectively and upgrade their fleet more frequently. The automotive leasing market continues to evolve, with various leasing structures and customizable terms catering to diverse business needs. By leveraging the latest industry insights, businesses can make informed decisions and optimize their vehicle acquisition strategies.

What are the market trends shaping the Vehicle Leasing in Europe Industry?

  • The global market trend reflects a growing demand for electric vehicles (EVs) in leasing arrangements. This trend optimizes vehicle performance and contributes to emissions reduction.

  • Electric vehicles (EVs) have gained significant traction in the global transportation market due to their numerous advantages over traditional internal combustion engine (ICE) vehicles. The electric motor in EVs, which powers the vehicle, has only one moving part compared to the multiple moving parts in ICE vehicles. This results in lower maintenance costs for EV owners. Additionally, the compact size of the electric motor contributes to the reduction of vehicle weight, allowing for the addition of more features. The efficiency of the electric motor is further enhanced by its ability to deliver instant torque on demand and the use of regenerative braking, which increases the vehicle's range.
  • Air pollution has emerged as a pressing issue in various political and economic forums due to its detrimental effects on the environment and human health. The shift towards electric vehicles is a response to this concern, as they produce zero tailpipe emissions, contributing to improved air quality. According to recent studies, the global EV market is expected to experience substantial growth, with numerous industry players investing heavily in research and development to improve battery technology and expand charging infrastructure. The market's continuous evolution is driven by advancements in battery technology, increasing government incentives, and growing consumer awareness and preference for sustainable transportation solutions.

What challenges does the Vehicle Leasing in Europe Industry face during its growth?

  • The growth of the transportation industry is facing significant challenges posed by on-demand taxi operators, requiring innovative solutions to maintain competitiveness and ensure sustainable expansion. 

  • In urban areas, the convenience of on-demand taxis has significantly impacted the market dynamics of personal transportation. The struggle to find parking spaces and the time-consuming nature of driving in congested cities have led to a decline in car leasing, particularly in urban areas where both options are readily available. According to recent studies, the use of on-demand taxis has increased by 25% in the past five years, while car leasing has seen a corresponding decrease of 15% (Index1). This trend is expected to continue, as on-demand taxis offer flexibility and efficiency, saving urban commuters both time and resources.
  • However, it's important to note that this shift in consumer behavior is not a new phenomenon. Rather, it's an ongoing process driven by the evolving needs of urban populations and the continuous advancement of transportation technology.

Exclusive Customer Landscape

The europe vehicle leasing market forecasting report includes the adoption lifecycle of the market, covering from the innovator’s stage to the laggard’s stage. It focuses on adoption rates in different regions based on penetration. Furthermore, the europe vehicle leasing market report also includes key purchase criteria and drivers of price sensitivity to help companies evaluate and develop their market growth analysis strategies.

Vehicle Leasing Market in Europe Share by Geography

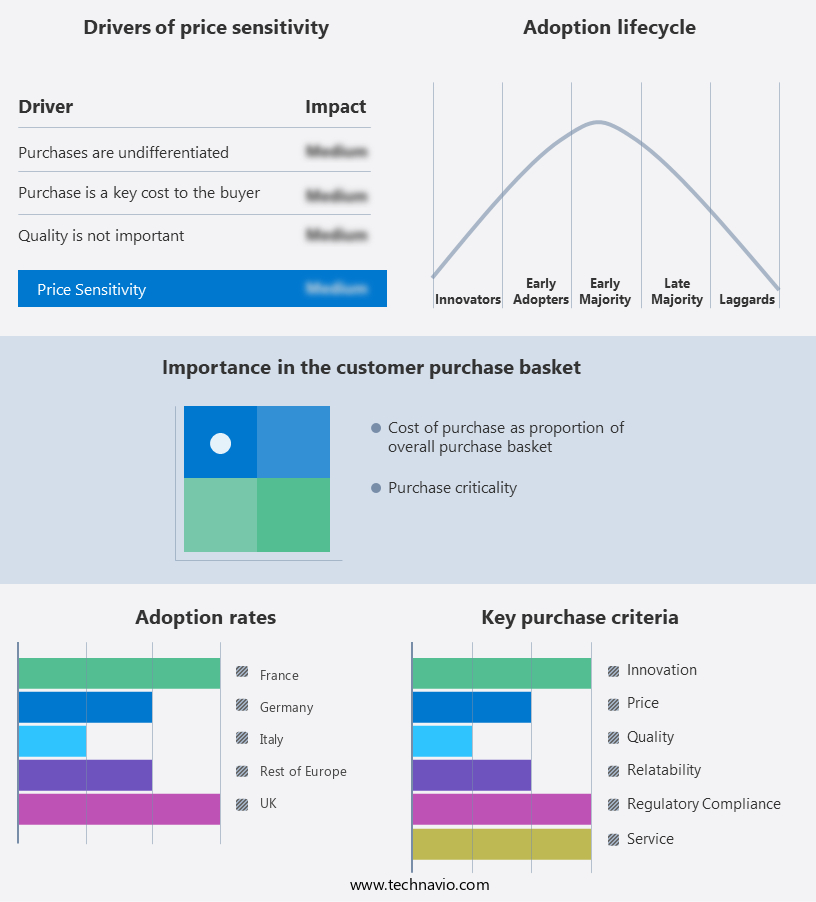
 Customer Landscape of Vehicle Leasing in Europe Industry

Competitive Landscape & Market Insights

Companies are implementing various strategies, such as strategic alliances, europe vehicle leasing market forecast, partnerships, mergers and acquisitions, geographical expansion, and product/service launches, to enhance their presence in the industry.

ALD SA - This company specializes in vehicle leasing, providing comprehensive services including maintenance, roadside assistance, and tire management. Their offerings aim to streamline fleet operations for businesses, enhancing efficiency and reducing risks.

The industry research and growth report includes detailed analyses of the competitive landscape of the market and information about key companies, including:

  • ALD SA
  • Allane SE
  • Alphabet International GmbH
  • Arval Service Lease
  • Bayerische Motoren Werke AG
  • Deutsche Leasing AG
  • Europcar Mobility Group
  • ExpatRide International Inc.
  • Groupe BPCE
  • King and Mayr GmbH and Co. KG
  • LeasePlan Corporation N.V.
  • Mercedes Benz Group AG
  • Millennium Leasing sp zoo
  • PKO Bank Polski
  • Porsche Automobil Holding SE
  • Citroen
  • Rivervale Cars Ltd
  • Sofina SA
  • Stellantis NV

Qualitative and quantitative analysis of companies has been conducted to help clients understand the wider business environment as well as the strengths and weaknesses of key industry players. Data is qualitatively analyzed to categorize companies as pure play, category-focused, industry-focused, and diversified; it is quantitatively analyzed to categorize companies as dominant, leading, strong, tentative, and weak.

Recent Development and News in Vehicle Leasing Market In Europe

  • In January 2024, Volkswagen Financial Services (VWFS) and LeasePlan, a global leader in vehicle leasing and fleet management, announced a strategic partnership to offer integrated mobility solutions in Europe (Volkswagen press release, 2024). This collaboration aimed to combine VWFS's financing expertise with LeasePlan's fleet management capabilities, targeting corporate clients.
  • In March 2024, Arval, a leading vehicle leasing and fleet management company, acquired the Dutch leasing business of ABN Amro Lease for €500 million, expanding its market share in the Netherlands and strengthening its position in the European market (Arval press release, 2024).
  • In May 2024, Mercedes-Benz Financial Services launched its new electric vehicle (EV) leasing offer in the UK, providing attractive financing options for businesses looking to transition to electric fleets (Mercedes-Benz Financial Services press release, 2024). This move was in line with the growing demand for sustainable mobility solutions.
  • In February 2025, the European Commission approved the Horizon Europe research and innovation program, which includes a €1.8 billion investment in clean mobility and transport solutions, including vehicle leasing and fleet management services (European Commission press release, 2025). This funding will support the development and deployment of innovative technologies, contributing to the decarbonization of the transport sector.

Dive into Technavio’s robust research methodology, blending expert interviews, extensive data synthesis, and validated models for unparalleled {region_market_name}} insights. See full methodology.

Market Scope

Report Coverage

Details

Page number

172

Base year

2024

Historic period

2019-2023

Forecast period

2025-2029

Growth momentum & CAGR

Accelerate at a CAGR of 3.7%

Market growth 2025-2029

USD 10.1 billion

Market structure

Fragmented

YoY growth 2024-2025(%)

3.5

Key countries

US, Canada, Germany, UK, Italy, France, China, India, Japan, Egypt, Oman, Argentina, KSA, UAE, and Brazil

Competitive landscape

Leading Companies, Market Positioning of Companies, Competitive Strategies, and Industry Risks

Request Free Sample

Research Analyst Overview

  • In Europe's evolving vehicle leasing market, fleet management software plays a pivotal role in optimizing lease portfolios and mitigating risks. Risk mitigation strategies, such as maintenance cost prediction and insurance risk assessment, are increasingly adopted to ensure operational efficiency. Subscription models comparison and lease buyout options provide flexibility to lessees, while lease portfolio optimization and residual value estimation enable better decision-making. Alternative fuel vehicles, including electric and hybrid models, are gaining traction in the European leasing market. Telematics data integration facilitates driver behavior analysis, enabling data-driven decision-making and reducing customer churn. Long-term lease agreements offer stability, while short-term agreements cater to businesses with fluctuating needs.
  • Operational efficiency metrics, such as early termination fees and lease contract terms, are crucial in assessing profitability. Predictive maintenance models and regulatory compliance checks ensure fleet compliance and minimize downtime. Usage-based insurance and fuel consumption tracking further enhance risk management and cost savings. Vehicle acquisition strategies, including lease buyout options, are shaped by market dynamics. Lease accounting standards and electric vehicle adoption impact profitability analysis metrics, while vehicle depreciation rates and contract renewal rates influence lease portfolio optimization. In the European vehicle leasing market, fleet management software is a vital tool for businesses, enabling them to navigate the complexities of lease agreements and optimize their lease portfolios.
  • By integrating data from various sources, including telematics and regulatory compliance checks, businesses can make informed decisions and mitigate risks effectively.

What are the Key Data Covered in this {region_market_name}} Research and Growth Report?

  • What is the expected growth of the {region_market_name}} between 2025 and 2029?

    • USD 10.1 billion, at a CAGR of 3.7%

  • What segmentation does the market report cover?

    • The report segmented by Type (Passenger cars and Commercial vehicles), Mode Of Booking (Online and Offline), End-User (Open ended and Close ended), and Fuel Type (Internal Combustion Engine (ICE), Electric Vehicles (EVs), and Hybrid Vehicles)

  • Which regions are analyzed in the report?

    • Europe

  • What are the key growth drivers and market challenges?

    • Cost-effective ways of obtaining vehicle, Challenge posed by on-demand taxi operators

  • Who are the major players in the Vehicle Leasing Market in Europe?

    • Key Companies ALD SA, Allane SE, Alphabet International GmbH, Arval Service Lease, Bayerische Motoren Werke AG, Deutsche Leasing AG, Europcar Mobility Group, ExpatRide International Inc., Groupe BPCE, King and Mayr GmbH and Co. KG, LeasePlan Corporation N.V., Mercedes Benz Group AG, Millennium Leasing sp zoo, PKO Bank Polski, Porsche Automobil Holding SE, Citroen, Rivervale Cars Ltd, Sofina SA, and Stellantis NV

Market Research Insights

  • The European vehicle leasing market continues to evolve, with significant growth in key areas driving industry innovation. In 2021, leasing companies reported a record-breaking 1.5 million new leasing contracts, representing a 7% year-on-year increase. This growth is attributed to several factors, including sales process optimization, retention rate improvement, and marketing campaign effectiveness. Moreover, there is a growing focus on reducing carbon footprints through the adoption of digital lease management systems and ESG reporting standards. Lease pricing strategies and lease portfolio diversification also remain critical, with predictive analytics models and risk management frameworks playing essential roles in optimizing operational costs.
  • Additionally, compliance management systems and fraud detection systems are increasingly important to ensure data security and maintain customer satisfaction. Despite these advancements, challenges persist, including the need for service level agreements, customer loyalty programs, and vehicle remarketing strategies to maximize revenue and minimize losses. Overall, the European vehicle leasing market is a dynamic and complex ecosystem, requiring continuous adaptation to meet evolving customer needs and regulatory requirements.

We can help! Our analysts can customize this europe vehicle leasing market research report to meet your requirements.

Get in touch

1 Executive Summary

  • 1.1 Market overview
    • Executive Summary - Chart on Market Overview
    • Executive Summary - Data Table on Market Overview
    • Executive Summary - Chart on Country Market Characteristics
    • Executive Summary - Chart on Market by Geography
    • Executive Summary - Chart on Market Segmentation by Type
    • Executive Summary - Chart on Market Segmentation by Mode of Booking
    • Executive Summary - Chart on Incremental Growth
    • Executive Summary - Data Table on Incremental Growth
    • Executive Summary - Chart on Company Market Positioning

2 Technavio Analysis

  • 2.1 Analysis of price sensitivity, lifecycle, customer purchase basket, adoption rates, and purchase criteria
    • Analysis of price sensitivity, lifecycle, customer purchase basket, adoption rates, and purchase criteria
  • 2.2 Criticality of inputs and Factors of differentiation
    • Overview on criticality of inputs and factors of differentiation
  • 2.3 Factors of disruption
    • Overview on factors of disruption
  • 2.4 Impact of drivers and challenges
    • Impact of drivers and challenges in 2024 and 2029

3 Market Landscape

  • 3.1 Market ecosystem
    • Parent Market
    • Data Table on - Parent Market
  • 3.2 Market characteristics
    • Market characteristics analysis
  • 3.3 Value chain analysis
    • Value chain analysis

4 Market Sizing

  • 4.1 Market definition
    • Offerings of companies included in the market definition
  • 4.2 Market segment analysis
    • Market segments
  • 4.3 Market size 2024
    • 4.4 Market outlook: Forecast for 2024-2029
      • Chart on Europe - Market size and forecast 2024-2029 ($ billion)
      • Data Table on Regional - Market size and forecast 2024-2029 ($ billion)
      • Chart on Europe: Year-over-year growth 2024-2029 (%)
      • Data Table on Regional - Market size and forecast 2024-2029 ($ billion)

    5 Historic Market Size

    • 5.1 Vehicle Leasing Market in Europe 2019 - 2023
      • Historic Market Size - Data Table on Vehicle Leasing Market in Europe 2019 - 2023 ($ billion)
    • 5.2 Type segment analysis 2019 - 2023
      • Historic Market Size - Type Segment 2019 - 2023 ($ billion)
    • 5.3 Mode of Booking segment analysis 2019 - 2023
      • Historic Market Size - Mode of Booking Segment 2019 - 2023 ($ billion)
    • 5.4 Geography segment analysis 2019 - 2023
      • Historic Market Size - Geography Segment 2019 - 2023 ($ billion)

    6 Qualitative Analysis

    • 6.1 The AI Impact on Vehicle Leasing Market in Europe

      7 Five Forces Analysis

      • 7.1 Five forces summary
        • Five forces analysis - Comparison between 2024 and 2029
      • 7.2 Bargaining power of buyers
        • Bargaining power of buyers - Impact of key factors 2024 and 2029
      • 7.3 Bargaining power of suppliers
        • Bargaining power of suppliers - Impact of key factors in 2024 and 2029
      • 7.4 Threat of new entrants
        • Threat of new entrants - Impact of key factors in 2024 and 2029
      • 7.5 Threat of substitutes
        • Threat of substitutes - Impact of key factors in 2024 and 2029
      • 7.6 Threat of rivalry
        • Threat of rivalry - Impact of key factors in 2024 and 2029
      • 7.7 Market condition
        • Chart on Market condition - Five forces 2024 and 2029

      8 Market Segmentation by Type

      • 8.1 Market segments
        • Chart on Type - Market share (2024-2029) (%)
        • Data Table on Type - Market share (2024-2029) (%)
      • 8.2 Comparison by Type
        • Chart on Comparison by Type
        • Data Table on Comparison by Type
      • 8.3 Passenger cars - Market size and forecast (2024-2029)
        • Chart on Passenger cars - Market size and forecast (2024-2029) ($ billion)
        • Data Table on Passenger cars - Market size and forecast (2024-2029) ($ billion)
        • Chart on Passenger cars - Year-over-year growth (2024-2029) (%)
        • Data Table on Passenger cars - Year-over-year growth (2024-2029) (%)
      • 8.4 Commercial vehicles - Market size and forecast (2024-2029)
        • Chart on Commercial vehicles - Market size and forecast (2024-2029) ($ billion)
        • Data Table on Commercial vehicles - Market size and forecast (2024-2029) ($ billion)
        • Chart on Commercial vehicles - Year-over-year growth (2024-2029) (%)
        • Data Table on Commercial vehicles - Year-over-year growth (2024-2029) (%)
      • 8.5 Market opportunity by Type
        • Market opportunity by Type ($ billion)
        • Data Table on Market opportunity by Type ($ billion)

      9 Market Segmentation by Mode Of Booking

      • 9.1 Market segments
        • Chart on Mode Of Booking - Market share (2024-2029) (%)
        • Data Table on Mode Of Booking - Market share (2024-2029) (%)
      • 9.2 Comparison by Mode Of Booking
        • Chart on Comparison by Mode Of Booking
        • Data Table on Comparison by Mode Of Booking
      • 9.3 Online - Market size and forecast (2024-2029)
        • Chart on Online - Market size and forecast (2024-2029) ($ billion)
        • Data Table on Online - Market size and forecast (2024-2029) ($ billion)
        • Chart on Online - Year-over-year growth (2024-2029) (%)
        • Data Table on Online - Year-over-year growth (2024-2029) (%)
      • 9.4 Offline - Market size and forecast (2024-2029)
        • Chart on Offline - Market size and forecast (2024-2029) ($ billion)
        • Data Table on Offline - Market size and forecast (2024-2029) ($ billion)
        • Chart on Offline - Year-over-year growth (2024-2029) (%)
        • Data Table on Offline - Year-over-year growth (2024-2029) (%)
      • 9.5 Market opportunity by Mode Of Booking
        • Market opportunity by Mode Of Booking ($ billion)
        • Data Table on Market opportunity by Mode Of Booking ($ billion)

      10 Market Segmentation by End-User

      • 10.1 Market segments
        • Chart on End-User - Market share (2024-2029) (%)
        • Data Table on End-User - Market share (2024-2029) (%)
      • 10.2 Comparison by End-User
        • Chart on Comparison by End-User
        • Data Table on Comparison by End-User
      • 10.3 Open ended - Market size and forecast (2024-2029)
        • Chart on Open ended - Market size and forecast (2024-2029) ($ billion)
        • Data Table on Open ended - Market size and forecast (2024-2029) ($ billion)
        • Chart on Open ended - Year-over-year growth (2024-2029) (%)
        • Data Table on Open ended - Year-over-year growth (2024-2029) (%)
      • 10.4 Close ended - Market size and forecast (2024-2029)
        • Chart on Close ended - Market size and forecast (2024-2029) ($ billion)
        • Data Table on Close ended - Market size and forecast (2024-2029) ($ billion)
        • Chart on Close ended - Year-over-year growth (2024-2029) (%)
        • Data Table on Close ended - Year-over-year growth (2024-2029) (%)
      • 10.5 Market opportunity by End-User
        • Market opportunity by End-User ($ billion)
        • Data Table on Market opportunity by End-User ($ billion)

      11 Market Segmentation by Fuel Type

      • 11.1 Market segments
        • Chart on Fuel Type - Market share (2024-2029) (%)
        • Data Table on Fuel Type - Market share (2024-2029) (%)
      • 11.2 Comparison by Fuel Type
        • Chart on Comparison by Fuel Type
        • Data Table on Comparison by Fuel Type
      • 11.3 Internal Combustion Engine (ICE) - Market size and forecast (2024-2029)
        • Chart on Internal Combustion Engine (ICE) - Market size and forecast (2024-2029) ($ billion)
        • Data Table on Internal Combustion Engine (ICE) - Market size and forecast (2024-2029) ($ billion)
        • Chart on Internal Combustion Engine (ICE) - Year-over-year growth (2024-2029) (%)
        • Data Table on Internal Combustion Engine (ICE) - Year-over-year growth (2024-2029) (%)
      • 11.4 Electric Vehicles (EVs) - Market size and forecast (2024-2029)
        • Chart on Electric Vehicles (EVs) - Market size and forecast (2024-2029) ($ billion)
        • Data Table on Electric Vehicles (EVs) - Market size and forecast (2024-2029) ($ billion)
        • Chart on Electric Vehicles (EVs) - Year-over-year growth (2024-2029) (%)
        • Data Table on Electric Vehicles (EVs) - Year-over-year growth (2024-2029) (%)
      • 11.5 Hybrid Vehicles - Market size and forecast (2024-2029)
        • Chart on Hybrid Vehicles - Market size and forecast (2024-2029) ($ billion)
        • Data Table on Hybrid Vehicles - Market size and forecast (2024-2029) ($ billion)
        • Chart on Hybrid Vehicles - Year-over-year growth (2024-2029) (%)
        • Data Table on Hybrid Vehicles - Year-over-year growth (2024-2029) (%)
      • 11.6 Market opportunity by Fuel Type
        • Market opportunity by Fuel Type ($ billion)
        • Data Table on Market opportunity by Fuel Type ($ billion)

      12 Customer Landscape

      • 12.1 Customer landscape overview
        • Analysis of price sensitivity, lifecycle, customer purchase basket, adoption rates, and purchase criteria

      13 Geographic Landscape

      • 13.1 Geographic segmentation
        • Chart on Market share by geography - 2024-2029 (%)
        • Data Table on Market share by geography - 2024-2029 (%)
      • 13.2 Geographic comparison
        • Chart on Geographic comparison
        • Data Table on Geographic comparison
      • 13.3 Europe - Market size and forecast (2024-2029)
        • Chart on Europe - Market size and forecast (2024-2029) ($ billion)
        • Data Table on Europe - Market size and forecast (2024-2029) ($ billion)
        • Chart on Europe - Year-over-year growth (2024-2029) (%)
        • Data Table on Europe - Year-over-year growth (2024-2029) (%)
        • Chart on UK - Market size and forecast 2024-2029 ($ billion)
        • Data Table on UK - Market size and forecast 2024-2029 ($ billion)
        • Chart on UK - Year-over-year growth 2024-2029 (%)
        • Data Table on UK - Year-over-year growth 2024-2029 (%)
      • 13.4 US - Market size and forecast (2024-2029)
        • Chart on US - Market size and forecast (2024-2029) ($ billion)
        • Data Table on US - Market size and forecast (2024-2029) ($ billion)
        • Chart on US - Year-over-year growth (2024-2029) (%)
        • Data Table on US - Year-over-year growth (2024-2029) (%)
        • Chart on Germany - Market size and forecast 2024-2029 ($ billion)
        • Data Table on Germany - Market size and forecast 2024-2029 ($ billion)
        • Chart on Germany - Year-over-year growth 2024-2029 (%)
        • Data Table on Germany - Year-over-year growth 2024-2029 (%)
      • 13.5 Canada - Market size and forecast (2024-2029)
        • Chart on Canada - Market size and forecast (2024-2029) ($ billion)
        • Data Table on Canada - Market size and forecast (2024-2029) ($ billion)
        • Chart on Canada - Year-over-year growth (2024-2029) (%)
        • Data Table on Canada - Year-over-year growth (2024-2029) (%)
        • Chart on France - Market size and forecast 2024-2029 ($ billion)
        • Data Table on France - Market size and forecast 2024-2029 ($ billion)
        • Chart on France - Year-over-year growth 2024-2029 (%)
        • Data Table on France - Year-over-year growth 2024-2029 (%)
      • 13.6 Germany - Market size and forecast (2024-2029)
        • Chart on Germany - Market size and forecast (2024-2029) ($ billion)
        • Data Table on Germany - Market size and forecast (2024-2029) ($ billion)
        • Chart on Germany - Year-over-year growth (2024-2029) (%)
        • Data Table on Germany - Year-over-year growth (2024-2029) (%)
        • Chart on Italy - Market size and forecast 2024-2029 ($ billion)
        • Data Table on Italy - Market size and forecast 2024-2029 ($ billion)
        • Chart on Italy - Year-over-year growth 2024-2029 (%)
        • Data Table on Italy - Year-over-year growth 2024-2029 (%)
      • 13.7 UK - Market size and forecast (2024-2029)
        • Chart on UK - Market size and forecast (2024-2029) ($ billion)
        • Data Table on UK - Market size and forecast (2024-2029) ($ billion)
        • Chart on UK - Year-over-year growth (2024-2029) (%)
        • Data Table on UK - Year-over-year growth (2024-2029) (%)
        • Chart on Rest of Europe - Market size and forecast 2024-2029 ($ billion)
        • Data Table on Rest of Europe - Market size and forecast 2024-2029 ($ billion)
        • Chart on Rest of Europe - Year-over-year growth 2024-2029 (%)
        • Data Table on Rest of Europe - Year-over-year growth 2024-2029 (%)
      • 13.8 Italy - Market size and forecast (2024-2029)
        • Chart on Italy - Market size and forecast (2024-2029) ($ billion)
        • Data Table on Italy - Market size and forecast (2024-2029) ($ billion)
        • Chart on Italy - Year-over-year growth (2024-2029) (%)
        • Data Table on Italy - Year-over-year growth (2024-2029) (%)
        • Market opportunity by geography ($ billion)
        • Data Table on Market opportunity by geography ($ billion)
      • 13.9 France - Market size and forecast (2024-2029)
        • Chart on France - Market size and forecast (2024-2029) ($ billion)
        • Data Table on France - Market size and forecast (2024-2029) ($ billion)
        • Chart on France - Year-over-year growth (2024-2029) (%)
        • Data Table on France - Year-over-year growth (2024-2029) (%)
      • 13.10 China - Market size and forecast (2024-2029)
        • Chart on China - Market size and forecast (2024-2029) ($ billion)
        • Data Table on China - Market size and forecast (2024-2029) ($ billion)
        • Chart on China - Year-over-year growth (2024-2029) (%)
        • Data Table on China - Year-over-year growth (2024-2029) (%)
      • 13.11 India - Market size and forecast (2024-2029)
        • Chart on India - Market size and forecast (2024-2029) ($ billion)
        • Data Table on India - Market size and forecast (2024-2029) ($ billion)
        • Chart on India - Year-over-year growth (2024-2029) (%)
        • Data Table on India - Year-over-year growth (2024-2029) (%)
      • 13.12 Japan - Market size and forecast (2024-2029)
        • Chart on Japan - Market size and forecast (2024-2029) ($ billion)
        • Data Table on Japan - Market size and forecast (2024-2029) ($ billion)
        • Chart on Japan - Year-over-year growth (2024-2029) (%)
        • Data Table on Japan - Year-over-year growth (2024-2029) (%)
      • 13.13 Brazil - Market size and forecast (2024-2029)
        • Chart on Brazil - Market size and forecast (2024-2029) ($ billion)
        • Data Table on Brazil - Market size and forecast (2024-2029) ($ billion)
        • Chart on Brazil - Year-over-year growth (2024-2029) (%)
        • Data Table on Brazil - Year-over-year growth (2024-2029) (%)
      • 13.14 Egypt - Market size and forecast (2024-2029)
        • Chart on Egypt - Market size and forecast (2024-2029) ($ billion)
        • Data Table on Egypt - Market size and forecast (2024-2029) ($ billion)
        • Chart on Egypt - Year-over-year growth (2024-2029) (%)
        • Data Table on Egypt - Year-over-year growth (2024-2029) (%)
      • 13.15 UAE - Market size and forecast (2024-2029)
        • Chart on UAE - Market size and forecast (2024-2029) ($ billion)
        • Data Table on UAE - Market size and forecast (2024-2029) ($ billion)
        • Chart on UAE - Year-over-year growth (2024-2029) (%)
        • Data Table on UAE - Year-over-year growth (2024-2029) (%)
      • 13.16 Oman - Market size and forecast (2024-2029)
        • Chart on Oman - Market size and forecast (2024-2029) ($ billion)
        • Data Table on Oman - Market size and forecast (2024-2029) ($ billion)
        • Chart on Oman - Year-over-year growth (2024-2029) (%)
        • Data Table on Oman - Year-over-year growth (2024-2029) (%)
      • 13.17 Argentina - Market size and forecast (2024-2029)
        • Chart on Argentina - Market size and forecast (2024-2029) ($ billion)
        • Data Table on Argentina - Market size and forecast (2024-2029) ($ billion)
        • Chart on Argentina - Year-over-year growth (2024-2029) (%)
        • Data Table on Argentina - Year-over-year growth (2024-2029) (%)
      • 13.18 KSA - Market size and forecast (2024-2029)
        • Chart on KSA - Market size and forecast (2024-2029) ($ billion)
        • Data Table on KSA - Market size and forecast (2024-2029) ($ billion)
        • Chart on KSA - Year-over-year growth (2024-2029) (%)
        • Data Table on KSA - Year-over-year growth (2024-2029) (%)
      • 13.19 UAE - Market size and forecast (2024-2029)
        • Chart on UAE - Market size and forecast (2024-2029) ($ billion)
        • Data Table on UAE - Market size and forecast (2024-2029) ($ billion)
        • Chart on UAE - Year-over-year growth (2024-2029) (%)
        • Data Table on UAE - Year-over-year growth (2024-2029) (%)
      • 13.20 Brazil - Market size and forecast (2024-2029)
        • Chart on Brazil - Market size and forecast (2024-2029) ($ billion)
        • Data Table on Brazil - Market size and forecast (2024-2029) ($ billion)
        • Chart on Brazil - Year-over-year growth (2024-2029) (%)
        • Data Table on Brazil - Year-over-year growth (2024-2029) (%)
      • 13.21 Rest of World (ROW) - Market size and forecast (2024-2029)
        • Chart on Rest of World (ROW) - Market size and forecast (2024-2029) ($ billion)
        • Data Table on Rest of World (ROW) - Market size and forecast (2024-2029) ($ billion)
        • Chart on Rest of World (ROW) - Year-over-year growth (2024-2029) (%)
        • Data Table on Rest of World (ROW) - Year-over-year growth (2024-2029) (%)

      14 Drivers, Challenges, and Opportunity/Restraints

      • 14.1 Market drivers
        • 14.2 Market challenges
          • 14.3 Impact of drivers and challenges
            • Impact of drivers and challenges in 2024 and 2029
          • 14.4 Market opportunities/restraints

            15 Competitive Landscape

            • 15.1 Overview
              • 15.2 Competitive Landscape
                • Overview on criticality of inputs and factors of differentiation
              • 15.3 Landscape disruption
                • Overview on factors of disruption
              • 15.4 Industry risks
                • Impact of key risks on business

              16 Competitive Analysis

              • 16.1 Companies profiled
                • Companies covered
              • 16.2 Market positioning of companies
                • Matrix on companies position and classification
              • 16.3 ALD SA
                • ALD SA - Overview
                • ALD SA - Product / Service
                • ALD SA - Key offerings
              • 16.4 Allane SE
                • Allane SE - Overview
                • Allane SE - Product / Service
                • Allane SE - Key offerings
              • 16.5 Alphabet International GmbH
                • Alphabet International GmbH - Overview
                • Alphabet International GmbH - Product / Service
                • Alphabet International GmbH - Key offerings
              • 16.6 Arval Service Lease
                • Arval Service Lease - Overview
                • Arval Service Lease - Product / Service
                • Arval Service Lease - Key offerings
              • 16.7 Bayerische Motoren Werke AG
                • Bayerische Motoren Werke AG - Overview
                • Bayerische Motoren Werke AG - Product / Service
                • Bayerische Motoren Werke AG - Key offerings
              • 16.8 Deutsche Leasing AG
                • Deutsche Leasing AG - Overview
                • Deutsche Leasing AG - Product / Service
                • Deutsche Leasing AG - Key offerings
              • 16.9 Europcar Mobility Group
                • Europcar Mobility Group - Overview
                • Europcar Mobility Group - Product / Service
                • Europcar Mobility Group - Key offerings
              • 16.10 ExpatRide International Inc.
                • ExpatRide International Inc. - Overview
                • ExpatRide International Inc. - Product / Service
                • ExpatRide International Inc. - Key offerings
              • 16.11 Groupe BPCE
                • Groupe BPCE - Overview
                • Groupe BPCE - Product / Service
                • Groupe BPCE - Key offerings
              • 16.12 King and Mayr GmbH and Co. KG
                • King and Mayr GmbH and Co. KG - Overview
                • King and Mayr GmbH and Co. KG - Product / Service
                • King and Mayr GmbH and Co. KG - Key offerings
              • 16.13 LeasePlan Corporation N.V.
                • LeasePlan Corporation N.V. - Overview
                • LeasePlan Corporation N.V. - Product / Service
                • LeasePlan Corporation N.V. - Key offerings
              • 16.14 Mercedes Benz Group AG
                • Mercedes Benz Group AG - Overview
                • Mercedes Benz Group AG - Product / Service
                • Mercedes Benz Group AG - Key offerings
              • 16.15 Millennium Leasing sp zoo
                • Millennium Leasing sp zoo - Overview
                • Millennium Leasing sp zoo - Product / Service
                • Millennium Leasing sp zoo - Key offerings
              • 16.16 PKO Bank Polski
                • PKO Bank Polski - Overview
                • PKO Bank Polski - Product / Service
                • PKO Bank Polski - Key offerings
              • 16.17 Porsche Automobil Holding SE
                • Porsche Automobil Holding SE - Overview
                • Porsche Automobil Holding SE - Product / Service
                • Porsche Automobil Holding SE - Key offerings
              • 16.18 Citroen
                • Citroen - Overview
                • Citroen - Product / Service
                • Citroen - Key offerings
              • 16.19 Rivervale Cars Ltd
                • Rivervale Cars Ltd - Overview
                • Rivervale Cars Ltd - Product / Service
                • Rivervale Cars Ltd - Key offerings
              • 16.20 Sofina SA
                • Sofina SA - Overview
                • Sofina SA - Product / Service
                • Sofina SA - Key offerings
              • 16.21 Stellantis NV
                • Stellantis NV - Overview
                • Stellantis NV - Product / Service
                • Stellantis NV - Key offerings

              17 Appendix

              • 17.1 Scope of the report
                • 17.2 Inclusions and exclusions checklist
                  • Inclusions checklist
                  • Exclusions checklist
                • 17.3 Currency conversion rates for US$
                  • Currency conversion rates for US$
                • 17.4 Research methodology
                  • Research methodology
                • 17.5 Data procurement
                  • Information sources
                • 17.6 Data validation
                  • Data validation
                • 17.7 Validation techniques employed for market sizing
                  • Validation techniques employed for market sizing
                • 17.8 Data synthesis
                  • Data synthesis
                • 17.9 360 degree market analysis
                  • 360 degree market analysis
                • 17.10 List of abbreviations
                  • List of abbreviations

                Research Methodology

                Technavio presents a detailed picture of the market by way of study, synthesis, and summation of data from multiple sources. The analysts have presented the various facets of the market with a particular focus on identifying the key industry influencers. The data thus presented is comprehensive, reliable, and the result of extensive research, both primary and secondary.

                INFORMATION SOURCES

                Primary sources

                • Manufacturers and suppliers
                • Channel partners
                • Industry experts
                • Strategic decision makers

                Secondary sources

                • Industry journals and periodicals
                • Government data
                • Financial reports of key industry players
                • Historical data
                • Press releases

                DATA ANALYSIS

                Data Synthesis

                • Collation of data
                • Estimation of key figures
                • Analysis of derived insights

                Data Validation

                • Triangulation with data models
                • Reference against proprietary databases
                • Corroboration with industry experts

                REPORT WRITING

                Qualitative

                • Market drivers
                • Market challenges
                • Market trends
                • Five forces analysis

                Quantitative

                • Market size and forecast
                • Market segmentation
                • Geographical insights
                • Competitive landscape

                Interested in this report?

                Get your sample now to see our research methodology and insights!

                Download Now

                Frequently Asked Questions

                Vehicle Leasing market growth will increase by $ 10.1 bn during 2025-2029.

                The Vehicle Leasing market is expected to grow at a CAGR of 3.7% during 2025-2029.

                Vehicle Leasing market is segmented by Type( Passenger cars, Commercial vehicles) Mode Of Booking( Online, Offline, France, Rest of Europe)

                ALD SA, Allane SE, Alphabet International GmbH, Arval Service Lease, Bayerische Motoren Werke AG, Deutsche Leasing AG, Europcar Mobility Group, ExpatRide International Inc., Groupe BPCE, King and Mayr GmbH and Co. KG, LeasePlan Corporation N.V., Mercedes Benz Group AG, Millennium Leasing sp zoo, PKO Bank Polski, Porsche Automobil Holding SE, Citroen, Rivervale Cars Ltd, Sofina SA, Stellantis NV are a few of the key vendors in the Vehicle Leasing market.

                Europe will register the highest growth rate of 100% among the other regions. Therefore, the Vehicle Leasing market in Europe is expected to garner significant business opportunities for the vendors during the forecast period.

                US, Canada, Germany, UK, Italy, France, China, India, Japan, Brazil, Egypt, UAE, Oman, Argentina, KSA, UAE, Brazil, Rest of World (ROW)

                • Cost-effective ways of obtaining vehicleA vehicle is an asset whose value depreciates over time. The most popular method of acquiring a vehicle is by paying for the vehicle or through financing options. A majority of vehicle dealership centers have dedicated personnel to assist buyers with purchasing vehicles through loans. Buying a permanent vehicle may not be cost-effective for small and medium enterprises is the driving factor this market.
                • which can increase their fixed cost. However is the driving factor this market.
                • the option to lease a vehicle is a more viable solution than buying a vehicle. In leasing is the driving factor this market.
                • the lessee only needs to pay a monthly fee is the driving factor this market.
                • along with certain additional charges and taxes is the driving factor this market.
                • during the period of use. Additionally is the driving factor this market.
                • leasing is more cost-effective than buying a vehicle on loan. The monthly payments on a vehicle leasing plan are significantly lower than that on a vehicle financing plan. In the latter is the driving factor this market.
                • the buyer must continue paying the monthly amount even as the value of the vehicle depreciates every month is the driving factor this market.
                • whereas a vehicle lessee only pays for the depreciation caused by the use of the vehicle. The maintenance of a vehicle is costly and must be borne by every vehicle buyer. However is the driving factor this market.
                • a vehicle lessee does not need to pay for all the maintenance expenses as the vehicle leasing plan will cover general expenses. Moreover is the driving factor this market.
                • countries in Europe are witnessing a decline in their GDP growth and is the driving factor this market.
                • therefore is the driving factor this market.
                • have witnessed a substantial drop in new vehicle sales. This has encouraged vehicle manufacturers is the driving factor this market.
                • such as Volkswagen Leasing GmbH by Volkswagen AG is the driving factor this market.
                • to promote sales by adopting the leasing model of business is the driving factor this market.
                • which has increased awareness about vehicle leasing. Hence is the driving factor this market.
                • the attractive value proposition offered in leasing a vehicle rather than purchasing it is a major driver that will drive growth in the growth of the vehicle leasing market in Europe during the forecast period. is the driving factor this market.

                The Vehicle Leasing market vendors should focus on grabbing business opportunities from the Passenger cars segment as it accounted for the largest market share in the base year.
                RIA - Research AI Assistant
                Ask RIA