Car Leasing Market Analysis, Size, and Forecast 2026-2030: Europe (Germany, UK, and France), North America (US, Canada, and Mexico), APAC (China, Japan, and India), South America (Brazil, Argentina, and Colombia), Middle East and Africa (UAE, Saudi Arabia, and South Africa), and Rest of World (ROW)

Car Leasing Market Analysis, Size, and Forecast 2026-2030:
Europe (Germany, UK, and France), North America (US, Canada, and Mexico), APAC (China, Japan, and India), South America (Brazil, Argentina, and Colombia), Middle East and Africa (UAE, Saudi Arabia, and South Africa), and Rest of World (ROW)

Published: Mar 2026 314 Pages SKU: IRTNTR41043

Market Overview at a Glance

$59.75 B
Market Opportunity
8.7%
CAGR 2025 - 2030
35.5%
Europe Growth
$81.79 B
Commercial segment 2024

Car Leasing Market Size 2026-2030

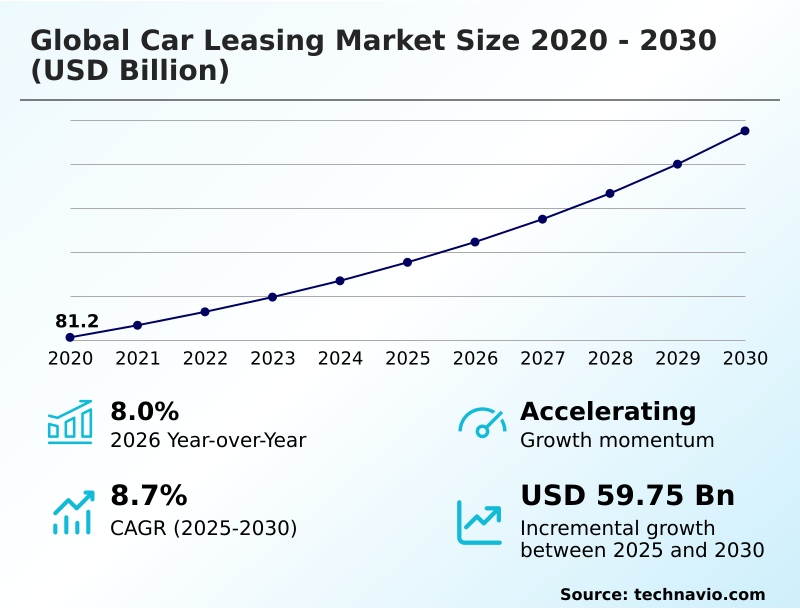
The car leasing market size is valued to increase by USD 59.75 billion, at a CAGR of 8.7% from 2025 to 2030. Paradigm shift from vehicle ownership to usership will drive the car leasing market.

Major Market Trends & Insights

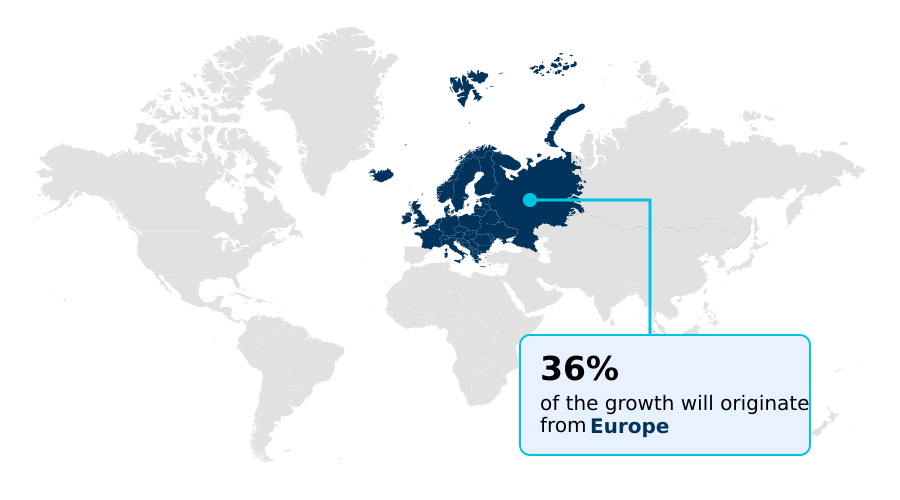
  • Europe dominated the market and accounted for a 35.5% growth during the forecast period.
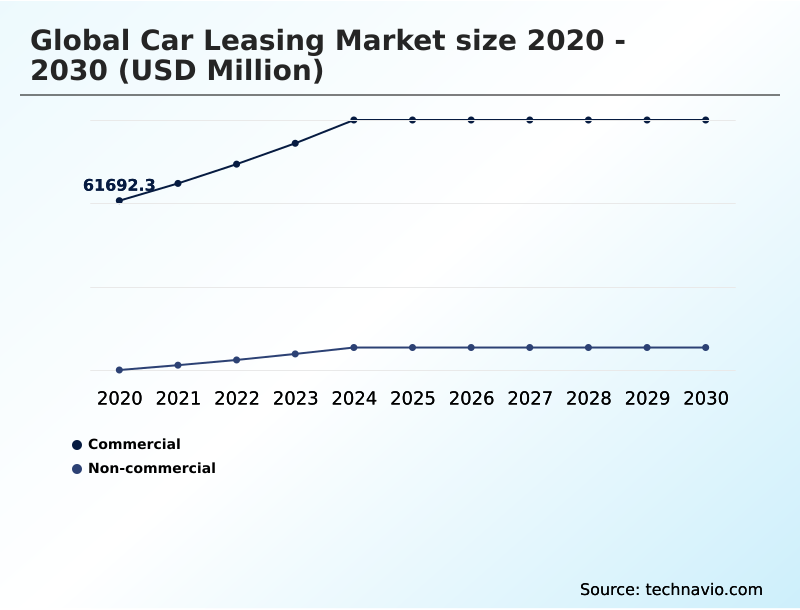
  • By End-user - Commercial segment was valued at USD 81.79 billion in 2024
  • By Type - Open-ended segment accounted for the largest market revenue share in 2024

Market Size & Forecast

  • Market Opportunities: USD 93.85 billion
  • Market Future Opportunities: USD 59.75 billion
  • CAGR from 2025 to 2030 : 8.7%

Market Summary

  • The car leasing market is undergoing a significant transformation, moving beyond a simple financing mechanism to become an integral component of modern mobility. This shift is driven by changing consumer and corporate preferences that prioritize access over ownership, financial predictability, and operational efficiency.
  • For businesses, corporate vehicle leasing programs offer compelling advantages, including capital expenditure avoidance and the ability to outsource complex vehicle lifecycle administration to specialized providers. This allows companies to focus on core activities while benefiting from optimized fleet utilization and effective depreciation risk management.
  • In the consumer space, personal contract hire options provide access to newer, safer vehicles with the latest connected car technology without the long-term commitment or financial risk of ownership. The industry is also a key enabler of sustainability goals, as electric vehicle (EV) leasing makes greener technologies more accessible by mitigating concerns over high upfront costs and residual value uncertainty.
  • However, the car leasing market faces challenges from the rise of Mobility-as-a-Service (MaaS) platforms and the need for continuous digital transformation to meet heightened customer expectations for seamless, on-demand service.

What will be the Size of the Car Leasing Market during the forecast period?

Get Key Insights on Market Forecast (PDF) Request Free Sample

How is the Car Leasing Market Segmented?

The car leasing industry research report provides comprehensive data (region-wise segment analysis), with forecasts and estimates in "USD million" for the period 2026-2030, as well as historical data from 2020-2024 for the following segments.

  • End-user
    • Commercial
    • Non-commercial
  • Type
    • Open-ended
    • Close ended
  • Vehicle type
    • Passenger cars
    • Commercial vehicles
  • Geography
    • Europe
      • Germany
      • UK
      • France
    • North America
      • US
      • Canada
      • Mexico
    • APAC
      • China
      • Japan
      • India
    • South America
      • Brazil
      • Argentina
      • Colombia
    • Middle East and Africa
      • UAE
      • Saudi Arabia
      • South Africa
    • Rest of World (ROW)

By End-user Insights

The commercial segment is estimated to witness significant growth during the forecast period.

The commercial segment is foundational, driven by the strategic need for optimal asset management and operational efficiency. Through business fleet leasing benefits, companies achieve critical capital expenditure avoidance, transforming vehicle acquisition into a predictable operational expense.

This shift enhances cash flow and supports both large corporations and SME fleet management services. Comprehensive fleet management solutions are central, offering outsourced fleet administration from procurement to used vehicle remarketing.

Such services ensure regulatory compliance and optimize fleet utilization, with data analytics enabling advanced cost control and vehicle asset management. Firms leveraging these services report up to a 15% reduction in operational overhead.

This focus on economic rationality makes commercial vehicle leasing indispensable for modern business strategy.

Request Free Sample

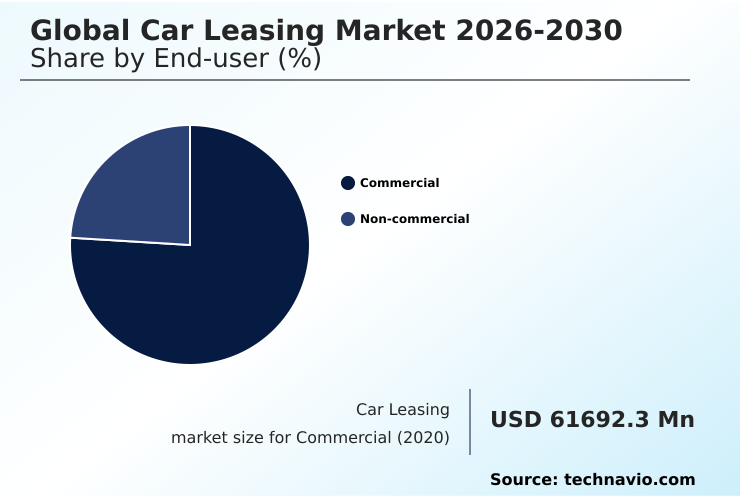
The Commercial segment was valued at USD 81.79 billion in 2024 and showed a gradual increase during the forecast period.

Request Free Sample

Regional Analysis

Europe is estimated to contribute 35.5% to the growth of the global market during the forecast period.Technavio’s analysts have elaborately explained the regional trends and drivers that shape the market during the forecast period.

See How Car Leasing Market Demand is Rising in Europe Request Free Sample

Europe leads the global landscape, commanding over 35% of market activity due to mature corporate sectors and aggressive fleet electrification mandates. North America follows, where captive finance arms drive a robust consumer market accustomed to closed-end lease structures.

The fastest growth is in APAC, projected at 9.7% annually, fueled by urbanization and rising demand for SME fleet management services where operational leasing is a key financial tool.

Distinct models thrive regionally, such as novated leasing as a salary packaging arrangement in Australia. Emerging regions see growth in luxury car leasing deals and vehicle leasing for expatriates.

The open-ended lease remains a critical tool for commercial fleets with unpredictable usage patterns globally.

Market Dynamics

Our researchers analyzed the data with 2025 as the base year, along with the key drivers, trends, and challenges. A holistic analysis of drivers will help companies refine their marketing strategies to gain a competitive advantage.

  • The strategic landscape for leasing providers is increasingly complex, requiring a deep understanding of nuanced customer needs. For corporate clients, the decision framework involves questions like how does open-ended leasing work for commercial fleets, especially for those needing flexibility without mileage penalties. Small businesses are discovering the benefits of full-service leasing for small business, which simplifies operations and budget management.
  • A major area of focus is understanding residual value in an EV lease, as this is critical for pricing and risk. The digital transformation in the vehicle leasing process is now paramount, directly impacting the customer experience in the digital car leasing journey from initial query to contract finalization.
  • Providers must offer clear guidance on how to calculate total cost of a car lease and explain how to manage wear and tear charges on a leased car to build trust. As business becomes more global, addressing the challenges of managing a cross-border vehicle fleet is a key differentiator.
  • The industry must also clarify what is a Terminal Rental Adjustment Clause (TRAC) lease to its commercial clients. For individuals, providers must explain the tax implications of novated car leasing and help them compare car subscription services vs traditional lease.
  • Offering the best lease options for high-mileage drivers and a flexible car lease for temporary work assignments opens up new market segments. The growing impact of MaaS platforms on corporate leasing and the influence of how do manufacturer captive finance arms influence leasing are strategic threats that demand innovative responses.
  • Ultimately, success will depend on a combination of effective strategies for remarketing off-lease vehicles effectively, a solid legal framework for corporate vehicle leasing, and leveraging the role of data analytics in residual value prediction, which is now more critical than transitioning a corporate fleet to electric vehicles, where operational gains can surpass initial cost concerns by a factor of two.

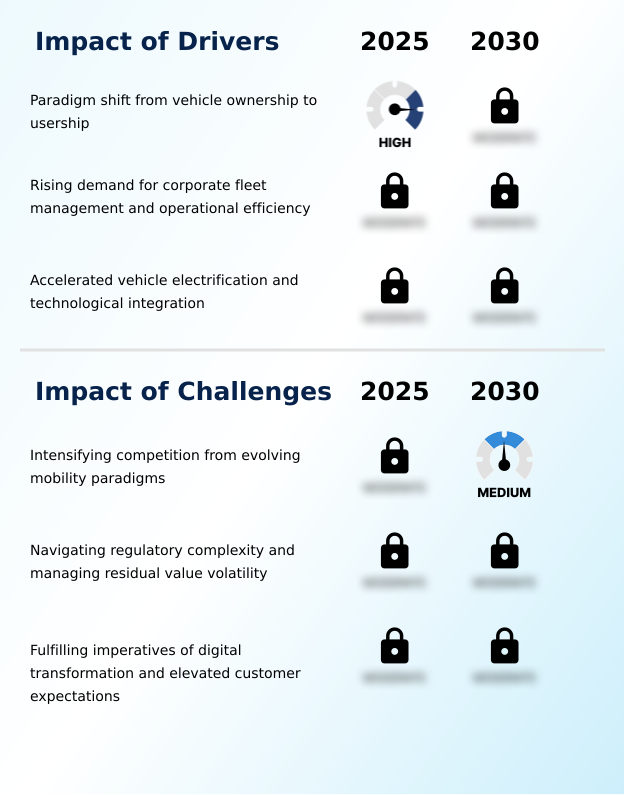
What are the key market drivers leading to the rise in the adoption of Car Leasing Industry?

  • A paradigm shift in consumer and corporate mindset from traditional vehicle ownership to a more flexible, service-oriented usership model is a primary driver for the market.

  • The paradigm shift to usership is a core market driver, centered on financial flexibility and effective depreciation risk management.
  • Corporate vehicle leasing programs are expanding as businesses seek to lower the total cost of ownership (TCO) by converting assets to operational expenses. This strategy is enabled by full-service leasing arrangements offering superior cost control and financial risk mitigation.
  • The use of telematics for fleet efficiency through advanced telematics data integration provides up to a 20% improvement in fleet performance.
  • The rapid pace of innovation also drives the market, as a clear fleet electrification strategy makes low-emission vehicle leasing a crucial, low-risk pathway for accessing evolving technology without the uncertainty of long-term capital commitment.

What are the market trends shaping the Car Leasing Industry?

  • The emergence of flexible leasing arrangements and vehicle subscription services represents a transformative market trend. These models cater to a growing demand for adaptable, short-term mobility solutions.

  • The market's evolution is defined by a digital transformation enabling highly flexible mobility. The rise of the all-inclusive car subscription model and flexible short-term car lease options caters to modern demands for adaptability, with online lease comparison tools enhancing transparency. This shift is enabled by digital vehicle configurators and rapid online credit assessment, reducing application-to-approval times by over 40%.
  • The trend toward sustainable mobility solutions also accelerates adoption of electric vehicle (EV) leasing, a key part of modern asset management. Proliferation of connected car technology allows for predictive maintenance alerts, ensuring users can access the latest software-defined products and advanced driver-assistance systems (ADAS) without long-term ownership risk.

What challenges does the Car Leasing Industry face during its growth?

  • The market faces a significant challenge from intensifying competition, which stems from a diverse and evolving ecosystem of alternative mobility paradigms.

  • The industry faces intense competition from Mobility-as-a-Service (MaaS) platforms and asset-light business models. A critical challenge involves navigating the residual value risk in leasing, particularly with the volatility of residual value forecasting for EVs, where miscalculations can impact margins by over 10%. Managing disparate regulations, including complex company car tax implications and benefit-in-kind taxation, adds operational burden.
  • Furthermore, meeting customer expectations for lease contract flexibility requires a robust customer relationship management system providing a frictionless digital experience. This includes transparently handling terms like mileage allowance and wear-and-tear standards, as well as the end-of-lease purchase option, challenging traditional vehicle lifecycle administration.

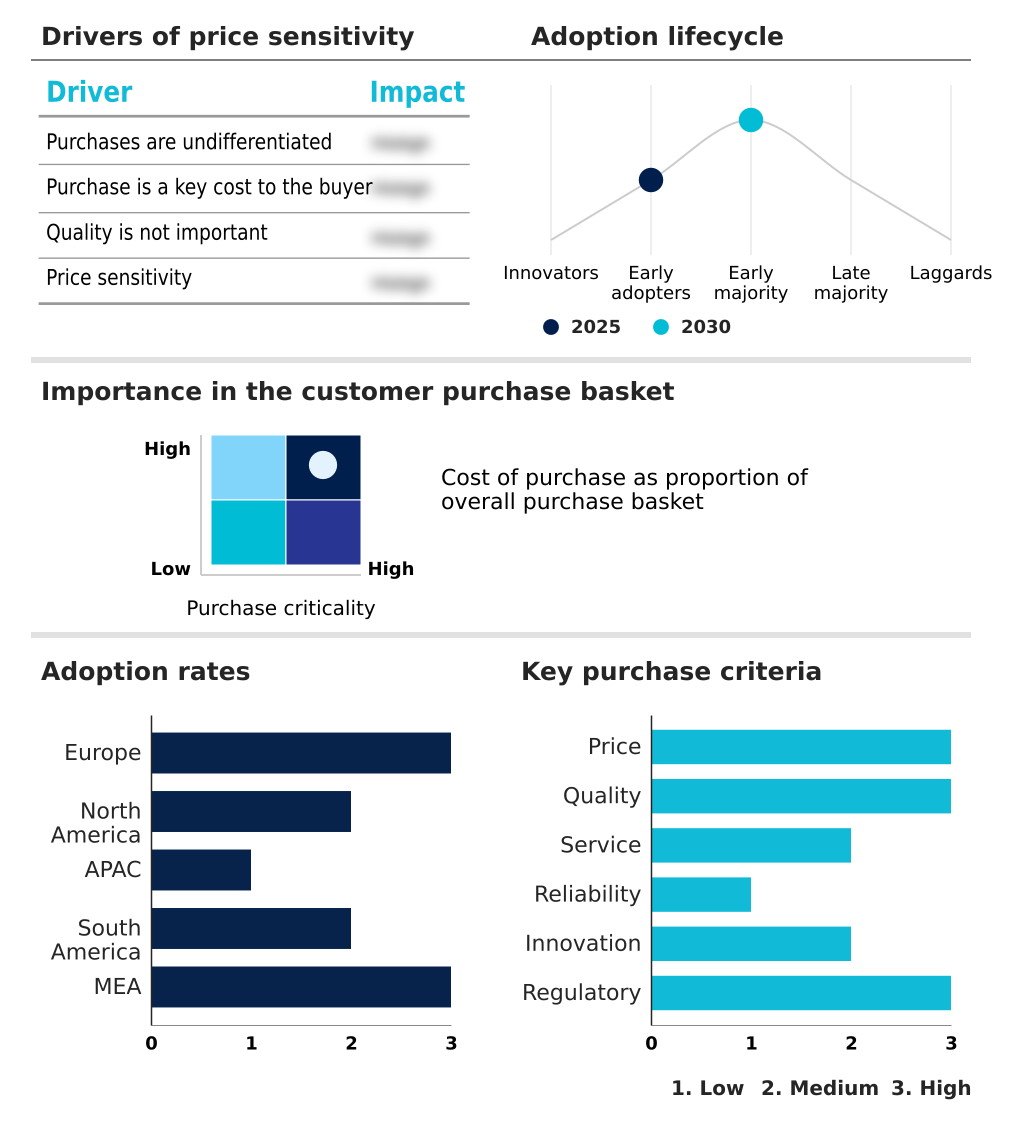
Exclusive Technavio Analysis on Customer Landscape

The car leasing market forecasting report includes the adoption lifecycle of the market, covering from the innovator’s stage to the laggard’s stage. It focuses on adoption rates in different regions based on penetration. Furthermore, the car leasing market report also includes key purchase criteria and drivers of price sensitivity to help companies evaluate and develop their market growth analysis strategies.

Customer Landscape of Car Leasing Industry

Competitive Landscape

Companies are implementing various strategies, such as strategic alliances, car leasing market forecast, partnerships, mergers and acquisitions, geographical expansion, and product/service launches, to enhance their presence in the industry.

Autoflex Group LLC - Offers vehicle leasing solutions developed through strategic alliances with fleet operators and mobility providers, enhancing asset-light business models.

The industry research and growth report includes detailed analyses of the competitive landscape of the market and information about key companies, including:

  • Autoflex Group LLC
  • Avis Budget Group Inc.
  • Ayvens Group
  • Bayerische Motoren Werke AG
  • BNP Paribas SA
  • Caldwell Leasing
  • Deutsche Leasing AG
  • Dr. Ing. h.c. F. Porsche AG
  • Enterprise Holdings Inc.
  • Executive Car Leasing Co.
  • ExpatRide International Inc.
  • Hertz Global Holdings Inc.
  • International Car Lease Holding
  • Masterlease Group
  • Mazda Motor Corp.
  • Mercedes Benz Group AG
  • Orix Corp.
  • SIXT SE
  • Volkswagen AG
  • Zoomcar India Pvt. Ltd.

Qualitative and quantitative analysis of companies has been conducted to help clients understand the wider business environment as well as the strengths and weaknesses of key industry players. Data is qualitatively analyzed to categorize companies as pure play, category-focused, industry-focused, and diversified; it is quantitatively analyzed to categorize companies as dominant, leading, strong, tentative, and weak.

Recent Development and News in Car leasing market

  • In February 2025, Ayvens entered into a framework agreement with Stellantis to purchase up to 500,000 vehicles for its long-term leasing fleet across Europe through 2026, with initial deliveries starting in the first half of 2025.
  • In January 2025, SIXT SE announced a multi-billion euro agreement with Stellantis to purchase up to 250,000 vehicles for its rental fleets in Europe and North America over three years, including various EV models.
  • In November 2024, Enterprise Holdings Inc. launched a new digital fleet management system integrating AI and telematics to enhance its corporate and EV leasing services across North America.
  • In September 2024, Avis Budget Group partnered with Kia India to launch flexible vehicle leasing and subscription services, aiming to cater to evolving consumer mobility preferences in the Indian market.

Dive into Technavio’s robust research methodology, blending expert interviews, extensive data synthesis, and validated models for unparalleled Car Leasing Market insights. See full methodology.

Market Scope
Page number 314
Base year 2025
Historic period 2020-2024
Forecast period 2026-2030
Growth momentum & CAGR Accelerate at a CAGR of 8.7%
Market growth 2026-2030 USD 59748.9 million
Market structure Fragmented
YoY growth 2025-2026(%) 8.0%
Key countries Germany, UK, France, Italy, Spain, The Netherlands, US, Canada, Mexico, China, Japan, India, Australia, South Korea, Indonesia, Brazil, Argentina, Colombia, UAE, Saudi Arabia, South Africa, Israel and Turkey
Competitive landscape Leading Companies, Market Positioning of Companies, Competitive Strategies, and Industry Risks

Request Free Sample

Research Analyst Overview

  • The car leasing market is defined by a strategic pivot towards comprehensive mobility provision, driven by the need for advanced fleet management solutions and effective depreciation risk management. The industry's evolution requires mastery over both the open-ended lease for flexible commercial use and the closed-end lease for consumer predictability.
  • Success now hinges on sophisticated residual value forecasting, where the use of data analytics has been shown to improve accuracy by over 18%, directly impacting profitability. Digital transformation is no longer optional; it is essential for everything from online credit assessment to managing the entire vehicle lifecycle administration.
  • As companies pursue fleet electrification, the role of electric vehicle (EV) leasing becomes central, demanding new expertise in asset management. The integration of connected car technology enables predictive maintenance alerts, enhancing the value proposition of full-service leasing.
  • Providers must also navigate complex regulatory landscapes, including benefit-in-kind taxation, while optimizing fleet utilization and ensuring robust customer relationship management to defend against disruption from Mobility-as-a-Service (MaaS) platforms and agile vehicle subscription services.

What are the Key Data Covered in this Car Leasing Market Research and Growth Report?

  • What is the expected growth of the Car Leasing Market between 2026 and 2030?

    • USD 59.75 billion, at a CAGR of 8.7%

  • What segmentation does the market report cover?

    • The report is segmented by End-user (Commercial, and Non-commercial), Type (Open-ended, and Close ended), Vehicle Type (Passenger cars, and Commercial vehicles) and Geography (Europe, North America, APAC, South America, Middle East and Africa)

  • Which regions are analyzed in the report?

    • Europe, North America, APAC, South America and Middle East and Africa

  • What are the key growth drivers and market challenges?

    • Paradigm shift from vehicle ownership to usership, Intensifying competition from evolving mobility paradigms

  • Who are the major players in the Car Leasing Market?

    • Autoflex Group LLC, Avis Budget Group Inc., Ayvens Group, Bayerische Motoren Werke AG, BNP Paribas SA, Caldwell Leasing, Deutsche Leasing AG, Dr. Ing. h.c. F. Porsche AG, Enterprise Holdings Inc., Executive Car Leasing Co., ExpatRide International Inc., Hertz Global Holdings Inc., International Car Lease Holding, Masterlease Group, Mazda Motor Corp., Mercedes Benz Group AG, Orix Corp., SIXT SE, Volkswagen AG and Zoomcar India Pvt. Ltd.

Market Research Insights

  • Market dynamics are shaped by the tension between the financial benefits of leasing and the rise of alternative mobility. The clear advantages of capital expenditure avoidance and outsourced fleet administration drive strong adoption in the corporate sector, where telematics for fleet efficiency can reduce fuel costs by up to 15%.
  • However, the increasing availability of on-demand services challenges the traditional lease model's rigidity. Providers are responding by enhancing lease contract flexibility and introducing all-inclusive car subscription services.
  • The transition to sustainable mobility solutions is another key dynamic, with EV leasing adoption rates growing over 30% year-over-year in some regions, fueled by financial incentives and the desire to mitigate the residual value risk in leasing new technologies.

We can help! Our analysts can customize this car leasing market research report to meet your requirements.

Get in touch

1. Executive Summary

1.1 Market overview

Executive Summary - Chart on Market Overview
Executive Summary - Data Table on Market Overview
Executive Summary - Chart on Global Market Characteristics
Executive Summary - Chart on Market by Geography
Executive Summary - Chart on Market Segmentation by End-user
Executive Summary - Chart on Market Segmentation by Type
Executive Summary - Chart on Market Segmentation by Vehicle Type
Executive Summary - Chart on Incremental Growth
Executive Summary - Data Table on Incremental Growth
Executive Summary - Chart on Company Market Positioning

2. Technavio Analysis

2.1 Analysis of price sensitivity, lifecycle, customer purchase basket, adoption rates, and purchase criteria

2.2 Criticality of inputs and Factors of differentiation

Chart on Overview on criticality of inputs and factors of differentiation

2.3 Factors of disruption

Chart on Overview on factors of disruption

2.4 Impact of drivers and challenges

Chart on Impact of drivers and challenges in 2025 and 2030

3. Market Landscape

3.1 Market ecosystem

Chart on Parent Market
Data Table on - Parent Market

3.2 Market characteristics

Chart on Market characteristics analysis

3.3 Value chain analysis

Chart on Value chain analysis

4. Market Sizing

4.1 Market definition

Data Table on Offerings of companies included in the market definition

4.2 Market segment analysis

Market segments

4.3 Market size 2025

4.4 Market outlook: Forecast for 2025-2030

Chart on Global - Market size and forecast 2025-2030 ($ million)
Data Table on Global - Market size and forecast 2025-2030 ($ million)
Chart on Global Market: Year-over-year growth 2025-2030 (%)
Data Table on Global Market: Year-over-year growth 2025-2030 (%)

5. Historic Market Size

5.1 Global Car Leasing Market 2020 - 2024

Historic Market Size - Data Table on Global Car Leasing Market 2020 - 2024 ($ million)

5.2 End-user segment analysis 2020 - 2024

Historic Market Size - End-user Segment 2020 - 2024 ($ million)

5.3 Type segment analysis 2020 - 2024

Historic Market Size - Type Segment 2020 - 2024 ($ million)

5.4 Vehicle Type segment analysis 2020 - 2024

Historic Market Size - Vehicle Type Segment 2020 - 2024 ($ million)

5.5 Geography segment analysis 2020 - 2024

Historic Market Size - Geography Segment 2020 - 2024 ($ million)

5.6 Country segment analysis 2020 - 2024

Historic Market Size - Country Segment 2020 - 2024 ($ million)

6. Qualitative Analysis

6.1 Impact of AI on global car leasing market

6.2 Impact of geopolitical conflicts on global car leasing market

7. Five Forces Analysis

7.1 Five forces summary

Five forces analysis - Comparison between 2025 and 2030

7.2 Bargaining power of buyers

Bargaining power of buyers - Impact of key factors 2025 and 2030

7.3 Bargaining power of suppliers

Bargaining power of suppliers - Impact of key factors in 2025 and 2030

7.4 Threat of new entrants

Threat of new entrants - Impact of key factors in 2025 and 2030

7.5 Threat of substitutes

Threat of substitutes - Impact of key factors in 2025 and 2030

7.6 Threat of rivalry

Threat of rivalry - Impact of key factors in 2025 and 2030

7.7 Market condition

Chart on Market condition - Five forces 2025 and 2030

8. Market Segmentation by End-user

8.1 Market segments

Chart on End-user - Market share 2025-2030 (%)
Data Table on End-user - Market share 2025-2030 (%)

8.2 Comparison by End-user

Chart on Comparison by End-user
Data Table on Comparison by End-user

8.3 Commercial - Market size and forecast 2025-2030

Chart on Commercial - Market size and forecast 2025-2030 ($ million)
Data Table on Commercial - Market size and forecast 2025-2030 ($ million)
Chart on Commercial - Year-over-year growth 2025-2030 (%)
Data Table on Commercial - Year-over-year growth 2025-2030 (%)

8.4 Non-commercial - Market size and forecast 2025-2030

Chart on Non-commercial - Market size and forecast 2025-2030 ($ million)
Data Table on Non-commercial - Market size and forecast 2025-2030 ($ million)
Chart on Non-commercial - Year-over-year growth 2025-2030 (%)
Data Table on Non-commercial - Year-over-year growth 2025-2030 (%)

8.5 Market opportunity by End-user

Market opportunity by End-user ($ million)
Data Table on Market opportunity by End-user ($ million)

9. Market Segmentation by Type

9.1 Market segments

Chart on Type - Market share 2025-2030 (%)
Data Table on Type - Market share 2025-2030 (%)

9.2 Comparison by Type

Chart on Comparison by Type
Data Table on Comparison by Type

9.3 Open-ended - Market size and forecast 2025-2030

Chart on Open-ended - Market size and forecast 2025-2030 ($ million)
Data Table on Open-ended - Market size and forecast 2025-2030 ($ million)
Chart on Open-ended - Year-over-year growth 2025-2030 (%)
Data Table on Open-ended - Year-over-year growth 2025-2030 (%)

9.4 Close ended - Market size and forecast 2025-2030

Chart on Close ended - Market size and forecast 2025-2030 ($ million)
Data Table on Close ended - Market size and forecast 2025-2030 ($ million)
Chart on Close ended - Year-over-year growth 2025-2030 (%)
Data Table on Close ended - Year-over-year growth 2025-2030 (%)

9.5 Market opportunity by Type

Market opportunity by Type ($ million)
Data Table on Market opportunity by Type ($ million)

10. Market Segmentation by Vehicle Type

10.1 Market segments

Chart on Vehicle Type - Market share 2025-2030 (%)
Data Table on Vehicle Type - Market share 2025-2030 (%)

10.2 Comparison by Vehicle Type

Chart on Comparison by Vehicle Type
Data Table on Comparison by Vehicle Type

10.3 Passenger cars - Market size and forecast 2025-2030

Chart on Passenger cars - Market size and forecast 2025-2030 ($ million)
Data Table on Passenger cars - Market size and forecast 2025-2030 ($ million)
Chart on Passenger cars - Year-over-year growth 2025-2030 (%)
Data Table on Passenger cars - Year-over-year growth 2025-2030 (%)

10.4 Commercial vehicles - Market size and forecast 2025-2030

Chart on Commercial vehicles - Market size and forecast 2025-2030 ($ million)
Data Table on Commercial vehicles - Market size and forecast 2025-2030 ($ million)
Chart on Commercial vehicles - Year-over-year growth 2025-2030 (%)
Data Table on Commercial vehicles - Year-over-year growth 2025-2030 (%)

10.5 Market opportunity by Vehicle Type

Market opportunity by Vehicle Type ($ million)
Data Table on Market opportunity by Vehicle Type ($ million)

11. Customer Landscape

11.1 Customer landscape overview

Analysis of price sensitivity, lifecycle, customer purchase basket, adoption rates, and purchase criteria

12. Geographic Landscape

12.1 Geographic segmentation

Chart on Market share by geography 2025-2030 (%)
Data Table on Market share by geography 2025-2030 (%)

12.2 Geographic comparison

Chart on Geographic comparison
Data Table on Geographic comparison

12.3 Europe - Market size and forecast 2025-2030

Chart on Europe - Market size and forecast 2025-2030 ($ million)
Data Table on Europe - Market size and forecast 2025-2030 ($ million)
Chart on Europe - Year-over-year growth 2025-2030 (%)
Data Table on Europe - Year-over-year growth 2025-2030 (%)
Chart on Regional Comparison - Europe
Data Table on Regional Comparison - Europe

12.3.1 Germany - Market size and forecast 2025-2030

Chart on Germany - Market size and forecast 2025-2030 ($ million)
Data Table on Germany - Market size and forecast 2025-2030 ($ million)
Chart on Germany - Year-over-year growth 2025-2030 (%)
Data Table on Germany - Year-over-year growth 2025-2030 (%)

12.3.2 UK - Market size and forecast 2025-2030

Chart on UK - Market size and forecast 2025-2030 ($ million)
Data Table on UK - Market size and forecast 2025-2030 ($ million)
Chart on UK - Year-over-year growth 2025-2030 (%)
Data Table on UK - Year-over-year growth 2025-2030 (%)

12.3.3 France - Market size and forecast 2025-2030

Chart on France - Market size and forecast 2025-2030 ($ million)
Data Table on France - Market size and forecast 2025-2030 ($ million)
Chart on France - Year-over-year growth 2025-2030 (%)
Data Table on France - Year-over-year growth 2025-2030 (%)

12.3.4 Italy - Market size and forecast 2025-2030

Chart on Italy - Market size and forecast 2025-2030 ($ million)
Data Table on Italy - Market size and forecast 2025-2030 ($ million)
Chart on Italy - Year-over-year growth 2025-2030 (%)
Data Table on Italy - Year-over-year growth 2025-2030 (%)

12.3.5 Spain - Market size and forecast 2025-2030

Chart on Spain - Market size and forecast 2025-2030 ($ million)
Data Table on Spain - Market size and forecast 2025-2030 ($ million)
Chart on Spain - Year-over-year growth 2025-2030 (%)
Data Table on Spain - Year-over-year growth 2025-2030 (%)

12.3.6 The Netherlands - Market size and forecast 2025-2030

Chart on The Netherlands - Market size and forecast 2025-2030 ($ million)
Data Table on The Netherlands - Market size and forecast 2025-2030 ($ million)
Chart on The Netherlands - Year-over-year growth 2025-2030 (%)
Data Table on The Netherlands - Year-over-year growth 2025-2030 (%)

12.4 North America - Market size and forecast 2025-2030

Chart on North America - Market size and forecast 2025-2030 ($ million)
Data Table on North America - Market size and forecast 2025-2030 ($ million)
Chart on North America - Year-over-year growth 2025-2030 (%)
Data Table on North America - Year-over-year growth 2025-2030 (%)
Chart on Regional Comparison - North America
Data Table on Regional Comparison - North America

12.4.1 US - Market size and forecast 2025-2030

Chart on US - Market size and forecast 2025-2030 ($ million)
Data Table on US - Market size and forecast 2025-2030 ($ million)
Chart on US - Year-over-year growth 2025-2030 (%)
Data Table on US - Year-over-year growth 2025-2030 (%)

12.4.2 Canada - Market size and forecast 2025-2030

Chart on Canada - Market size and forecast 2025-2030 ($ million)
Data Table on Canada - Market size and forecast 2025-2030 ($ million)
Chart on Canada - Year-over-year growth 2025-2030 (%)
Data Table on Canada - Year-over-year growth 2025-2030 (%)

12.4.3 Mexico - Market size and forecast 2025-2030

Chart on Mexico - Market size and forecast 2025-2030 ($ million)
Data Table on Mexico - Market size and forecast 2025-2030 ($ million)
Chart on Mexico - Year-over-year growth 2025-2030 (%)
Data Table on Mexico - Year-over-year growth 2025-2030 (%)

12.5 APAC - Market size and forecast 2025-2030

Chart on APAC - Market size and forecast 2025-2030 ($ million)
Data Table on APAC - Market size and forecast 2025-2030 ($ million)
Chart on APAC - Year-over-year growth 2025-2030 (%)
Data Table on APAC - Year-over-year growth 2025-2030 (%)
Chart on Regional Comparison - APAC
Data Table on Regional Comparison - APAC

12.5.1 China - Market size and forecast 2025-2030

Chart on China - Market size and forecast 2025-2030 ($ million)
Data Table on China - Market size and forecast 2025-2030 ($ million)
Chart on China - Year-over-year growth 2025-2030 (%)
Data Table on China - Year-over-year growth 2025-2030 (%)

12.5.2 Japan - Market size and forecast 2025-2030

Chart on Japan - Market size and forecast 2025-2030 ($ million)
Data Table on Japan - Market size and forecast 2025-2030 ($ million)
Chart on Japan - Year-over-year growth 2025-2030 (%)
Data Table on Japan - Year-over-year growth 2025-2030 (%)

12.5.3 India - Market size and forecast 2025-2030

Chart on India - Market size and forecast 2025-2030 ($ million)
Data Table on India - Market size and forecast 2025-2030 ($ million)
Chart on India - Year-over-year growth 2025-2030 (%)
Data Table on India - Year-over-year growth 2025-2030 (%)

12.5.4 Australia - Market size and forecast 2025-2030

Chart on Australia - Market size and forecast 2025-2030 ($ million)
Data Table on Australia - Market size and forecast 2025-2030 ($ million)
Chart on Australia - Year-over-year growth 2025-2030 (%)
Data Table on Australia - Year-over-year growth 2025-2030 (%)

12.5.5 South Korea - Market size and forecast 2025-2030

Chart on South Korea - Market size and forecast 2025-2030 ($ million)
Data Table on South Korea - Market size and forecast 2025-2030 ($ million)
Chart on South Korea - Year-over-year growth 2025-2030 (%)
Data Table on South Korea - Year-over-year growth 2025-2030 (%)

12.5.6 Indonesia - Market size and forecast 2025-2030

Chart on Indonesia - Market size and forecast 2025-2030 ($ million)
Data Table on Indonesia - Market size and forecast 2025-2030 ($ million)
Chart on Indonesia - Year-over-year growth 2025-2030 (%)
Data Table on Indonesia - Year-over-year growth 2025-2030 (%)

12.6 South America - Market size and forecast 2025-2030

Chart on South America - Market size and forecast 2025-2030 ($ million)
Data Table on South America - Market size and forecast 2025-2030 ($ million)
Chart on South America - Year-over-year growth 2025-2030 (%)
Data Table on South America - Year-over-year growth 2025-2030 (%)
Chart on Regional Comparison - South America
Data Table on Regional Comparison - South America

12.6.1 Brazil - Market size and forecast 2025-2030

Chart on Brazil - Market size and forecast 2025-2030 ($ million)
Data Table on Brazil - Market size and forecast 2025-2030 ($ million)
Chart on Brazil - Year-over-year growth 2025-2030 (%)
Data Table on Brazil - Year-over-year growth 2025-2030 (%)

12.6.2 Argentina - Market size and forecast 2025-2030

Chart on Argentina - Market size and forecast 2025-2030 ($ million)
Data Table on Argentina - Market size and forecast 2025-2030 ($ million)
Chart on Argentina - Year-over-year growth 2025-2030 (%)
Data Table on Argentina - Year-over-year growth 2025-2030 (%)

12.6.3 Colombia - Market size and forecast 2025-2030

Chart on Colombia - Market size and forecast 2025-2030 ($ million)
Data Table on Colombia - Market size and forecast 2025-2030 ($ million)
Chart on Colombia - Year-over-year growth 2025-2030 (%)
Data Table on Colombia - Year-over-year growth 2025-2030 (%)

12.7 Middle East and Africa - Market size and forecast 2025-2030

Chart on Middle East and Africa - Market size and forecast 2025-2030 ($ million)
Data Table on Middle East and Africa - Market size and forecast 2025-2030 ($ million)
Chart on Middle East and Africa - Year-over-year growth 2025-2030 (%)
Data Table on Middle East and Africa - Year-over-year growth 2025-2030 (%)
Chart on Regional Comparison - Middle East and Africa
Data Table on Regional Comparison - Middle East and Africa

12.7.1 UAE - Market size and forecast 2025-2030

Chart on UAE - Market size and forecast 2025-2030 ($ million)
Data Table on UAE - Market size and forecast 2025-2030 ($ million)
Chart on UAE - Year-over-year growth 2025-2030 (%)
Data Table on UAE - Year-over-year growth 2025-2030 (%)

12.7.2 Saudi Arabia - Market size and forecast 2025-2030

Chart on Saudi Arabia - Market size and forecast 2025-2030 ($ million)
Data Table on Saudi Arabia - Market size and forecast 2025-2030 ($ million)
Chart on Saudi Arabia - Year-over-year growth 2025-2030 (%)
Data Table on Saudi Arabia - Year-over-year growth 2025-2030 (%)

12.7.3 South Africa - Market size and forecast 2025-2030

Chart on South Africa - Market size and forecast 2025-2030 ($ million)
Data Table on South Africa - Market size and forecast 2025-2030 ($ million)
Chart on South Africa - Year-over-year growth 2025-2030 (%)
Data Table on South Africa - Year-over-year growth 2025-2030 (%)

12.7.4 Israel - Market size and forecast 2025-2030

Chart on Israel - Market size and forecast 2025-2030 ($ million)
Data Table on Israel - Market size and forecast 2025-2030 ($ million)
Chart on Israel - Year-over-year growth 2025-2030 (%)
Data Table on Israel - Year-over-year growth 2025-2030 (%)

12.7.5 Turkey - Market size and forecast 2025-2030

Chart on Turkey - Market size and forecast 2025-2030 ($ million)
Data Table on Turkey - Market size and forecast 2025-2030 ($ million)
Chart on Turkey - Year-over-year growth 2025-2030 (%)
Data Table on Turkey - Year-over-year growth 2025-2030 (%)

12.8 Market opportunity by geography

Market opportunity by geography ($ million)
Data Tables on Market opportunity by geography ($ million)

13. Drivers, Challenges, and Opportunity

13.1 Market drivers

Paradigm shift from vehicle ownership to usership
Rising demand for corporate fleet management and operational efficiency
Accelerated vehicle electrification and technological integration

13.2 Market challenges

Intensifying competition from evolving mobility paradigms
Navigating regulatory complexity and managing residual value volatility
Fulfilling imperatives of digital transformation and elevated customer expectations

13.3 Impact of drivers and challenges

Impact of drivers and challenges in 2025 and 2030

13.4 Market opportunities

Emergence of flexible leasing and vehicle subscription services
Digital transformation of leasing lifecycle
Ascendancy of sustainable mobility and electric vehicle leasing

14. Competitive Landscape

14.1 Overview

14.2

Overview on criticality of inputs and factors of differentiation

14.3 Landscape disruption

Overview on factors of disruption

14.4 Industry risks

Impact of key risks on business

15. Competitive Analysis

15.1 Companies profiled

Companies covered

15.2 Company ranking index

15.3 Market positioning of companies

Matrix on companies position and classification

15.4 Autoflex Group LLC

Autoflex Group LLC - Overview
Autoflex Group LLC - Product / Service
Autoflex Group LLC - Key offerings
SWOT

15.5 Avis Budget Group Inc.

Avis Budget Group Inc. - Overview
Avis Budget Group Inc. - Business segments
Avis Budget Group Inc. - Key offerings
Avis Budget Group Inc. - Segment focus
SWOT

15.6 Ayvens Group

Ayvens Group - Overview
Ayvens Group - Product / Service
Ayvens Group - Key offerings
SWOT

15.7 Bayerische Motoren Werke AG

Bayerische Motoren Werke AG - Overview
Bayerische Motoren Werke AG - Business segments
Bayerische Motoren Werke AG - Key offerings
Bayerische Motoren Werke AG - Segment focus
SWOT

15.8 BNP Paribas SA

BNP Paribas SA - Overview
BNP Paribas SA - Business segments
BNP Paribas SA - Key news
BNP Paribas SA - Key offerings
BNP Paribas SA - Segment focus
SWOT

15.9 Deutsche Leasing AG

Deutsche Leasing AG - Overview
Deutsche Leasing AG - Product / Service
Deutsche Leasing AG - Key offerings
SWOT

15.10 Dr. Ing. h.c. F. Porsche AG

Dr. Ing. h.c. F. Porsche AG - Overview
Dr. Ing. h.c. F. Porsche AG - Business segments
Dr. Ing. h.c. F. Porsche AG - Key offerings
Dr. Ing. h.c. F. Porsche AG - Segment focus
SWOT

15.11 Enterprise Holdings Inc.

Enterprise Holdings Inc. - Overview
Enterprise Holdings Inc. - Product / Service
Enterprise Holdings Inc. - Key offerings
SWOT

15.12 ExpatRide International Inc.

ExpatRide International Inc. - Overview
ExpatRide International Inc. - Product / Service
ExpatRide International Inc. - Key offerings
SWOT

15.13 Hertz Global Holdings Inc.

Hertz Global Holdings Inc. - Overview
Hertz Global Holdings Inc. - Business segments
Hertz Global Holdings Inc. - Key news
Hertz Global Holdings Inc. - Key offerings
Hertz Global Holdings Inc. - Segment focus
SWOT

15.14 International Car Lease Holding

International Car Lease Holding - Overview
International Car Lease Holding - Product / Service
International Car Lease Holding - Key offerings
SWOT

15.15 Masterlease Group

Masterlease Group - Overview
Masterlease Group - Product / Service
Masterlease Group - Key offerings
SWOT

15.16 Mazda Motor Corp.

Mazda Motor Corp. - Overview
Mazda Motor Corp. - Business segments
Mazda Motor Corp. - Key offerings
Mazda Motor Corp. - Segment focus
SWOT

15.17 Mercedes Benz Group AG

Mercedes Benz Group AG - Overview
Mercedes Benz Group AG - Product / Service
Mercedes Benz Group AG - Key offerings
SWOT

15.18 SIXT SE

SIXT SE - Overview
SIXT SE - Business segments
SIXT SE - Key news
SIXT SE - Key offerings
SIXT SE - Segment focus
SWOT

16. Appendix

16.1 Scope of the report

Market definition
Objectives
Notes and caveats

16.2 Inclusions and exclusions checklist

Inclusions checklist
Exclusions checklist

16.3 Currency conversion rates for US$

16.4 Research methodology

16.5 Data procurement

Information sources

16.6 Data validation

16.7 Validation techniques employed for market sizing

16.8 Data synthesis

16.9 360 degree market analysis

16.10 List of abbreviations

Research Methodology

Technavio presents a detailed picture of the market by way of study, synthesis, and summation of data from multiple sources. The analysts have presented the various facets of the market with a particular focus on identifying the key industry influencers. The data thus presented is comprehensive, reliable, and the result of extensive research, both primary and secondary.

INFORMATION SOURCES

Primary sources

  • Manufacturers and suppliers
  • Channel partners
  • Industry experts
  • Strategic decision makers

Secondary sources

  • Industry journals and periodicals
  • Government data
  • Financial reports of key industry players
  • Historical data
  • Press releases

DATA ANALYSIS

Data Synthesis

  • Collation of data
  • Estimation of key figures
  • Analysis of derived insights

Data Validation

  • Triangulation with data models
  • Reference against proprietary databases
  • Corroboration with industry experts

REPORT WRITING

Qualitative

  • Market drivers
  • Market challenges
  • Market trends
  • Five forces analysis

Quantitative

  • Market size and forecast
  • Market segmentation
  • Geographical insights
  • Competitive landscape

Interested in this report?

Get your sample now to see our research methodology and insights!

Download Now

Frequently Asked Questions

Car Leasing market growth will increase by USD 59748.9 million during 2026-2030.

The Car Leasing market is expected to grow at a CAGR of 8.7% during 2026-2030.

Car Leasing market is segmented by End-user (Commercial, Non-commercial) Type (Open-ended, Close ended) Vehicle type (Passenger cars, Commercial vehicles)

Autoflex Group LLC, Avis Budget Group Inc., Ayvens Group, Bayerische Motoren Werke AG, BNP Paribas SA, Caldwell Leasing, Deutsche Leasing AG, Dr. Ing. h.c. F. Porsche AG, Enterprise Holdings Inc., Executive Car Leasing Co., ExpatRide International Inc., Hertz Global Holdings Inc., International Car Lease Holding, Masterlease Group, Mazda Motor Corp., Mercedes Benz Group AG, Orix Corp., SIXT SE, Volkswagen AG, Zoomcar India Pvt. Ltd. are a few of the key vendors in the Car Leasing market.

Europe will register the highest growth rate of 35.5% among the other regions. Therefore, the Car Leasing market in Europe is expected to garner significant business opportunities for the vendors during the forecast period.

Germany, UK, France, Italy, Spain, The Netherlands, US, Canada, Mexico, China, Japan, India, Australia, South Korea, Indonesia, Brazil, Argentina, Colombia, UAE, Saudi Arabia, South Africa, Israel, Turkey

  • Paradigm shift from vehicle ownership to usership is the driving factor this market.

The Car Leasing market vendors should focus on grabbing business opportunities from the End-user segment as it accounted for the largest market share in the base year.
RIA - Research AI Assistant
Ask RIA