3D Dental Scanners Market Analysis North America, Europe, Asia, Rest of World (ROW) - US, Germany, UK, China, Japan - Size and Forecast 2024-2028

3D Dental Scanners Market Analysis North America, Europe, Asia, Rest of World (ROW) - US, Germany, UK, China, Japan - Size and Forecast 2024-2028

Published: Oct 2023 166 Pages SKU: IRTNTR40808

Market Overview at a Glance

$999.51 Mn
Market Opportunity
13.19%
CAGR
11.44
YoY growth 2023-2024(%)

3D Dental Scanners Market Size 2024-2028

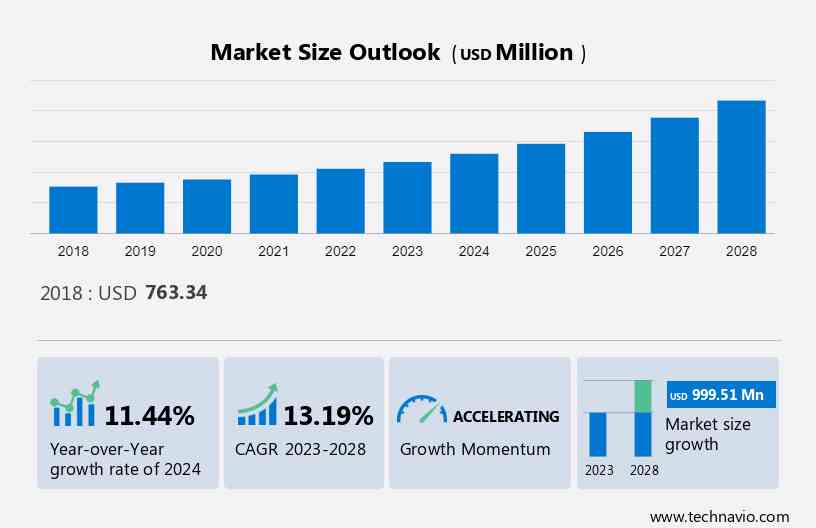
The  3D Dental Scanners Market size is estimated to grow by USD 999.51 million at a CAGR of 13.19% between 2023 and 2028.  There is an increasing adoption of these products by dentists due to factors such as the rapidly dropping prices of dental scanners, as well as the increasing availability of low-cost quality dental scanners. In addition, the added benefit of decreasing time consumption for one patient diagnosis and treatment broadens their spectrum of reach to more patients, thus increasing their profit. Moreover, there is an increasing focus by companies on developing affordable dental scanners. For example, Dental Wings uses a biocompatible finish for the wand that aids in reducing the manufacturing cost. Hence, such factors are positively impacting the market. It also includes an in-depth analysis of drivers, trends, and challenges. Our report examines historic data from 2018 to 2022, besides analyzing the current market scenario.

What will be the Size of the Market During the Forecast Period?

3D Dental Scanners Market Size

To learn more about this report, Request Free Sample

Market Segmentation

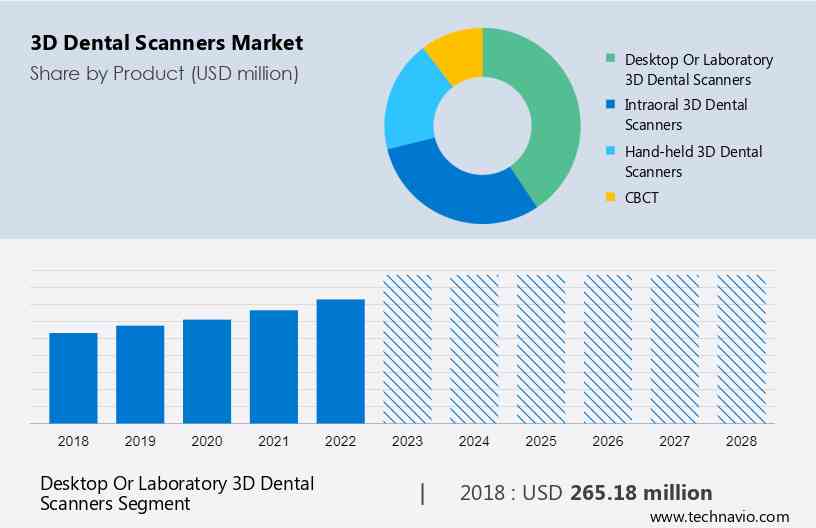
This report extensively covers market segmentation by product (desktop or laboratory 3D dental scanners, intraoral 3D dental scanners, hand-held 3D dental scanners, and CBCT), type (3D dental light scanners and 3D dental laser scanners), and geography (North America, Europe, Asia, and Rest of World (ROW)).

By Product 

The desktop or laboratory 3D dental scanners segment is estimated to witness significant growth during the forecast period. The desktop or laboratory 3D dental segment is commonly purchased bundled with Computer-Aided Design/Computer-Aided Manufacturing (CAD/CAM) software. In addition, a dentist needs to check whether the scanner and its software are compatible with the milling and 3D printer before the purchase. This segment is mostly used to scan outside the mouth.

3D Dental Scanners Market Size

Get a glance at the market contribution of various segments View a PDF Sample

The desktop or laboratory 3D dental scanners segment was the largest segment and was valued at USD 265.18 million in 2018. Moreover, these scanners use light, cameras, and rotating platforms to scan dental structures for cases related to orthodontics, implants, and restorations. In addition, a few scanners offer automated scanning for individual dies, while others scan the entire model at once. 3D desktop or laboratory dental scanners can improve the productivity of dentists by 40% to 80%. For example, the D2000 lab scanner, by 3Shape, lets the dentist capture upper, lower, and bite impressions in a single scan. It captures the textures and colors of the original teeth for a real-time design experience. Hence, such factors are expected to fuel the growth of this segment which in turn will drive the market growth during the forecast period.

By Type 

3D dental light scanners

A 3D dental light scanner is essentially used to measure the shape of a tooth by using projected light patterns and a camera system. It typically comprises a projector and two cameras. In addition, there are two types of 3D dental light scanners available in the market: White light scanners offer reliable data about dental structure by recording, measuring, and translating photographic images. Moreover, an organized light can catch a dense point cloud compared with regular laser scanners. Furthermore, organized light scans can be accurate and to the point and, therefore, are chosen when a close, correct virtual model is required. In addition, white light scanners are apt for scanning components such as metal parts, tools and dies, molded/cast parts, and intricate prototypes. Hence, such factors are expected to fuel the growth of this segment which in turn will drive the market growth during the forecast period.

3D dental laser

3D dental laser scanners enable dentists or technicians to find the dental structure with ease and accuracy. In addition, the scanner needs to be put inside the mouth, and shine a laser beam around the mouth. Thus, the reflections as a result of shining the laser beam get calculated and stored as a point on the computer. Moreover, 3D dental laser scanners capture clear and accurate dental impressions within minutes without the requirement for customary impression materials. Several manufacturers require CAD since assembling procedures during product development are mechanized and automated. Furthermore, the laser technology in 3D dental scanners is revolutionary. The main advantage of these scanners is they make a digital copy of the scan, which can be stored and referred to whenever needed. Hence, such factors are expected to fuel the growth of this segment which in turn will drive the market growth during the forecast period.

By Region

3D Dental Scanners Market Share by Geography

For more insights about the market share of various regions View PDF Sample now!

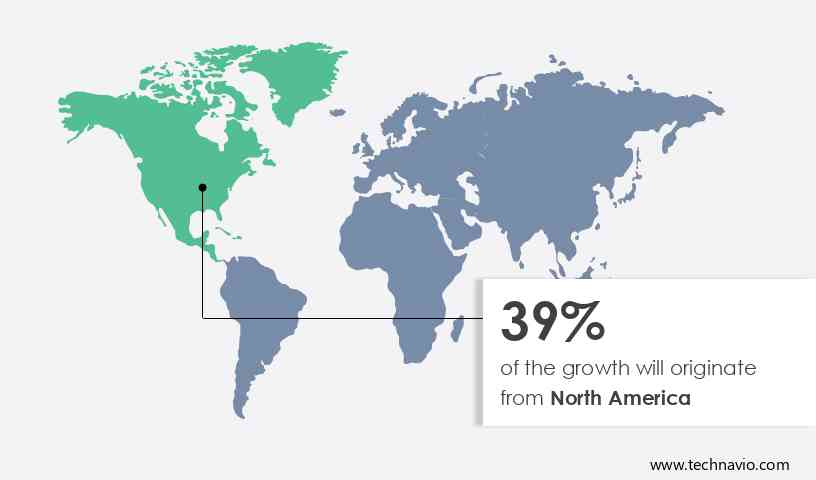
North America is estimated to contribute 39% to the growth of the global market during the forecast period. Technavio’s analysts have elaborately explained the regional trends and drivers that will shape the market during the forecast period. Factors such as the increasing prevalence of edentulism, dental cavities, and periodontal diseases due to poor eating habits in adults and children are significantly contributing to the market growth in North America. In addition, the increasing number of visits indicates the need for the management of dental disorders, which facilitates the growth of the regional market. Moreover, several dental conditions such as edentulism or tooth lessness are prominent in the population aged above 60 years. As a result, it presents significant opportunities for revenue generation from dental implants in the region. Hence, such factors are driving the market growth in North America during the forecast period.

Buy Now Full Report and Discover More

Key Market Players 

Companies are implementing various strategies, such as strategic alliances, partnerships, mergers and acquisitions, geographical expansion, and product/service launches, to enhance their presence in the market. The report also includes detailed analyses of the competitive landscape of the market and information about 20 market companies, including:

3M Co: The company offers a 3D dental scanner namely 3M Mobile True Definition scanner for taking dental impressions for crowns and bridges.

  • 3M Co.
  • 3Shape AS
  • AGE Solutions Srl
  • Align Technology Inc.
  • Amann Girrbach AG
  • Aniwaa Pte. Ltd.
  • Carestream Dental LLC
  • Condor Technologies NV
  • densys Ltd.
  • Dentsply Sirona Inc.
  • GC Corp.
  • Hexagon AB
  • imes icore GmbH
  • Institut Straumann AG
  • KaVo Dental GmbH
  • Medit Corp.
  • Midmark Corp.
  • Planmeca Oy
  • Roland DG Corp.
  • Shining 3D Tech Co. Ltd.

Qualitative and quantitative analysis of companies has been conducted to help clients understand the wider business environment as well as the strengths and weaknesses of key market players. Data is qualitatively analyzed to categorize companies as pure play, category-focused, industry-focused, and diversified; it is quantitatively analyzed to categorize companies as dominant, leading, strong, tentative, and weak.

Market Dynamics and Customer Landscape

The market is revolutionizing dental care with its ability to create three-dimensional (3D) images of the jaw and other human body parts using structured light or optical/laser triangulation. These scanners provide digital representations that enhance dental applications such as digital impressions, dental restorations, and orthodontic treatments. They also play a crucial role in oral and maxillofacial surgery by improving efficiency compared to traditional methods. With high camera resolution, they are able to capture intricate details of bones and orthotics, aiding in the diagnosis and treatment of oral diseases like dental caries and plaque caused by free sugars in foods and drinks. Our researchers analyzed the data with 2023 as the base year, along with the key drivers, trends, and challenges. 

Key Market Drivers

One of the key factors driving the market growth is the increase in accuracy, speed, and productivity with advanced procedures. There has been rapid development in the digital ecosystem due to increasing digitization. In addition, the advances in technology and innovative materials have been impacting the dental industry with more durable and highly aesthetic prosthetics. There is a shift among dentists/clinicians, laboratory technicians, and patients among digital processes which enables more accurate/precise restorative outcomes and highly effective patient treatment.

Moreover, they help in capturing important minute details, thus making the diagnosis and treatment faster as well as more accurate. In addition, these devices have made the process of dentistry simple and seamless. Furthermore, the scanners enable dentists to integrate the scanned images with the patient's electronic health records, allowing easy access to data from any place in the world. Hence, such factors are expected to drive market growth during the forecast period.

Significant Market Trends

A key factor shaping the market growth is the constant technological advances. The advancements in dental care have enhanced outcomes for conventional oral therapeutic care issues.  In addition, various dental equipment and devices have been developed to make dental procedures more comfortable for patients and very handy for professionals.

Moreover, the rising urban population worldwide is driving the demand for restorative, cosmetic dentistry, and procedures. In addition, digital dentistry extensively reduces the turnaround time for preparing dental implants. Furthermore, automation in dental laboratories has decreased expenditure significantly. Hence, such factors are positively impacting the market. Therefore, it is expected to drive the market growth during the forecast period.

Major Market Challenges

High initial capital investment and excessive cost of dental diagnostic procedures are some of the key challenges hindering market growth. The innovation and technology in dentistry allow patients to have effective treatment. In addition, it comprises any dental procedure that improves the appearance of individual teeth, gums, or any problem related to the oral cavity, including supporting structures

However, the price is relatively expensive. In addition, the cost of treatment can become more expensive depending on the required treatment, the 3D dental scanning involved, and the nature of the procedure. Moreover, dental insurance does not cover most of the diagnostic dental procedures. Hence, such factors are negatively impacting the market. Therefore, it is expected to hinder the market growth during the forecast period.

Buy Now Full Report and Discover More

Key Market Customer Landscape

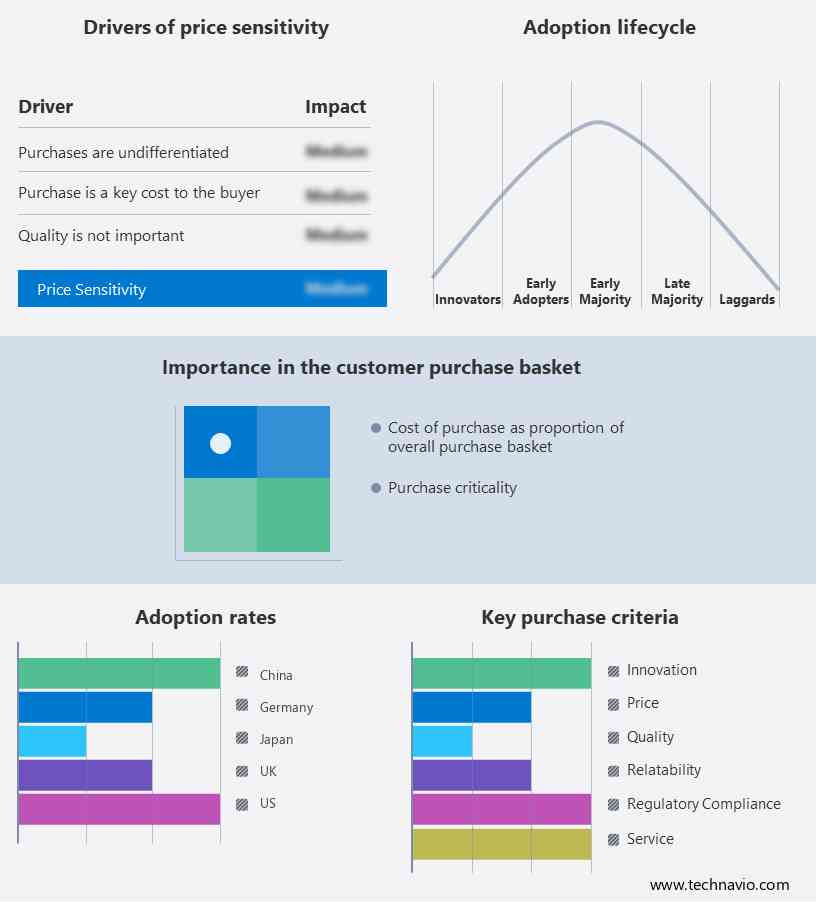
The market report includes the adoption lifecycle of the market, covering from the innovator’s stage to the laggard’s stage. It focuses on adoption rates in different regions based on penetration. Furthermore, the report also includes key purchase criteria and drivers of price sensitivity to help companies evaluate and develop their growth strategies.

3D Dental Scanners Market Share by Geography

Global Market Customer Landscape

Segment Overview

The market research report provides comprehensive data (region wise segment analysis), with forecasts and estimates in "USD Billion" for the period 2024 to 2028, as well as historical data from 2018 to 2023 for the following segments 

  • Product Outlook 
    • Desktop or laboratory 3D dental scanners
    • Intraoral 3D dental scanners
    • Hand-held 3D dental scanner
    • CBCT
  • Type Outlook 
    • 3D dental light scanners
    • 3D dental laser scanners
  • Geography Outlook (USD Million, 2018 - 2028)
    • North America
      • The U.S.
      • Canada
    • Europe
      • The U.K.
      • Germany
      • France
      • Rest of Europe
    • Asia
      • China
      • India
    • Rest of the World (ROW)
      • Australia
      • Argentina
      • Brazil

Market Analyst Overview

The market is pivotal in modern dental care, offering dental 3D scanners that provide detailed three-dimensional (3D) images of oral structures using optical or laser triangulation technology. These scanners create precise digital representations used in various 3D scanning applications such as orthodontic treatment planning and dental implant placement. They play a crucial role in reducing the health burden caused by factors like acids from food, tooth decay, and unhealthy lifestyles including tobacco and alcohol use. The market caters to dental practices in hospitals and clinics, empowering medical professionals with desktop scanners and advanced dental scanning machines for improved treatment outcomes. The rise in the geriatric population with significant spending power underscores the need for skilled dental personnel trained in using CAD/CAM technologies for optimal dental health. The market offers advanced technology for creating detailed three-dimensional (3D) images and digital representations of oral structures. These scanners find applications in dental clinics and hospitals, providing clinical feedback to medical professionals. They play a crucial role in addressing issues like missing teeth and the prevalence of oral diseases, influenced by factors such as food habits.

Market Scope

Report Coverage

Details

Page number

166

Base year

2023

Historic period

2018-2022

Forecast period

2024-2028

Growth momentum & CAGR

Accelerate at a CAGR of 13.19%

Market growth 2024-2028

USD 999.51 million

Market structure

Fragmented

YoY growth 2023-2024(%)

11.44

Regional analysis

North America, Europe, Asia, and the Rest of the World (ROW)

Performing market contribution

North America at 39%

Key countries

US, Germany, UK, China, and Japan

Competitive landscape

Leading companies, Market Positioning of companies, Competitive Strategies, and Industry Risks

Key companies profiled

3M Co., 3Shape AS, AGE Solutions Srl, Align Technology Inc., Amann Girrbach AG, Aniwaa Pte. Ltd., Carestream Dental LLC, Condor Technologies NV, densys Ltd., Dentsply Sirona Inc., GC Corp., Hexagon AB, imes icore GmbH, Institut Straumann AG, KaVo Dental GmbH, Medit Corp., Midmark Corp., Planmeca Oy, Roland DG Corp., and Shining 3D Tech Co. Ltd.

Market dynamics

Parent market analysis, Market Forecasting, Market growth inducers and obstacles, Fast-growing and slow-growing segment analysis, COVID-19 impact and recovery analysis and future consumer dynamics, and Market condition analysis for the market forecast period.

Customization purview

If our report has not included the data that you are looking for, you can reach out to our analysts and get segments customized.

View Sample PDF at your Fingertips

What are the Key Data Covered in this Market Report?

  • CAGR of the market during the forecast period
  • Detailed information on factors that will drive the market growth and forecasting of the market between 2023 and 2027
  • Precise estimation of the size of the market size and its contribution to the parent market
  • Accurate predictions about upcoming market trends and analysis and changes in consumer behavior
  • Growth of the market industry across Europe, North America, APAC, South America, and Middle East and Africa
  • Thorough market growth analysis of the market’s competitive landscape and detailed information about companies
  • Comprehensive market analysis and report on the factors that will challenge the market research and growth of market companies

We can help! Our analysts can customize this market research report to meet your requirements. Get in touch

1 Executive Summary

  • 1.1 Market overview
    • Exhibit 01: Executive Summary – Chart on Market Overview
    • Exhibit 02: Executive Summary – Data Table on Market Overview
    • Exhibit 03: Executive Summary – Chart on Global Market Characteristics
    • Exhibit 04: Executive Summary – Chart on Market by Geography
    • Exhibit 05: Executive Summary – Chart on Market Segmentation by Product
    • Exhibit 06: Executive Summary – Chart on Market Segmentation by Type
    • Exhibit 07: Executive Summary – Chart on Incremental Growth
    • Exhibit 08: Executive Summary – Data Table on Incremental Growth
    • Exhibit 09: Executive Summary – Chart on Vendor Market Positioning

2 Market Landscape

  • 2.1 Market ecosystem
    • Exhibit 10: Parent market
    • Exhibit 11: Market Characteristics

3 Market Sizing

  • 3.1 Market definition
    • Exhibit 12: Offerings of vendors included in the market definition
  • 3.2 Market segment analysis
    • Exhibit 13: Market segments
  • 3.3 Market size 2023
    • 3.4 Market outlook: Forecast for 2023-2028
      • Exhibit 14: Chart on Global - Market size and forecast 2023-2028 ($ million)
      • Exhibit 15: Data Table on Global - Market size and forecast 2023-2028 ($ million)
      • Exhibit 16: Chart on Global Market: Year-over-year growth 2023-2028 (%)
      • Exhibit 17: Data Table on Global Market: Year-over-year growth 2023-2028 (%)

    4 Historic Market Size

    • 4.1 Global 3D dental scanners market 2018 - 2022
      • Exhibit 18: Historic Market Size – Data Table on global 3d dental scanners market 2018 - 2022 ($ million)
    • 4.2 Product Segment Analysis 2018 - 2022
      • Exhibit 19: Historic Market Size – Product Segment 2018 - 2022 ($ million)
    • 4.3 Type Segment Analysis 2018 - 2022
      • Exhibit 20: Historic Market Size – Type Segment 2018 - 2022 ($ million)
    • 4.4 Geography Segment Analysis 2018 - 2022
      • Exhibit 21: Historic Market Size – Geography Segment 2018 - 2022 ($ million)
    • 4.5 Country Segment Analysis 2018 - 2022
      • Exhibit 22: Historic Market Size – Country Segment 2018 - 2022 ($ million)

    5 Five Forces Analysis

    • 5.1 Five forces summary
      • Exhibit 23: Five forces analysis - Comparison between 2023 and 2028
    • 5.2 Bargaining power of buyers
      • Exhibit 24: Chart on Bargaining power of buyers – Impact of key factors 2023 and 2028
    • 5.3 Bargaining power of suppliers
      • Exhibit 25: Bargaining power of suppliers – Impact of key factors in 2023 and 2028
    • 5.4 Threat of new entrants
      • Exhibit 26: Threat of new entrants – Impact of key factors in 2023 and 2028
    • 5.5 Threat of substitutes
      • Exhibit 27: Threat of substitutes – Impact of key factors in 2023 and 2028
    • 5.6 Threat of rivalry
      • Exhibit 28: Threat of rivalry – Impact of key factors in 2023 and 2028
    • 5.7 Market condition
      • Exhibit 29: Chart on Market condition - Five forces 2023 and 2028

    6 Market Segmentation by Product

    • 6.1 Market segments
      • Exhibit 30: Chart on Product - Market share 2023-2028 (%)
      • Exhibit 31: Data Table on Product - Market share 2023-2028 (%)
    • 6.2 Comparison by Product
      • Exhibit 32: Chart on Comparison by Product
      • Exhibit 33: Data Table on Comparison by Product
    • 6.3 Desktop or laboratory 3D dental scanners - Market size and forecast 2023-2028
      • Exhibit 34: Chart on Desktop or laboratory 3D dental scanners - Market size and forecast 2023-2028 ($ million)
      • Exhibit 35: Data Table on Desktop or laboratory 3D dental scanners - Market size and forecast 2023-2028 ($ million)
      • Exhibit 36: Chart on Desktop or laboratory 3D dental scanners - Year-over-year growth 2023-2028 (%)
      • Exhibit 37: Data Table on Desktop or laboratory 3D dental scanners - Year-over-year growth 2023-2028 (%)
    • 6.4 Intraoral 3D dental scanners - Market size and forecast 2023-2028
      • Exhibit 38: Chart on Intraoral 3D dental scanners - Market size and forecast 2023-2028 ($ million)
      • Exhibit 39: Data Table on Intraoral 3D dental scanners - Market size and forecast 2023-2028 ($ million)
      • Exhibit 40: Chart on Intraoral 3D dental scanners - Year-over-year growth 2023-2028 (%)
      • Exhibit 41: Data Table on Intraoral 3D dental scanners - Year-over-year growth 2023-2028 (%)
    • 6.5 Hand-held 3D dental scanners - Market size and forecast 2023-2028
      • Exhibit 42: Chart on Hand-held 3D dental scanners - Market size and forecast 2023-2028 ($ million)
      • Exhibit 43: Data Table on Hand-held 3D dental scanners - Market size and forecast 2023-2028 ($ million)
      • Exhibit 44: Chart on Hand-held 3D dental scanners - Year-over-year growth 2023-2028 (%)
      • Exhibit 45: Data Table on Hand-held 3D dental scanners - Year-over-year growth 2023-2028 (%)
    • 6.6 CBCT - Market size and forecast 2023-2028
      • Exhibit 46: Chart on CBCT - Market size and forecast 2023-2028 ($ million)
      • Exhibit 47: Data Table on CBCT - Market size and forecast 2023-2028 ($ million)
      • Exhibit 48: Chart on CBCT - Year-over-year growth 2023-2028 (%)
      • Exhibit 49: Data Table on CBCT - Year-over-year growth 2023-2028 (%)
    • 6.7 Market opportunity by Product
      • Exhibit 50: Market opportunity by Product ($ million)
      • Exhibit 51: Data Table on Market opportunity by Product ($ million)

    7 Market Segmentation by Type

    • 7.1 Market segments
      • Exhibit 52: Chart on Type - Market share 2023-2028 (%)
      • Exhibit 53: Data Table on Type - Market share 2023-2028 (%)
    • 7.2 Comparison by Type
      • Exhibit 54: Chart on Comparison by Type
      • Exhibit 55: Data Table on Comparison by Type
    • 7.3 3D dental light scanners - Market size and forecast 2023-2028
      • Exhibit 56: Chart on 3D dental light scanners - Market size and forecast 2023-2028 ($ million)
      • Exhibit 57: Data Table on 3D dental light scanners - Market size and forecast 2023-2028 ($ million)
      • Exhibit 58: Chart on 3D dental light scanners - Year-over-year growth 2023-2028 (%)
      • Exhibit 59: Data Table on 3D dental light scanners - Year-over-year growth 2023-2028 (%)
    • 7.4 3D dental laser scanners - Market size and forecast 2023-2028
      • Exhibit 60: Chart on 3D dental laser scanners - Market size and forecast 2023-2028 ($ million)
      • Exhibit 61: Data Table on 3D dental laser scanners - Market size and forecast 2023-2028 ($ million)
      • Exhibit 62: Chart on 3D dental laser scanners - Year-over-year growth 2023-2028 (%)
      • Exhibit 63: Data Table on 3D dental laser scanners - Year-over-year growth 2023-2028 (%)
    • 7.5 Market opportunity by Type
      • Exhibit 64: Market opportunity by Type ($ million)
      • Exhibit 65: Data Table on Market opportunity by Type ($ million)

    8 Customer Landscape

    • 8.1 Customer landscape overview
      • Exhibit 66: Analysis of price sensitivity, lifecycle, customer purchase basket, adoption rates, and purchase criteria

    9 Geographic Landscape

    • 9.1 Geographic segmentation
      • Exhibit 67: Chart on Market share by geography 2023-2028 (%)
      • Exhibit 68: Data Table on Market share by geography 2023-2028 (%)
    • 9.2 Geographic comparison
      • Exhibit 69: Chart on Geographic comparison
      • Exhibit 70: Data Table on Geographic comparison
    • 9.3 North America - Market size and forecast 2023-2028
      • Exhibit 71: Chart on North America - Market size and forecast 2023-2028 ($ million)
      • Exhibit 72: Data Table on North America - Market size and forecast 2023-2028 ($ million)
      • Exhibit 73: Chart on North America - Year-over-year growth 2023-2028 (%)
      • Exhibit 74: Data Table on North America - Year-over-year growth 2023-2028 (%)
    • 9.4 Europe - Market size and forecast 2023-2028
      • Exhibit 75: Chart on Europe - Market size and forecast 2023-2028 ($ million)
      • Exhibit 76: Data Table on Europe - Market size and forecast 2023-2028 ($ million)
      • Exhibit 77: Chart on Europe - Year-over-year growth 2023-2028 (%)
      • Exhibit 78: Data Table on Europe - Year-over-year growth 2023-2028 (%)
    • 9.5 Asia - Market size and forecast 2023-2028
      • Exhibit 79: Chart on Asia - Market size and forecast 2023-2028 ($ million)
      • Exhibit 80: Data Table on Asia - Market size and forecast 2023-2028 ($ million)
      • Exhibit 81: Chart on Asia - Year-over-year growth 2023-2028 (%)
      • Exhibit 82: Data Table on Asia - Year-over-year growth 2023-2028 (%)
    • 9.6 Rest of World (ROW) - Market size and forecast 2023-2028
      • Exhibit 83: Chart on Rest of World (ROW) - Market size and forecast 2023-2028 ($ million)
      • Exhibit 84: Data Table on Rest of World (ROW) - Market size and forecast 2023-2028 ($ million)
      • Exhibit 85: Chart on Rest of World (ROW) - Year-over-year growth 2023-2028 (%)
      • Exhibit 86: Data Table on Rest of World (ROW) - Year-over-year growth 2023-2028 (%)
    • 9.7 US - Market size and forecast 2023-2028
      • Exhibit 87: Chart on US - Market size and forecast 2023-2028 ($ million)
      • Exhibit 88: Data Table on US - Market size and forecast 2023-2028 ($ million)
      • Exhibit 89: Chart on US - Year-over-year growth 2023-2028 (%)
      • Exhibit 90: Data Table on US - Year-over-year growth 2023-2028 (%)
    • 9.8 Germany - Market size and forecast 2023-2028
      • Exhibit 91: Chart on Germany - Market size and forecast 2023-2028 ($ million)
      • Exhibit 92: Data Table on Germany - Market size and forecast 2023-2028 ($ million)
      • Exhibit 93: Chart on Germany - Year-over-year growth 2023-2028 (%)
      • Exhibit 94: Data Table on Germany - Year-over-year growth 2023-2028 (%)
    • 9.9 UK - Market size and forecast 2023-2028
      • Exhibit 95: Chart on UK - Market size and forecast 2023-2028 ($ million)
      • Exhibit 96: Data Table on UK - Market size and forecast 2023-2028 ($ million)
      • Exhibit 97: Chart on UK - Year-over-year growth 2023-2028 (%)
      • Exhibit 98: Data Table on UK - Year-over-year growth 2023-2028 (%)
    • 9.10 China - Market size and forecast 2023-2028
      • Exhibit 99: Chart on China - Market size and forecast 2023-2028 ($ million)
      • Exhibit 100: Data Table on China - Market size and forecast 2023-2028 ($ million)
      • Exhibit 101: Chart on China - Year-over-year growth 2023-2028 (%)
      • Exhibit 102: Data Table on China - Year-over-year growth 2023-2028 (%)
    • 9.11 Japan - Market size and forecast 2023-2028
      • Exhibit 103: Chart on Japan - Market size and forecast 2023-2028 ($ million)
      • Exhibit 104: Data Table on Japan - Market size and forecast 2023-2028 ($ million)
      • Exhibit 105: Chart on Japan - Year-over-year growth 2023-2028 (%)
      • Exhibit 106: Data Table on Japan - Year-over-year growth 2023-2028 (%)
    • 9.12 Market opportunity by geography
      • Exhibit 107: Market opportunity by geography ($ million)
      • Exhibit 108: Data Tables on Market opportunity by geography ($ million)

    10 Drivers, Challenges, and Trends

    • 10.1 Market drivers
      • 10.2 Market challenges
        • 10.3 Impact of drivers and challenges
          • Exhibit 109: Impact of drivers and challenges in 2023 and 2028
        • 10.4 Market trends

          11 Vendor Landscape

          • 11.1 Overview
            • 11.2 Vendor landscape
              • Exhibit 110: Overview on Criticality of inputs and Factors of differentiation
            • 11.3 Landscape disruption
              • Exhibit 111: Overview on factors of disruption
            • 11.4 Industry risks
              • Exhibit 112: Impact of key risks on business

            12 Vendor Analysis

            • 12.1 Vendors covered
              • Exhibit 113: Vendors covered
            • 12.2 Market positioning of vendors
              • Exhibit 114: Matrix on vendor position and classification
            • 12.3 3M Co.
              • Exhibit 115: 3M Co. - Overview
              • Exhibit 116: 3M Co. - Business segments
              • Exhibit 117: 3M Co. - Key news
              • Exhibit 118: 3M Co. - Key offerings
              • Exhibit 119: 3M Co. - Segment focus
            • 12.4 3Shape AS
              • Exhibit 120: 3Shape AS - Overview
              • Exhibit 121: 3Shape AS - Product / Service
              • Exhibit 122: 3Shape AS - Key offerings
            • 12.5 AGE Solutions Srl
              • Exhibit 123: AGE Solutions Srl - Overview
              • Exhibit 124: AGE Solutions Srl - Product / Service
              • Exhibit 125: AGE Solutions Srl - Key offerings
            • 12.6 Align Technology Inc.
              • Exhibit 126: Align Technology Inc. - Overview
              • Exhibit 127: Align Technology Inc. - Business segments
              • Exhibit 128: Align Technology Inc. - Key offerings
              • Exhibit 129: Align Technology Inc. - Segment focus
            • 12.7 Amann Girrbach AG
              • Exhibit 130: Amann Girrbach AG - Overview
              • Exhibit 131: Amann Girrbach AG - Product / Service
              • Exhibit 132: Amann Girrbach AG - Key offerings
            • 12.8 Carestream Dental LLC
              • Exhibit 133: Carestream Dental LLC - Overview
              • Exhibit 134: Carestream Dental LLC - Product / Service
              • Exhibit 135: Carestream Dental LLC - Key offerings
            • 12.9 Condor Technologies NV
              • Exhibit 136: Condor Technologies NV - Overview
              • Exhibit 137: Condor Technologies NV - Product / Service
              • Exhibit 138: Condor Technologies NV - Key offerings
            • 12.10 densys Ltd.
              • Exhibit 139: densys Ltd. - Overview
              • Exhibit 140: densys Ltd. - Product / Service
              • Exhibit 141: densys Ltd. - Key offerings
            • 12.11 Dentsply Sirona Inc.
              • Exhibit 142: Dentsply Sirona Inc. - Overview
              • Exhibit 143: Dentsply Sirona Inc. - Business segments
              • Exhibit 144: Dentsply Sirona Inc. - Key news
              • Exhibit 145: Dentsply Sirona Inc. - Key offerings
              • Exhibit 146: Dentsply Sirona Inc. - Segment focus
            • 12.12 GC Corp.
              • Exhibit 147: GC Corp. - Overview
              • Exhibit 148: GC Corp. - Product / Service
              • Exhibit 149: GC Corp. - Key offerings
            • 12.13 Hexagon AB
              • Exhibit 150: Hexagon AB - Overview
              • Exhibit 151: Hexagon AB - Business segments
              • Exhibit 152: Hexagon AB - Key news
              • Exhibit 153: Hexagon AB - Key offerings
              • Exhibit 154: Hexagon AB - Segment focus
            • 12.14 Institut Straumann AG
              • Exhibit 155: Institut Straumann AG - Overview
              • Exhibit 156: Institut Straumann AG - Business segments
              • Exhibit 157: Institut Straumann AG - Key news
              • Exhibit 158: Institut Straumann AG - Key offerings
              • Exhibit 159: Institut Straumann AG - Segment focus
            • 12.15 KaVo Dental GmbH
              • Exhibit 160: KaVo Dental GmbH - Overview
              • Exhibit 161: KaVo Dental GmbH - Product / Service
              • Exhibit 162: KaVo Dental GmbH - Key offerings
            • 12.16 Medit Corp.
              • Exhibit 163: Medit Corp. - Overview
              • Exhibit 164: Medit Corp. - Product / Service
              • Exhibit 165: Medit Corp. - Key offerings
            • 12.17 Planmeca Oy
              • Exhibit 166: Planmeca Oy - Overview
              • Exhibit 167: Planmeca Oy - Product / Service
              • Exhibit 168: Planmeca Oy - Key offerings

            13 Appendix

            • 13.1 Scope of the report
              • 13.2 Inclusions and exclusions checklist
                • Exhibit 169: Inclusions checklist
                • Exhibit 170: Exclusions checklist
              • 13.3 Currency conversion rates for US$
                • Exhibit 171: Currency conversion rates for US$
              • 13.4 Research methodology
                • Exhibit 172: Research methodology
                • Exhibit 173: Validation techniques employed for market sizing
                • Exhibit 174: Information sources
              • 13.5 List of abbreviations
                • Exhibit 175: List of abbreviations

              Research Methodology

              Technavio presents a detailed picture of the market by way of study, synthesis, and summation of data from multiple sources. The analysts have presented the various facets of the market with a particular focus on identifying the key industry influencers. The data thus presented is comprehensive, reliable, and the result of extensive research, both primary and secondary.

              INFORMATION SOURCES

              Primary sources

              • Manufacturers and suppliers
              • Channel partners
              • Industry experts
              • Strategic decision makers

              Secondary sources

              • Industry journals and periodicals
              • Government data
              • Financial reports of key industry players
              • Historical data
              • Press releases

              DATA ANALYSIS

              Data Synthesis

              • Collation of data
              • Estimation of key figures
              • Analysis of derived insights

              Data Validation

              • Triangulation with data models
              • Reference against proprietary databases
              • Corroboration with industry experts

              REPORT WRITING

              Qualitative

              • Market drivers
              • Market challenges
              • Market trends
              • Five forces analysis

              Quantitative

              • Market size and forecast
              • Market segmentation
              • Geographical insights
              • Competitive landscape

              Interested in this report?

              Get your sample now to see our research methodology and insights!

              Download Now

              Frequently Asked Questions

              3D Dental Scanners market growth will increase by 999.51 million during 2024-2028 .

              The 3D Dental Scanners market is expected to grow at a CAGR of 13.19% during 2024-2028 .

              3D Dental Scanners market is segmented by Product( Desktop or laboratory 3D dental scanners, Intraoral 3D dental scanners, Hand-held 3D dental scanners, CBCT) Type( 3D dental light scanners, 3D dental laser scanners)

              3M Co., 3Shape AS, AGE Solutions Srl, Align Technology Inc., Amann Girrbach AG, Aniwaa Pte. Ltd., Carestream Dental LLC, Condor Technologies NV, densys Ltd., Dentsply Sirona Inc., GC Corp., Hexagon AB, imes icore GmbH, Institut Straumann AG, KaVo Dental GmbH, Medit Corp., Midmark Corp., Planmeca Oy, Roland DG Corp., Shining 3D Tech Co. Ltd. are a few of the key vendors in the 3D Dental Scanners market.

              North America will register the highest growth rate of 39.48% among the other regions. Therefore, the 3D Dental Scanners market in North America is expected to garner significant business opportunities for the vendors during the forecast period.

              US, Germany, UK, China, Japan

              • Increasing affordability among peopleThe rapidly dropping prices of dental scanners is the driving factor this market.
              • as well as the increasing availability of low-cost quality dental scanners is the driving factor this market.
              • are enabling dentists to adopt these products at a faster rate. Also is the driving factor this market.
              • the added benefit of decreasing time consumption for one patient diagnosis and treatment broadens their spectrum of reach to more patients is the driving factor this market.
              • thus increasing their profit. The companies are continuously focusing on developing affordable dental scanners. For instance is the driving factor this market.
              • Dental Wings uses a biocompatible finish for the wand that aids to reduce the manufacturing cost. Also is the driving factor this market.
              • with the introduction of digital impressions via 3D scanners is the driving factor this market.
              • dentists do not need to share physical impressions with the laboratory is the driving factor this market.
              • leading to cost-saving on shipping. The whole digital process provides better-fitting prosthetics in less time at significantly lower fees. At the same time is the driving factor this market.
              • the digital impression captures clear is the driving factor this market.
              • highly accurate impression data is the driving factor this market.
              • avoiding inaccuracies. This allows patients to receive a long-term is the driving factor this market.
              • stable dental solution is the driving factor this market.
              • avoiding any extra expenses is the driving factor this market.
              • as they do not have to undergo repetitive dental corrections. Such factors contribute to the growth of the global 3D scanners market during the forecast period. is the driving factor this market.

              The 3D Dental Scanners market vendors should focus on grabbing business opportunities from the Desktop or laboratory 3D dental scanners segment as it accounted for the largest market share in the base year.