3D Motion Capture System Market Analysis North America, Europe, APAC, South America, Middle East and Africa - US, Canada, China, UK, Germany - Size and Forecast 2024-2028

3D Motion Capture System Market Analysis North America, Europe, APAC, South America, Middle East and Africa - US, Canada, China, UK, Germany - Size and Forecast 2024-2028

Published: Feb 2024 165 Pages SKU: IRTNTR77379

Market Overview at a Glance

$164.74 Mn
Market Opportunity
12.86%
CAGR
8.66
YoY growth 2023-2024(%)

3D Motion Capture System Market Forecast 2024-2028 

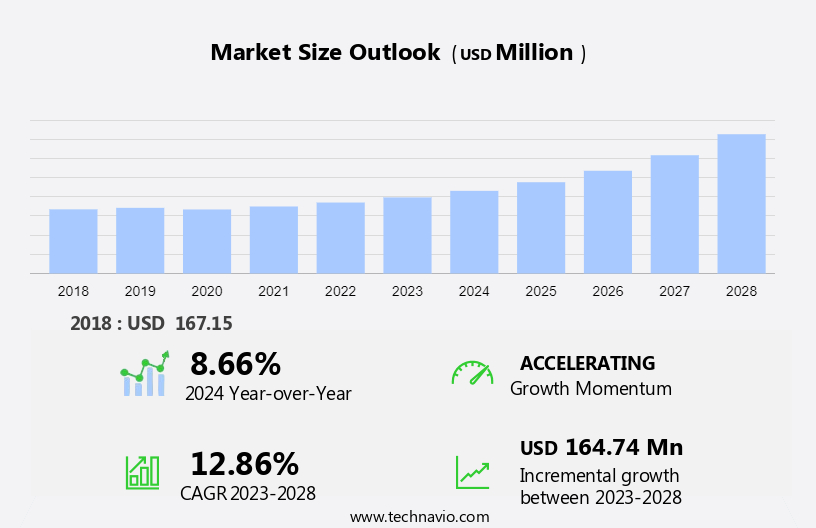
The 3D Motion Capture System Market size is forecast to increase by USD 164.74 million, at a CAGR of 12.86% between 2023 and 2028. The growth rate of the market depends on several factors, including the growing adoption technology in media and entertainment applications, the novel product launches and strategies by market players, and the increased usage of computer vision in the sports industry

The market growth and forecasting report includes key player's detailed analyses of the competitive landscape of the market and information about 20 market companies, including Carmeuse Coordination Center SA, Codamotion Ltd., DEEPMOTION INC., Leyard Group, Meta Motion, MindMaze SA, Motion Analysis Inc., Motion Workshop, Movella Inc, Noitom Ltd., Noraxon USA Inc., Notch Interfaces Inc., PhaseSpace Inc., PTI Phoenix Technologies Inc., Qualisys AB, Raptor Photonics Ltd., Rokoko Electronics ApS, Roper Technologies Inc., Scientific Analytics Inc., Sony Group Corp., Ultraleap Ltd., Vicon Motion Systems Ltd., and ZF Friedrichshafen AG . Additionally, AIQ Synertia offers  solutions that capture high quality hand motion capture quickly and easily in 3D animation, physiotherapy, sports, and Industry 4.0.

What will be the Size of the Market During the Forecast Period?

3D Motion Capture System Market Size

For More Highlights About this Report, Download Free Sample in a Minute 

Market Overview

Market Growth Analysis Driver

One of the key factors driving the market growth is the growing adoption of 3D motion capture technology in media and entertainment applications. The technology has revolutionized the way motion is captured, allowing more realistic and immersive experiences in movies, video games, and virtual reality content. In addition, in the realm of filmmaking, technology enables the creation of lifelike characters and the seamless integration of computer-generated imagery (CGI) with live-action footage.

Moreover, this has elevated the overall quality of visual effects, enhancing the storytelling capabilities of filmmakers.  Furthermore, in the gaming industry, the utilization enhances realism in character movements, providing gamers with a more immersive and engaging experience. Hence, such factors are positively impacting the market. Therefore, it is expected to drive the market growth during the forecast period.

Market Growth and Trends

A key factor shaping the market growth is the rising demand for animation and science-fiction content. In the entertainment industry, especially in filmmaking and gaming, audiences are increasingly seeking visually stunning and immersive experiences. In addition, it plays a pivotal role in meeting this demand by enabling the creation of lifelike characters and realistic movements, enhancing the overall quality of animation.

Moreover, in the production of animated movies, 3D motion capture systems allow animators to capture the nuances of human movement with unparalleled accuracy. In addition, this high level of precision contributes to the creation of characters that move and behave in a more natural and convincing manner. Therefore, animated films and TV serials can deliver an enhanced sense of realism, resonating more effectively with audiences and elevating the storytelling experience. Hence, such factors are driving the market growth during the forecast period.

Market Restrain

Complexities in implementing systems are one of the key challenges hindering market growth. Deploying and configuring systems comprises intricate setup processes, which often require specialized knowledge and technical expertise. In addition, this complexity can pose a barrier for potential users, particularly smaller businesses or industries that have limited financial resources and personnel.

Moreover, the calibration of systems, which is necessary to ensure the accurate and precise tracking of movements, is a critical aspect that contributes to the overall complexity of these systems. In addition,  achieving optimal calibration can be time-consuming, requiring careful adjustments and fine-tuning of equipment to account for various factors, such as lighting conditions, environmental interference, and specific user characteristics. Hence, such factors are hindering the market growth during the forecast period.

Market Segmentation By Application

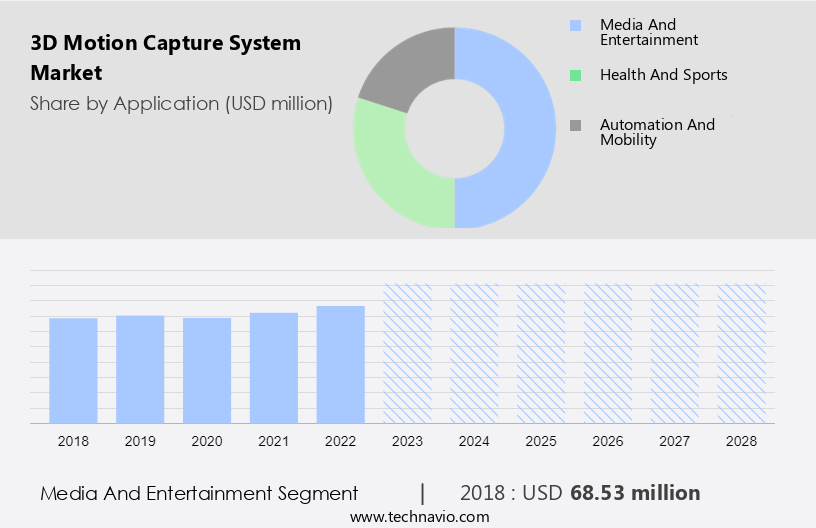
The media and entertainment segment is estimated to witness significant growth during the forecast period. The demand for realistic and captivating animations has increased in film, TV, and video game production. In addition, systems have become indispensable tools in achieving lifelike character movements and immersive virtual environments. Furthermore, the ability to capture and replicate the subtle nuances of human motion precisely has elevated the quality of animation and visual effects, leading to more compelling storytelling and engaging content.

3D Motion Capture System Market Size

Get a glance at the market contribution of various segments Download the PDF Sample

The media and entertainment segment was the largest segment and was valued at USD 68.53 million in 2018. Moreover, one of the key applications of 3D motion capture in the media and entertainment industry is character animation. In addition, by capturing the movements of actors or performers, animators can translate these motions onto digital characters seamlessly, bringing them to life with unparalleled realism. Furthermore, this process has streamlined animation workflows significantly, enabling studios to produce high-quality content more efficiently. Hence, such factors are fuelling the growth of this segment which in turn drives the market growth during the forecast period.

Market Segmentation By Type

The various applications of the hardware segment in systems will increase the market growth.  The hardware components of a 3D motion capture system play a major role in capturing and translating real-world movements into digital data. In addition, one fundamental element in the hardware segment is 3D motion capture cameras that are typically equipped with high-speed sensors and lenses capable of capturing movements with precision. Moreover, these cameras are strategically positioned around the capture space to ensure comprehensive coverage and accurate tracking of markers or subjects. Furthermore, marker technology is another essential hardware component. In addition, these markers can be passive or active, with passive markers reflecting the light back to the cameras, while active markers emit their own light.  Hence, such factors are fuelling the growth of this segment which in turn drives the market growth during the forecast period.

Regional Overview

3D Motion Capture System Market Share by Geography

For more insights on the market share of various regions Download PDF Sample now!

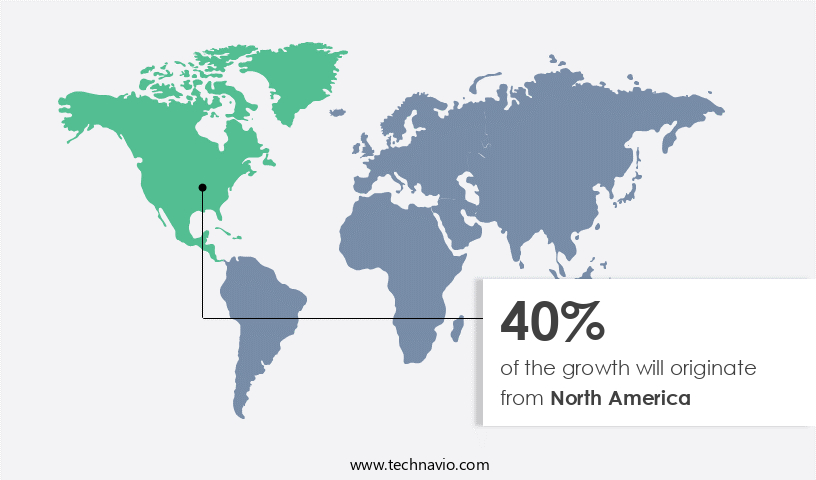
North America is estimated to contribute 40% to the growth of the global market during the forecast period. Technavio's analysts have provided extensive insight into the market forecast, detailing the regional trends and drivers influencing the market's trajectory throughout the forecast period. Several American-based production houses develop their animated television series in-house. Additionally, the budget for animated movies in the US is quite high when compared with other countries. Therefore, these end-users prefer to buy the license for 3D motion capture software, thus driving the growth of the market in the region. Moreover, TV channels like Disney, Viacom, and Cartoon Network, which are based in the US, produce animated series and movies for a global audience. In addition, channels like Disney and Cartoon Network drive the demand in the country. Furthermore, these companies develop customized cartoon content that is broadcast on TV channels to gain competitive advantages in the market. Hence, such factors are driving the market growth in APAC during the forecast period.

Market Customer Landscape

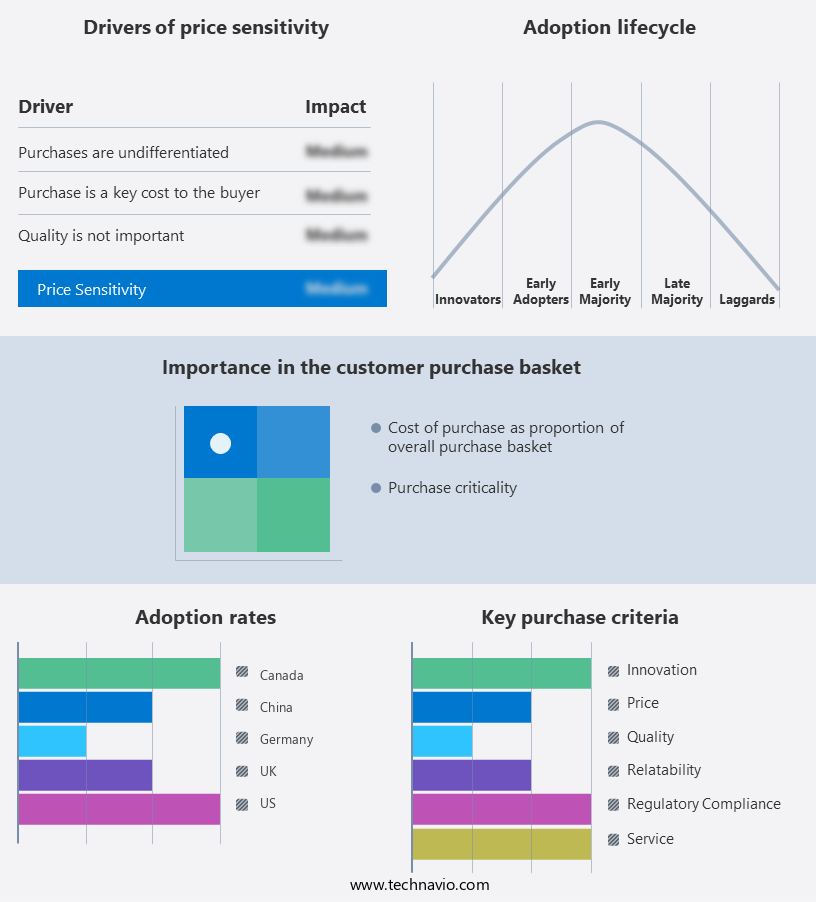
The market forecasting report includes the adoption lifecycle of the market research and growth, covering from the innovator’s stage to the laggard’s stage. It focuses on adoption rates in different regions based on penetration. Furthermore, the report also includes key purchase criteria and drivers of price sensitivity to help companies evaluate and develop their market growth and trends strategies.

3D Motion Capture System Market Share by Geography

Global Market Customer Landscape

Market Players

Companies are implementing various strategies, such as strategic alliances, partnerships, mergers and acquisitions, geographical expansion, and product/service launches, to enhance their presence in the market.

Carmeuse Coordination Center SA: The company offers 3D motion capture systems such as 3DMA optical motion capture and analysis under the brand STT SYSTEMS.

Market analysis and report of qualitative and quantitative analysis of companies has been conducted to help clients understand the wider business environment as well as the strengths and weaknesses of key market players. Data is qualitatively analyzed to categorize companies as pure play, category-focused, industry-focused, and diversified; it is quantitatively analyzed to categorize companies as dominant, leading, strong, tentative, and weak.

Market Analyst Overview

The market witnesses expansive growth across various industries, facilitated by advancements in communication devices and accessories. With increasing demand from the entertainment fields and a surge in computer vision technology, 3D animations have become more lifelike and immersive. Robotics sectors benefit from Google's initiatives like Daydream Lab, incorporating software components for enhanced functionalities. The metaverse offers new avenues for virtual events and engineering applications. MoCap sensors play a pivotal role in robotics, additive manufacturing, and teleworking, ensuring human safety and ergonomics. From industrial robots to automotive development, interior design, and military training, 3D motion capture systems find extensive use in diverse applications, including marine and underwater applications, aerodynamics tests, and vessel tracking.

Segment Overview

The market research report forecasts market growth by revenue at global, regional & country levels and provides an analysis of the latest trends and growth opportunities from 2018 to 2028.

  • Application Outlook
    • Media and entertainment
    • Health and sports
    • Automation and mobility
  • Type Outlook
    • Hardware
    • Software
    • Services
  • Region Outlook
    • North America
      • The U.S.
      • Canada
    • Europe
      • The U.K.
      • Germany
      • France
      • Rest of Europe
    • APAC
      • China
      • India
    • South America
      • Chile
      • Argentina
      • Brazil
    • Middle East & Africa
      • Saudi Arabia
      • South Africa
      • Rest of the Middle East & Africa

3D Motion Capture System Market Scope

Report Coverage

Details

Page number

165

Base year

2023

Historic period

2018-2022

Forecast period

2024-2028

Growth momentum & CAGR

Accelerate at a CAGR of 12.86%

Market Growth 2024-2028

USD 164.74 million

Market structure

Fragmented

YoY growth 2023-2024(%)

8.66

Regional analysis

North America, Europe, APAC, South America, and Middle East and Africa

Performing market contribution

North America at 40%

Key countries

US, Canada, China, UK, and Germany

Competitive landscape

Leading Companies, Market Positioning of Companies, Competitive Strategies, and Industry Risks

Key companies profiled

AIQ Synertial, Carmeuse Coordination Center SA, Codamotion Ltd., DEEPMOTION INC., Leyard Group, Meta Motion, MindMaze SA, Motion Analysis Inc., Motion Workshop, Movella Inc, Noitom Ltd., Noraxon USA Inc., Notch Interfaces Inc., PhaseSpace Inc., PTI Phoenix Technologies Inc., Qualisys AB, Raptor Photonics Ltd., Rokoko Electronics ApS , Roper Technologies Inc., Scientific Analytics Inc., Sony Group Corp., Ultraleap Ltd., Vicon Motion Systems Ltd., and ZF Friedrichshafen AG

Market dynamics

Parent market analysis, Market growth inducers and obstacles, Fast-growing and slow-growing segment analysis, COVID-19 impact and recovery analysis and future consumer dynamics, and Market condition analysis for the forecast period.

Customization purview

If our report has not included the data that you are looking for, you can reach out to our analysts and get segments customized.

Download PDF Sample

What are the Key Data Covered in this 3D Motion Capture System Market Research Report?

  • CAGR of the market report forecast during the forecast period
  • Detailed information on factors that will drive the growth of the market  between 2023 and 2028
  • Precise estimation of the market size and its contribution to the market in focus on the parent market
  • Accurate predictions about upcoming market trends and changes in consumer behavior
  • Growth of the market across North America, Europe, APAC, South America, and Middle East and Africa
  • Thorough market analysis and report of the market’s competitive landscape and detailed information about companies
  • Comprehensive analysis of factors that will challenge the growth of Industry companies


We can help! Our analysts can customize this market research report to meet your requirements. Get in touch


1 Executive Summary

  • 1.1 Market overview
    • Exhibit 01: Executive Summary – Chart on Market Overview
    • Exhibit 02: Executive Summary – Data Table on Market Overview
    • Exhibit 03: Executive Summary – Chart on Global Market Characteristics
    • Exhibit 04: Executive Summary – Chart on Market by Geography
    • Exhibit 05: Executive Summary – Chart on Market Segmentation by Application
    • Exhibit 06: Executive Summary – Chart on Market Segmentation by Type
    • Exhibit 07: Executive Summary – Chart on Incremental Growth
    • Exhibit 08: Executive Summary – Data Table on Incremental Growth
    • Exhibit 09: Executive Summary – Chart on Vendor Market Positioning

2 Market Landscape

  • 2.1 Market ecosystem
    • Exhibit 10: Parent market
    • Exhibit 11: Market Characteristics

3 Market Sizing

  • 3.1 Market definition
    • Exhibit 12: Offerings of vendors included in the market definition
  • 3.2 Market segment analysis
    • Exhibit 13: Market segments
  • 3.3 Market size 2023
    • 3.4 Market outlook: Forecast for 2023-2028
      • Exhibit 14: Chart on Global - Market size and forecast 2023-2028 ($ million)
      • Exhibit 15: Data Table on Global - Market size and forecast 2023-2028 ($ million)
      • Exhibit 16: Chart on Global Market: Year-over-year growth 2023-2028 (%)
      • Exhibit 17: Data Table on Global Market: Year-over-year growth 2023-2028 (%)

    4 Historic Market Size

    • 4.1 Global 3D motion capture system market 2018 - 2022
      • Exhibit 18: Historic Market Size – Data Table on global 3d motion capture system market 2018 - 2022 ($ million)
    • 4.2 Application Segment Analysis 2018 - 2022
      • Exhibit 19: Historic Market Size – Application Segment 2018 - 2022 ($ million)
    • 4.3 Type Segment Analysis 2018 - 2022
      • Exhibit 20: Historic Market Size – Type Segment 2018 - 2022 ($ million)
    • 4.4 Geography Segment Analysis 2018 - 2022
      • Exhibit 21: Historic Market Size – Geography Segment 2018 - 2022 ($ million)
    • 4.5 Country Segment Analysis 2018 - 2022
      • Exhibit 22: Historic Market Size – Country Segment 2018 - 2022 ($ million)

    5 Five Forces Analysis

    • 5.1 Five forces summary
      • Exhibit 23: Five forces analysis - Comparison between 2023 and 2028
    • 5.2 Bargaining power of buyers
      • Exhibit 24: Chart on Bargaining power of buyers – Impact of key factors 2023 and 2028
    • 5.3 Bargaining power of suppliers
      • Exhibit 25: Bargaining power of suppliers – Impact of key factors in 2023 and 2028
    • 5.4 Threat of new entrants
      • Exhibit 26: Threat of new entrants – Impact of key factors in 2023 and 2028
    • 5.5 Threat of substitutes
      • Exhibit 27: Threat of substitutes – Impact of key factors in 2023 and 2028
    • 5.6 Threat of rivalry
      • Exhibit 28: Threat of rivalry – Impact of key factors in 2023 and 2028
    • 5.7 Market condition
      • Exhibit 29: Chart on Market condition - Five forces 2023 and 2028

    6 Market Segmentation by Application

    • 6.1 Market segments
      • Exhibit 30: Chart on Application - Market share 2023-2028 (%)
      • Exhibit 31: Data Table on Application - Market share 2023-2028 (%)
    • 6.2 Comparison by Application
      • Exhibit 32: Chart on Comparison by Application
      • Exhibit 33: Data Table on Comparison by Application
    • 6.3 Media and entertainment - Market size and forecast 2023-2028
      • Exhibit 34: Chart on Media and entertainment - Market size and forecast 2023-2028 ($ million)
      • Exhibit 35: Data Table on Media and entertainment - Market size and forecast 2023-2028 ($ million)
      • Exhibit 36: Chart on Media and entertainment - Year-over-year growth 2023-2028 (%)
      • Exhibit 37: Data Table on Media and entertainment - Year-over-year growth 2023-2028 (%)
    • 6.4 Health and sports - Market size and forecast 2023-2028
      • Exhibit 38: Chart on Health and sports - Market size and forecast 2023-2028 ($ million)
      • Exhibit 39: Data Table on Health and sports - Market size and forecast 2023-2028 ($ million)
      • Exhibit 40: Chart on Health and sports - Year-over-year growth 2023-2028 (%)
      • Exhibit 41: Data Table on Health and sports - Year-over-year growth 2023-2028 (%)
    • 6.5 Automation and mobility - Market size and forecast 2023-2028
      • Exhibit 42: Chart on Automation and mobility - Market size and forecast 2023-2028 ($ million)
      • Exhibit 43: Data Table on Automation and mobility - Market size and forecast 2023-2028 ($ million)
      • Exhibit 44: Chart on Automation and mobility - Year-over-year growth 2023-2028 (%)
      • Exhibit 45: Data Table on Automation and mobility - Year-over-year growth 2023-2028 (%)
    • 6.6 Market opportunity by Application
      • Exhibit 46: Market opportunity by Application ($ million)
      • Exhibit 47: Data Table on Market opportunity by Application ($ million)

    7 Market Segmentation by Type

    • 7.1 Market segments
      • Exhibit 48: Chart on Type - Market share 2023-2028 (%)
      • Exhibit 49: Data Table on Type - Market share 2023-2028 (%)
    • 7.2 Comparison by Type
      • Exhibit 50: Chart on Comparison by Type
      • Exhibit 51: Data Table on Comparison by Type
    • 7.3 Hardware - Market size and forecast 2023-2028
      • Exhibit 52: Chart on Hardware - Market size and forecast 2023-2028 ($ million)
      • Exhibit 53: Data Table on Hardware - Market size and forecast 2023-2028 ($ million)
      • Exhibit 54: Chart on Hardware - Year-over-year growth 2023-2028 (%)
      • Exhibit 55: Data Table on Hardware - Year-over-year growth 2023-2028 (%)
    • 7.4 Software - Market size and forecast 2023-2028
      • Exhibit 56: Chart on Software - Market size and forecast 2023-2028 ($ million)
      • Exhibit 57: Data Table on Software - Market size and forecast 2023-2028 ($ million)
      • Exhibit 58: Chart on Software - Year-over-year growth 2023-2028 (%)
      • Exhibit 59: Data Table on Software - Year-over-year growth 2023-2028 (%)
    • 7.5 Services - Market size and forecast 2023-2028
      • Exhibit 60: Chart on Services - Market size and forecast 2023-2028 ($ million)
      • Exhibit 61: Data Table on Services - Market size and forecast 2023-2028 ($ million)
      • Exhibit 62: Chart on Services - Year-over-year growth 2023-2028 (%)
      • Exhibit 63: Data Table on Services - Year-over-year growth 2023-2028 (%)
    • 7.6 Market opportunity by Type
      • Exhibit 64: Market opportunity by Type ($ million)
      • Exhibit 65: Data Table on Market opportunity by Type ($ million)

    8 Customer Landscape

    • 8.1 Customer landscape overview
      • Exhibit 66: Analysis of price sensitivity, lifecycle, customer purchase basket, adoption rates, and purchase criteria

    9 Geographic Landscape

    • 9.1 Geographic segmentation
      • Exhibit 67: Chart on Market share by geography 2023-2028 (%)
      • Exhibit 68: Data Table on Market share by geography 2023-2028 (%)
    • 9.2 Geographic comparison
      • Exhibit 69: Chart on Geographic comparison
      • Exhibit 70: Data Table on Geographic comparison
    • 9.3 North America - Market size and forecast 2023-2028
      • Exhibit 71: Chart on North America - Market size and forecast 2023-2028 ($ million)
      • Exhibit 72: Data Table on North America - Market size and forecast 2023-2028 ($ million)
      • Exhibit 73: Chart on North America - Year-over-year growth 2023-2028 (%)
      • Exhibit 74: Data Table on North America - Year-over-year growth 2023-2028 (%)
    • 9.4 Europe - Market size and forecast 2023-2028
      • Exhibit 75: Chart on Europe - Market size and forecast 2023-2028 ($ million)
      • Exhibit 76: Data Table on Europe - Market size and forecast 2023-2028 ($ million)
      • Exhibit 77: Chart on Europe - Year-over-year growth 2023-2028 (%)
      • Exhibit 78: Data Table on Europe - Year-over-year growth 2023-2028 (%)
    • 9.5 APAC - Market size and forecast 2023-2028
      • Exhibit 79: Chart on APAC - Market size and forecast 2023-2028 ($ million)
      • Exhibit 80: Data Table on APAC - Market size and forecast 2023-2028 ($ million)
      • Exhibit 81: Chart on APAC - Year-over-year growth 2023-2028 (%)
      • Exhibit 82: Data Table on APAC - Year-over-year growth 2023-2028 (%)
    • 9.6 South America - Market size and forecast 2023-2028
      • Exhibit 83: Chart on South America - Market size and forecast 2023-2028 ($ million)
      • Exhibit 84: Data Table on South America - Market size and forecast 2023-2028 ($ million)
      • Exhibit 85: Chart on South America - Year-over-year growth 2023-2028 (%)
      • Exhibit 86: Data Table on South America - Year-over-year growth 2023-2028 (%)
    • 9.7 Middle East and Africa - Market size and forecast 2023-2028
      • Exhibit 87: Chart on Middle East and Africa - Market size and forecast 2023-2028 ($ million)
      • Exhibit 88: Data Table on Middle East and Africa - Market size and forecast 2023-2028 ($ million)
      • Exhibit 89: Chart on Middle East and Africa - Year-over-year growth 2023-2028 (%)
      • Exhibit 90: Data Table on Middle East and Africa - Year-over-year growth 2023-2028 (%)
    • 9.8 US - Market size and forecast 2023-2028
      • Exhibit 91: Chart on US - Market size and forecast 2023-2028 ($ million)
      • Exhibit 92: Data Table on US - Market size and forecast 2023-2028 ($ million)
      • Exhibit 93: Chart on US - Year-over-year growth 2023-2028 (%)
      • Exhibit 94: Data Table on US - Year-over-year growth 2023-2028 (%)
    • 9.9 UK - Market size and forecast 2023-2028
      • Exhibit 95: Chart on UK - Market size and forecast 2023-2028 ($ million)
      • Exhibit 96: Data Table on UK - Market size and forecast 2023-2028 ($ million)
      • Exhibit 97: Chart on UK - Year-over-year growth 2023-2028 (%)
      • Exhibit 98: Data Table on UK - Year-over-year growth 2023-2028 (%)
    • 9.10 China - Market size and forecast 2023-2028
      • Exhibit 99: Chart on China - Market size and forecast 2023-2028 ($ million)
      • Exhibit 100: Data Table on China - Market size and forecast 2023-2028 ($ million)
      • Exhibit 101: Chart on China - Year-over-year growth 2023-2028 (%)
      • Exhibit 102: Data Table on China - Year-over-year growth 2023-2028 (%)
    • 9.11 Germany - Market size and forecast 2023-2028
      • Exhibit 103: Chart on Germany - Market size and forecast 2023-2028 ($ million)
      • Exhibit 104: Data Table on Germany - Market size and forecast 2023-2028 ($ million)
      • Exhibit 105: Chart on Germany - Year-over-year growth 2023-2028 (%)
      • Exhibit 106: Data Table on Germany - Year-over-year growth 2023-2028 (%)
    • 9.12 Canada - Market size and forecast 2023-2028
      • Exhibit 107: Chart on Canada - Market size and forecast 2023-2028 ($ million)
      • Exhibit 108: Data Table on Canada - Market size and forecast 2023-2028 ($ million)
      • Exhibit 109: Chart on Canada - Year-over-year growth 2023-2028 (%)
      • Exhibit 110: Data Table on Canada - Year-over-year growth 2023-2028 (%)
    • 9.13 Market opportunity by geography
      • Exhibit 111: Market opportunity by geography ($ million)
      • Exhibit 112: Data Tables on Market opportunity by geography ($ million)

    10 Drivers, Challenges, and Trends

    • 10.1 Market drivers
      • 10.2 Market challenges
        • 10.3 Impact of drivers and challenges
          • Exhibit 113: Impact of drivers and challenges in 2023 and 2028
        • 10.4 Market trends

          11 Vendor Landscape

          • 11.1 Overview
            • 11.2 Vendor landscape
              • Exhibit 114: Overview on Criticality of inputs and Factors of differentiation
            • 11.3 Landscape disruption
              • Exhibit 115: Overview on factors of disruption
            • 11.4 Industry risks
              • Exhibit 116: Impact of key risks on business

            12 Vendor Analysis

            • 12.1 Vendors covered
              • Exhibit 117: Vendors covered
            • 12.2 Market positioning of vendors
              • Exhibit 118: Matrix on vendor position and classification
            • 12.3 AIQ Synertial
              • Exhibit 119: AIQ Synertial - Overview
              • Exhibit 120: AIQ Synertial - Product / Service
              • Exhibit 121: AIQ Synertial - Key offerings
            • 12.4 Carmeuse Coordination Center SA
              • Exhibit 122: Carmeuse Coordination Center SA - Overview
              • Exhibit 123: Carmeuse Coordination Center SA - Product / Service
              • Exhibit 124: Carmeuse Coordination Center SA - Key news
              • Exhibit 125: Carmeuse Coordination Center SA - Key offerings
            • 12.5 Codamotion Ltd.
              • Exhibit 126: Codamotion Ltd. - Overview
              • Exhibit 127: Codamotion Ltd. - Product / Service
              • Exhibit 128: Codamotion Ltd. - Key offerings
            • 12.6 Leyard Group
              • Exhibit 129: Leyard Group - Overview
              • Exhibit 130: Leyard Group - Product / Service
              • Exhibit 131: Leyard Group - Key offerings
            • 12.7 Motion Analysis Inc.
              • Exhibit 132: Motion Analysis Inc. - Overview
              • Exhibit 133: Motion Analysis Inc. - Product / Service
              • Exhibit 134: Motion Analysis Inc. - Key offerings
            • 12.8 Movella Inc
              • Exhibit 135: Movella Inc - Overview
              • Exhibit 136: Movella Inc - Product / Service
              • Exhibit 137: Movella Inc - Key offerings
            • 12.9 Noraxon USA Inc.
              • Exhibit 138: Noraxon USA Inc. - Overview
              • Exhibit 139: Noraxon USA Inc. - Product / Service
              • Exhibit 140: Noraxon USA Inc. - Key offerings
            • 12.10 Notch Interfaces Inc.
              • Exhibit 141: Notch Interfaces Inc. - Overview
              • Exhibit 142: Notch Interfaces Inc. - Product / Service
              • Exhibit 143: Notch Interfaces Inc. - Key offerings
            • 12.11 PhaseSpace Inc.
              • Exhibit 144: PhaseSpace Inc. - Overview
              • Exhibit 145: PhaseSpace Inc. - Product / Service
              • Exhibit 146: PhaseSpace Inc. - Key offerings
            • 12.12 PTI Phoenix Technologies Inc.
              • Exhibit 147: PTI Phoenix Technologies Inc. - Overview
              • Exhibit 148: PTI Phoenix Technologies Inc. - Product / Service
              • Exhibit 149: PTI Phoenix Technologies Inc. - Key offerings
            • 12.13 Qualisys AB
              • Exhibit 150: Qualisys AB - Overview
              • Exhibit 151: Qualisys AB - Product / Service
              • Exhibit 152: Qualisys AB - Key offerings
            • 12.14 Roper Technologies Inc.
              • Exhibit 153: Roper Technologies Inc. - Overview
              • Exhibit 154: Roper Technologies Inc. - Business segments
              • Exhibit 155: Roper Technologies Inc. - Key offerings
              • Exhibit 156: Roper Technologies Inc. - Segment focus
            • 12.15 Scientific Analytics Inc.
              • Exhibit 157: Scientific Analytics Inc. - Overview
              • Exhibit 158: Scientific Analytics Inc. - Product / Service
              • Exhibit 159: Scientific Analytics Inc. - Key offerings
            • 12.16 Vicon Motion Systems Ltd.
              • Exhibit 160: Vicon Motion Systems Ltd. - Overview
              • Exhibit 161: Vicon Motion Systems Ltd. - Product / Service
              • Exhibit 162: Vicon Motion Systems Ltd. - Key offerings
            • 12.17 ZF Friedrichshafen AG
              • Exhibit 163: ZF Friedrichshafen AG - Overview
              • Exhibit 164: ZF Friedrichshafen AG - Business segments
              • Exhibit 165: ZF Friedrichshafen AG - Key news
              • Exhibit 166: ZF Friedrichshafen AG - Key offerings
              • Exhibit 167: ZF Friedrichshafen AG - Segment focus

            13 Appendix

            • 13.1 Scope of the report
              • 13.2 Inclusions and exclusions checklist
                • Exhibit 168: Inclusions checklist
                • Exhibit 169: Exclusions checklist
              • 13.3 Currency conversion rates for US$
                • Exhibit 170: Currency conversion rates for US$
              • 13.4 Research methodology
                • Exhibit 171: Research methodology
                • Exhibit 172: Validation techniques employed for market sizing
                • Exhibit 173: Information sources
              • 13.5 List of abbreviations
                • Exhibit 174: List of abbreviations

              Research Methodology

              Technavio presents a detailed picture of the market by way of study, synthesis, and summation of data from multiple sources. The analysts have presented the various facets of the market with a particular focus on identifying the key industry influencers. The data thus presented is comprehensive, reliable, and the result of extensive research, both primary and secondary.

              INFORMATION SOURCES

              Primary sources

              • Manufacturers and suppliers
              • Channel partners
              • Industry experts
              • Strategic decision makers

              Secondary sources

              • Industry journals and periodicals
              • Government data
              • Financial reports of key industry players
              • Historical data
              • Press releases

              DATA ANALYSIS

              Data Synthesis

              • Collation of data
              • Estimation of key figures
              • Analysis of derived insights

              Data Validation

              • Triangulation with data models
              • Reference against proprietary databases
              • Corroboration with industry experts

              REPORT WRITING

              Qualitative

              • Market drivers
              • Market challenges
              • Market trends
              • Five forces analysis

              Quantitative

              • Market size and forecast
              • Market segmentation
              • Geographical insights
              • Competitive landscape

              Interested in this report?

              Get your sample now to see our research methodology and insights!

              Download Now

              Frequently Asked Questions

              3D Motion Capture System market growth will increase by $ 164.74 mn during 2024-2028.

              The 3D Motion Capture System market is expected to grow at a CAGR of 12.86% during 2024-2028.

              3D Motion Capture System market is segmented by Application( Media and entertainment, Health and sports, Automation and mobility) Type( Hardware, Software, Services)

              AIQ Synertial, Carmeuse Coordination Center SA, Codamotion Ltd., DEEPMOTION INC., Leyard Group, Meta Motion, MindMaze SA, Motion Analysis Inc., Motion Workshop, Movella Inc, Noitom Ltd., Noraxon USA Inc., Notch Interfaces Inc., PhaseSpace Inc., PTI Phoenix Technologies Inc., Qualisys AB, Raptor Photonics Ltd., Rokoko Electronics ApS , Roper Technologies Inc., Scientific Analytics Inc., Sony Group Corp., Ultraleap Ltd., Vicon Motion Systems Ltd., ZF Friedrichshafen AG are a few of the key vendors in the 3D Motion Capture System market.

              North America will register the highest growth rate of 40% among the other regions. Therefore, the 3D Motion Capture System market in North America is expected to garner significant business opportunities for the vendors during the forecast period.

              US, Canada, China, UK, Germany

              • Growing adoption of 3D motion capture technology in media and entertainment applicationsThe growing adoption of 3D motion capture technology in media and entertainment applications has become a significant driver for the global 3D motion capture system market. This technology has revolutionized the way motion is captured is the driving factor this market.
              • enabling more realistic and immersive experiences in movies is the driving factor this market.
              • video games is the driving factor this market.
              • and virtual reality content. In the realm of filmmaking is the driving factor this market.
              • 3D motion capture technology enables the creation of lifelike characters and the seamless integration of computer-generated imagery (CGI) with live-action footage. This has elevated the overall quality of visual effects is the driving factor this market.
              • enhancing the storytelling capabilities of filmmakers. Additionally is the driving factor this market.
              • in the gaming industry is the driving factor this market.
              • the utilization of 3D motion capture enhances realism in character movements is the driving factor this market.
              • providing gamers with a more immersive and engaging experience. Moreover is the driving factor this market.
              • the demand for virtual production techniques has surged is the driving factor this market.
              • driven by the need for cost-effective and efficient filmmaking processes. 3D motion capture technology plays a pivotal role in virtual production is the driving factor this market.
              • enabling the real-time visualization of CGI elements within a physical environment. This not only streamlines production workflows but also offers flexibility in creativity to filmmakers. Furthermore is the driving factor this market.
              • the expanding scope of applications of 3D motion capture systems beyond entertainment is the driving factor this market.
              • such as biomechanics research is the driving factor this market.
              • sports analysis is the driving factor this market.
              • and healthcare is the driving factor this market.
              • contributes to the sustained growth of the global 3D motion capture system market. As technology continues to advance and the entertainment industry seeks more sophisticated solutions is the driving factor this market.
              • the adoption of 3D motion capture technology is expected to rise. Therefore is the driving factor this market.
              • the growing adoption of 3D motion capture in media and entertainment applications will drive the growth of the global 3D motion capture system market during the forecast period. is the driving factor this market.

              The 3D Motion Capture System market vendors should focus on grabbing business opportunities from the Media and entertainment segment as it accounted for the largest market share in the base year.
              RIA - Research AI Assistant
              Ask RIA