
3D Technology Market Size 2025-2029
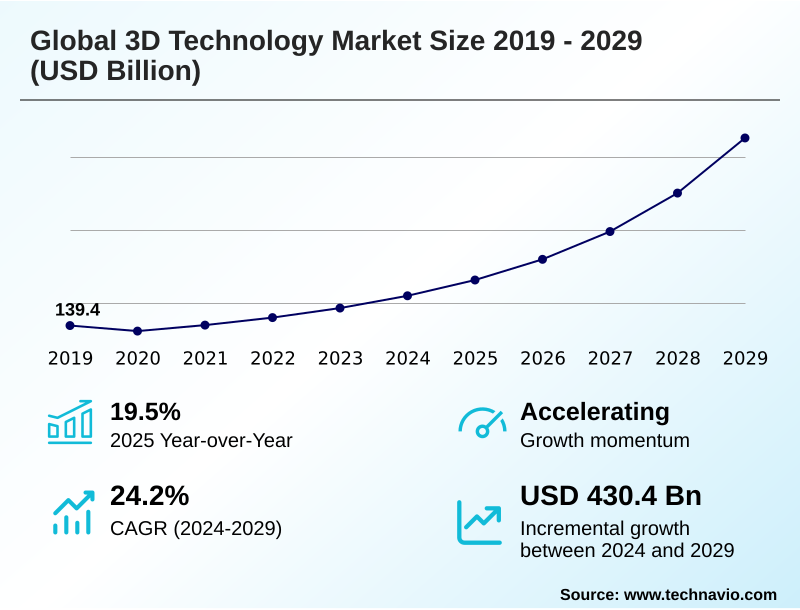
The 3d technology market size is valued to increase by USD 430.4 billion, at a CAGR of 24.2% from 2024 to 2029. Rising application of the Internet of things (IoT) will drive the 3d technology market.
Major Market Trends & Insights
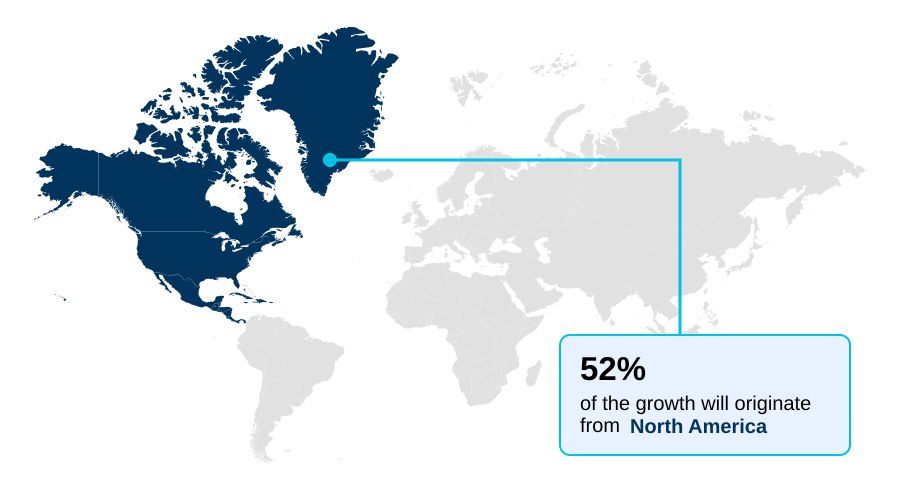
- North America dominated the market and accounted for a 52% growth during the forecast period.
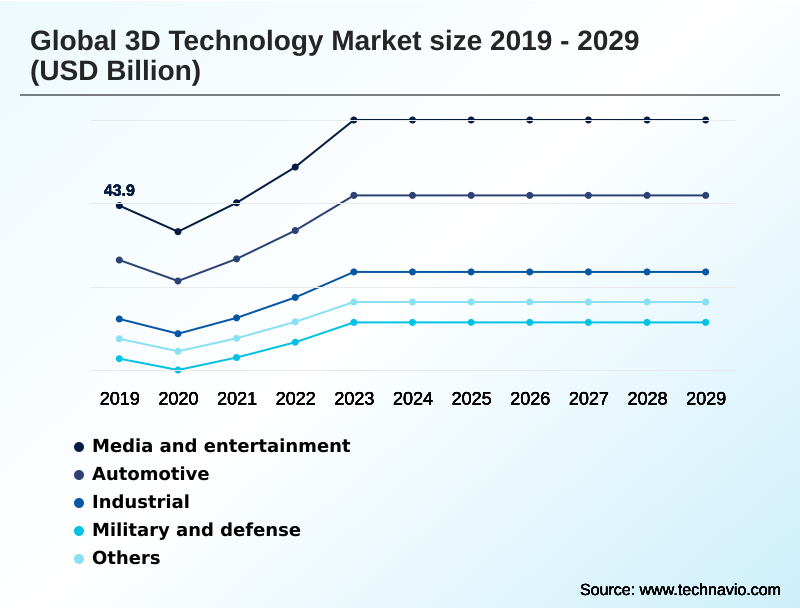
- By Application - Media and entertainment segment was valued at USD 59 billion in 2023
- By Product Type - 3D printers segment accounted for the largest market revenue share in 2023
Market Size & Forecast
- Market Opportunities: USD 511.6 billion
- Market Future Opportunities: USD 430.4 billion
- CAGR from 2024 to 2029 : 24.2%
Market Summary
What will be the Size of the 3D Technology Market during the forecast period?
Get Key Insights on Market Forecast (PDF) Get Free Sample
How is the 3D Technology Market Segmented?
The 3d technology industry research report provides comprehensive data (region-wise segment analysis), with forecasts and estimates in "USD billion" for the period 2025-2029, as well as historical data from 2019-2023 for the following segments.
- Application
- Media and entertainment
- Automotive
- Industrial
- Military and defense
- Others
- Product type
- 3D printers
- 3D scanners
- 3D displays
- Technology
- Stereolithography (SLA)
- Fused deposition modeling (FDM)
- Selective laser sintering (SLS)
- Geography
- North America
- US
- Canada
- Mexico
- Europe
- Germany
- UK
- France
- APAC
- China
- Japan
- India
- South America
- Brazil
- Argentina
- Middle East and Africa
- UAE
- Saudi Arabia
- South Africa
- Rest of World (ROW)
- North America
By Application Insights
The media and entertainment segment is estimated to witness significant growth during the forecast period.
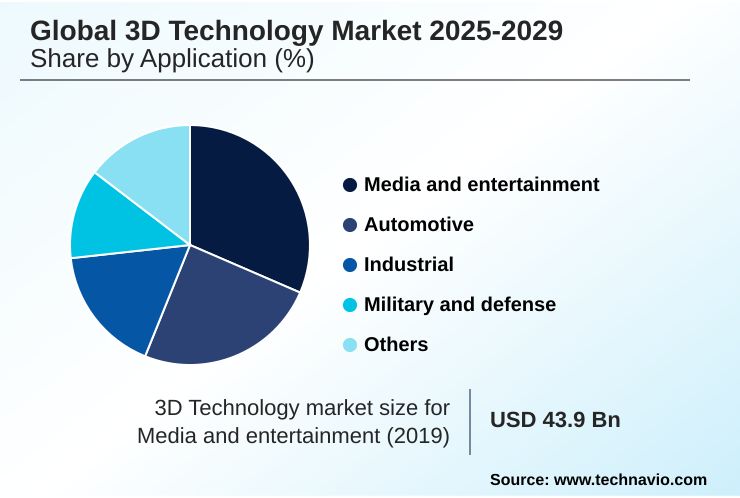
The Media and entertainment segment was valued at USD 59 billion in 2023 and showed a gradual increase during the forecast period.
Regional Analysis
North America is estimated to contribute 52% to the growth of the global market during the forecast period.Technavio’s analysts have elaborately explained the regional trends and drivers that shape the market during the forecast period.
See How 3D Technology Market Demand is Rising in North America Get Free Sample
Market Dynamics
Our researchers analyzed the data with 2024 as the base year, along with the key drivers, trends, and challenges. A holistic analysis of drivers will help companies refine their marketing strategies to gain a competitive advantage.
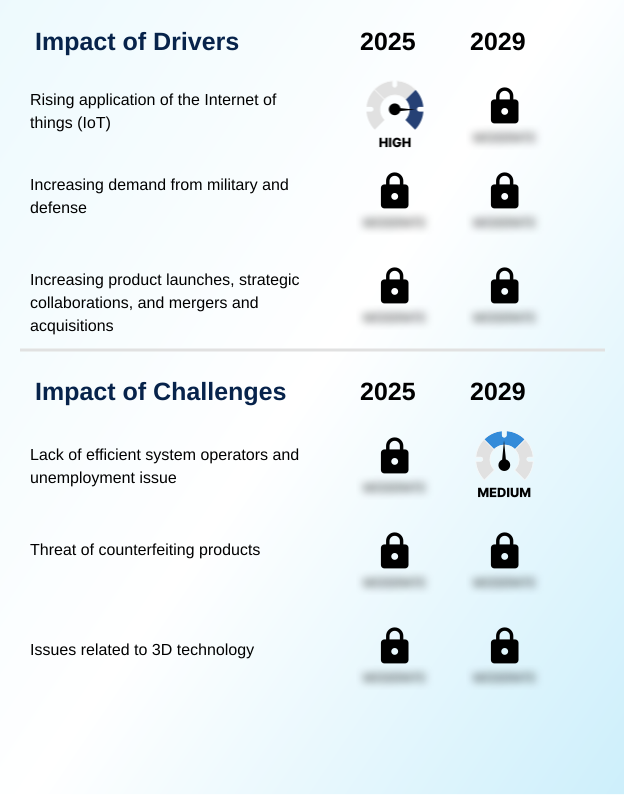
What are the key market drivers leading to the rise in the adoption of 3D Technology Industry?
What are the market trends shaping the 3D Technology Industry?
What challenges does the 3D Technology Industry face during its growth?
Exclusive Technavio Analysis on Customer Landscape
The 3d technology market forecasting report includes the adoption lifecycle of the market, covering from the innovator’s stage to the laggard’s stage. It focuses on adoption rates in different regions based on penetration. Furthermore, the 3d technology market report also includes key purchase criteria and drivers of price sensitivity to help companies evaluate and develop their market growth analysis strategies.
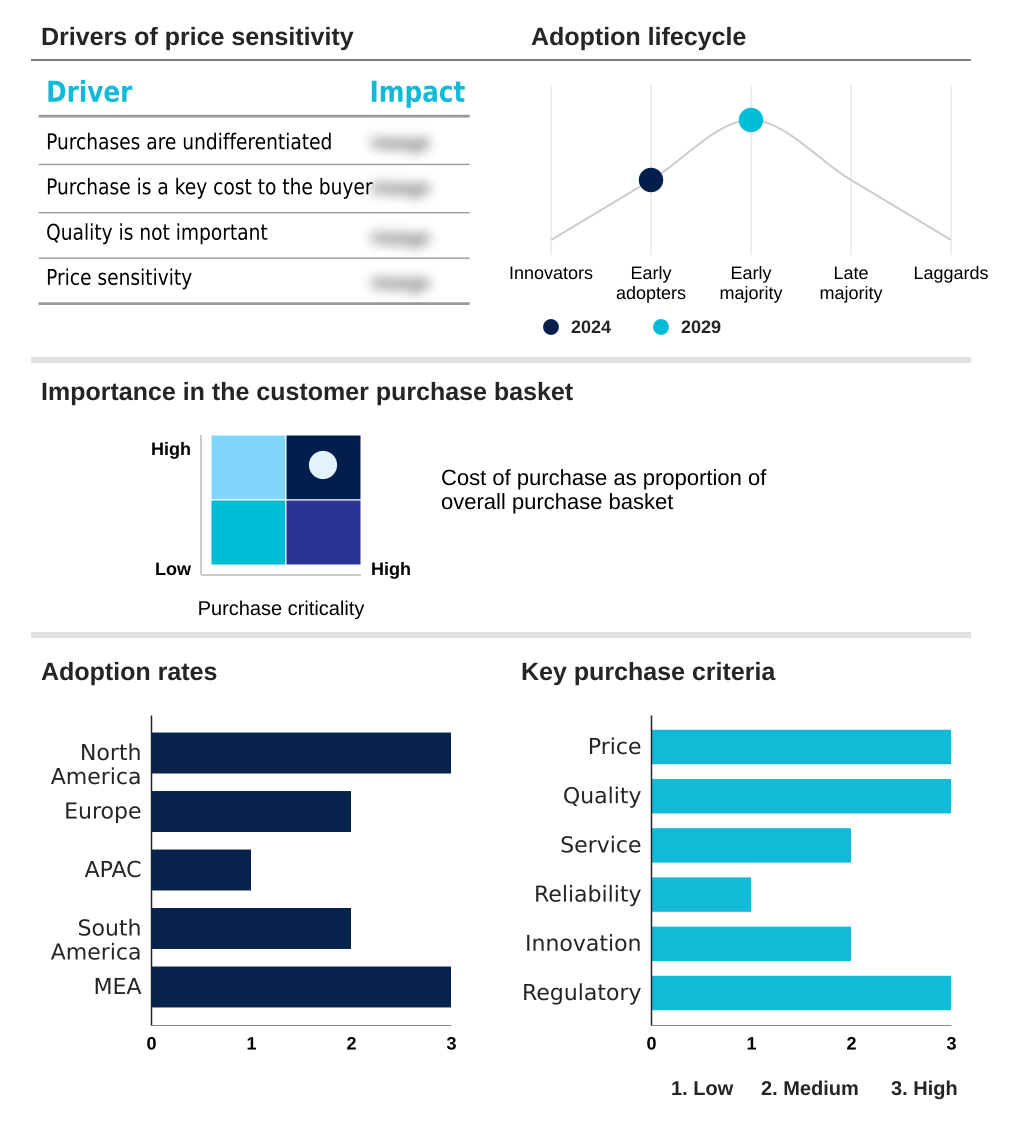
Customer Landscape of 3D Technology Industry
Competitive Landscape
Companies are implementing various strategies, such as strategic alliances, 3d technology market forecast, partnerships, mergers and acquisitions, geographical expansion, and product/service launches, to enhance their presence in the industry.
3D Systems Corp. -
The industry research and growth report includes detailed analyses of the competitive landscape of the market and information about key companies, including:
- 3D Systems Corp.
- American Paper Optics LLC
- Autodesk Inc.
- Barco NV
- DOLBY LABORATORIES INC.
- EOS GmbH
- FARO Technologies Inc.
- Hexagon AB
- Koninklijke Philips NV
- LG Electronics Inc.
- MATERIALISE NV
- Nikon Corp.
- Optomec Inc.
- Panasonic Holdings Corp.
- Renishaw Plc
- Samsung Electronics Co. Ltd.
- Sharp Corp.
- Sony Group Corp.
- Stratasys Ltd.
- Vicon Motion Systems Ltd.
Qualitative and quantitative analysis of companies has been conducted to help clients understand the wider business environment as well as the strengths and weaknesses of key industry players. Data is qualitatively analyzed to categorize companies as pure play, category-focused, industry-focused, and diversified; it is quantitatively analyzed to categorize companies as dominant, leading, strong, tentative, and weak.
Recent Development and News in 3d technology market
Dive into Technavio’s robust research methodology, blending expert interviews, extensive data synthesis, and validated models for unparalleled 3D Technology Market insights. See full methodology.
| Market Scope | |
|---|---|
| Page number | 297 |
| Base year | 2024 |
| Historic period | 2019-2023 |
| Forecast period | 2025-2029 |
| Growth momentum & CAGR | Accelerate at a CAGR of 24.2% |
| Market growth 2025-2029 | USD 430.4 billion |
| Market structure | Fragmented |
| YoY growth 2024-2025(%) | 19.5% |
| Key countries | US, Canada, Mexico, Germany, UK, France, Russia, Italy, Spain, China, Japan, India, South Korea, Australia, Indonesia, Brazil, Argentina, Chile, UAE, Saudi Arabia, South Africa, Egypt and Nigeria |
| Competitive landscape | Leading Companies, Market Positioning of Companies, Competitive Strategies, and Industry Risks |
Research Analyst Overview
What are the Key Data Covered in this 3D Technology Market Research and Growth Report?
-
What is the expected growth of the 3D Technology Market between 2025 and 2029?
-
USD 430.4 billion, at a CAGR of 24.2%
-
-
What segmentation does the market report cover?
-
The report is segmented by Application (Media and entertainment, Automotive, Industrial, Military and defense, and Others), Product Type (3D printers, 3D scanners and 3D displays), Technology (Stereolithography (SLA), Fused deposition modeling (FDM) and Selective laser sintering (SLS)) and Geography (North America, Europe, APAC, South America, Middle East and Africa)
-
-
Which regions are analyzed in the report?
-
North America, Europe, APAC, South America and Middle East and Africa
-
-
What are the key growth drivers and market challenges?
-
Rising application of the Internet of things (IoT), Lack of efficient system operators and unemployment issue
-
-
Who are the major players in the 3D Technology Market?
-
3D Systems Corp., American Paper Optics LLC, Autodesk Inc., Barco NV, DOLBY LABORATORIES INC., EOS GmbH, FARO Technologies Inc., Hexagon AB, Koninklijke Philips NV, LG Electronics Inc., MATERIALISE NV, Nikon Corp., Optomec Inc., Panasonic Holdings Corp., Renishaw Plc, Samsung Electronics Co. Ltd., Sharp Corp., Sony Group Corp., Stratasys Ltd. and Vicon Motion Systems Ltd.
-
Market Research Insights
We can help! Our analysts can customize this 3d technology market research report to meet your requirements.
 RIA -
RIA - 
