
Accounts Receivable Automation Market Size 2025-2029
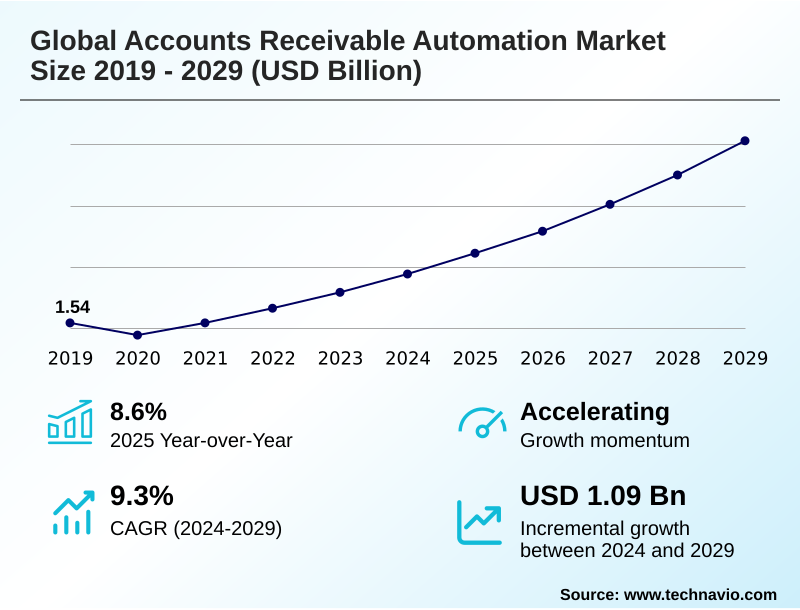
The accounts receivable automation market size is valued to increase by USD 1.09 billion, at a CAGR of 9.3% from 2024 to 2029. Increasing demand for cloud-based AR automation solution will drive the accounts receivable automation market.
Major Market Trends & Insights
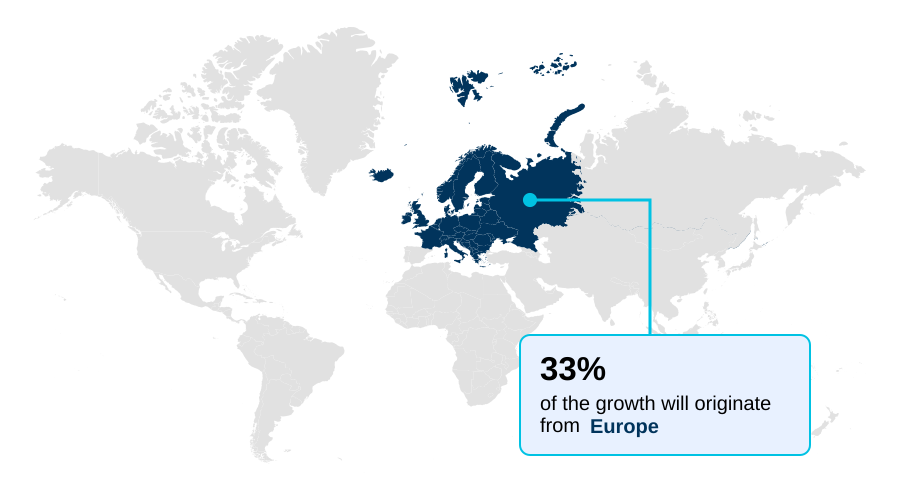
- Europe dominated the market and accounted for a 32.8% growth during the forecast period.
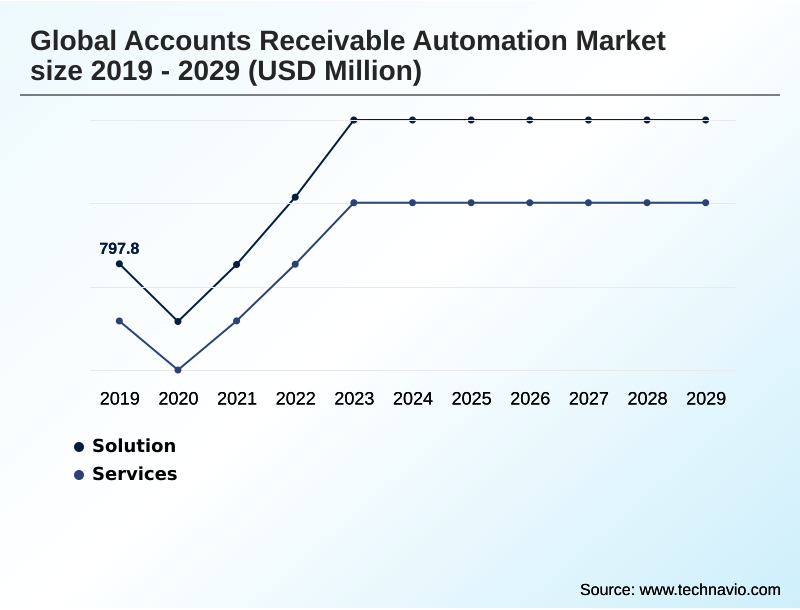
- By Component - Solution segment was valued at USD 934.8 million in 2023
- By Deployment - Cloud segment accounted for the largest market revenue share in 2023
Market Size & Forecast
- Market Opportunities: USD 1.48 billion
- Market Future Opportunities: USD 1.09 billion
- CAGR from 2024 to 2029 : 9.3%
Market Summary
- The accounts receivable automation market is driven by a fundamental corporate need to enhance financial operations and optimize working capital. Organizations are moving away from manual, error-prone processes toward intelligent systems that streamline the entire invoice-to-cash cycle. This digital transformation is fueled by the pursuit of greater efficiency, improved cash flow visibility, and stronger customer financial relationships.
- For instance, a multinational manufacturing firm can leverage an automated platform to manage thousands of monthly invoices across different countries and currencies. The system can automatically send reminders, apply cash from various payment sources, and flag disputed invoices for immediate action, significantly reducing days sales outstanding.
- However, the implementation of such technology is not without its complexities, as businesses must navigate challenges related to data security and seamless integration with legacy enterprise resource planning (ERP) systems to unlock the full potential of automation.
What will be the Size of the Accounts Receivable Automation Market during the forecast period?
Get Key Insights on Market Forecast (PDF) Get Free Sample
How is the Accounts Receivable Automation Market Segmented?
The accounts receivable automation industry research report provides comprehensive data (region-wise segment analysis), with forecasts and estimates in "USD million" for the period 2025-2029, as well as historical data from 2019-2023 for the following segments.
- Component
- Solution
- Services
- Deployment
- Cloud
- On-premises
- Organization size
- Large organizations
- SMEs
- Geography
- North America
- US
- Canada
- Mexico
- Europe
- UK
- Germany
- France
- APAC
- China
- Japan
- India
- Middle East and Africa
- Saudi Arabia
- UAE
- South Africa
- South America
- Brazil
- Argentina
- Rest of World (ROW)
- North America
By Component Insights
The solution segment is estimated to witness significant growth during the forecast period.
The global accounts receivable automation market is segmented by component, deployment, organization size, and geography. The solution segment is pivotal, as organizations increasingly replace inefficient, paper-based workflows with digital systems.
These platforms enable comprehensive AR process streamlining, covering everything from the invoice management system to final payment. Solutions incorporating cash application automation and automated invoice matching are critical, allowing finance teams to achieve over 95% straight-through cash posting rates.
This level of automation is essential for effective invoice reconciliation process management and collections and dispute resolution.
By optimizing the entire invoice-to-cash cycle with tools like AI-powered invoice capture, companies can achieve significant DSO and bad debt reduction, directly impacting financial health and operational agility in a competitive landscape.
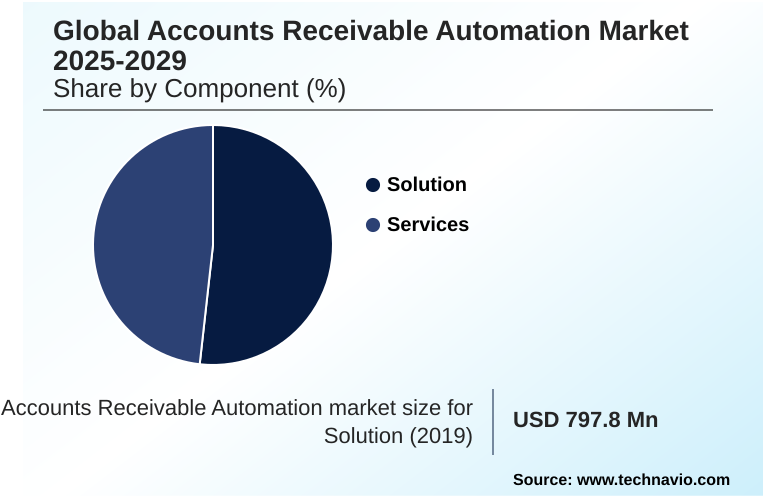
The Solution segment was valued at USD 934.8 million in 2023 and showed a gradual increase during the forecast period.
Regional Analysis
Europe is estimated to contribute 32.8% to the growth of the global market during the forecast period.Technavio’s analysts have elaborately explained the regional trends and drivers that shape the market during the forecast period.
See How Accounts Receivable Automation Market Demand is Rising in Europe Get Free Sample
The geographic landscape of the accounts receivable automation market is characterized by varied adoption rates and growth trajectories across regions.
North America remains a mature market, driven by a high concentration of large enterprises and a strong emphasis on financial process automation.
Europe is poised to contribute nearly 33% of the market's incremental growth, fueled by regulatory initiatives promoting e-invoicing and a push for greater financial operations efficiency.
Meanwhile, the APAC region is expected to exhibit the fastest growth, with a CAGR over 10%, as SMEs increasingly adopt cloud-based solutions for working capital optimization.
Key regional drivers include the need for robust credit risk assessment tools, the adoption of integrated payment solutions, and the implementation of autonomous finance platforms to manage enterprise revenue management effectively, adapting to diverse economic conditions and ERP system integration for AR complexities in back-office financial automation.
Market Dynamics
Our researchers analyzed the data with 2024 as the base year, along with the key drivers, trends, and challenges. A holistic analysis of drivers will help companies refine their marketing strategies to gain a competitive advantage.
- As organizations evaluate their financial technology stack, the comparison of accounts receivable automation vs manual processes becomes a critical exercise in strategic planning. The primary goal is improving cash flow with AR automation, which directly addresses inefficiencies in traditional workflows.
- A key area of focus is AI for predicting customer payment dates, a capability that transforms reactive collections into a proactive, data-driven strategy. Businesses are discovering the extensive benefits of integrating AR with ERP systems, which creates a single source of truth for financial data and eliminates reconciliation errors.
- This integration is crucial for implementing best practices for AR deduction management, as it provides the necessary visibility to resolve disputes quickly and prevent revenue leakage. Ultimately, the objective is reducing dso with automated collections, where intelligent workflows and tailored communication strategies can accelerate payments significantly.
- Organizations that successfully deploy these automated systems often report a more than twofold increase in the productivity of their collections teams compared to those relying on spreadsheets and manual follow-ups.
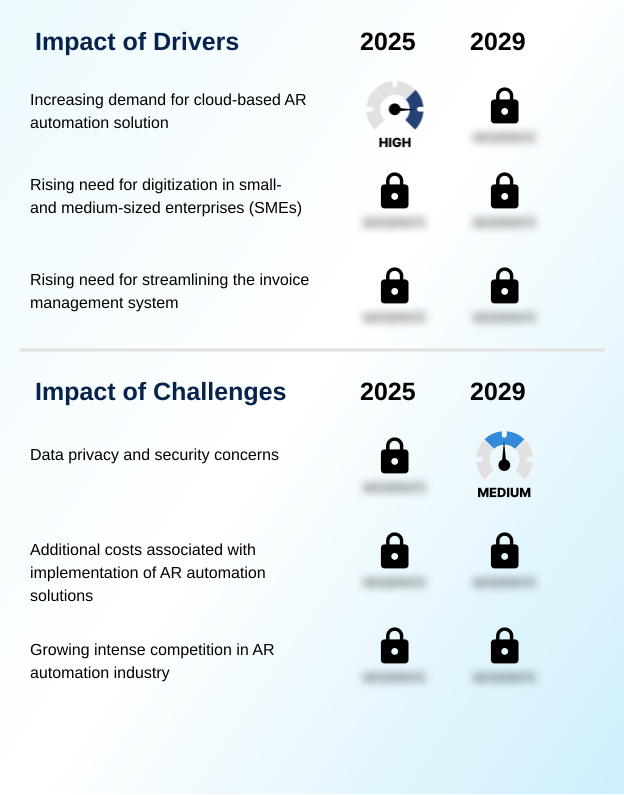
What are the key market drivers leading to the rise in the adoption of Accounts Receivable Automation Industry?
- The increasing demand for cloud-based accounts receivable automation solutions is a key driver for market growth.
- The primary driver propelling market growth is the increasing adoption of cloud-based platforms that offer scalability, cost-efficiency, and rapid deployment. This digital transformation in finance is enabling organizations to achieve significant liquidity improvement.
- Cloud-based financial software, often part of a broader payment orchestration platform, facilitates the use of robotic process automation for handling repetitive tasks.
- This includes electronic payment reconciliation and managing automated billing capabilities, which can reduce manual processing costs by over 40%. The goal is comprehensive order-to-cash process automation and effective cash conversion cycle management.
- The flexibility of these solutions supports automated billing and accelerates the adoption of modern financial tools, making advanced automation accessible to a wider range of businesses seeking to optimize their financial workflows.
What are the market trends shaping the Accounts Receivable Automation Industry?
- The emergence of machine learning and artificial intelligence-based accounts receivable automation solutions represents a significant upcoming trend, reshaping financial operations.
- Key market trends are centered on the integration of advanced technologies to create more intelligent and predictive systems. The emergence of AI-powered cash flow forecasting is a primary development, offering businesses unprecedented cash flow visibility. These platforms utilize predictive payment behavior analytics to enable proactive financial management, moving beyond historical reporting.
- A significant application is customer creditworthiness prediction, which helps in setting dynamic credit limits and mitigating risk. Furthermore, features for invoice payment prediction and AR fraud detection are becoming standard, with some solutions improving forecast accuracy by over 20%.
- This evolution towards data-driven decision-making is supported by SaaS financial software that provides valuable customer payment behavior insights and automated customer query response, fundamentally changing how finance teams operate and engage with customers through enhanced credit management automation.
What challenges does the Accounts Receivable Automation Industry face during its growth?
- Data privacy and security concerns represent a key challenge affecting the industry's growth.
- Despite strong growth drivers, the market faces significant challenges related to data security and the complexity of managing financial workflows. As businesses adopt fintech AR solutions, concerns over data breaches and compliance are paramount, as a single incident can result in financial losses exceeding 15% of the affected revenue stream.
- Establishing robust automated dunning strategies and automated collections strategies requires careful configuration to avoid damaging customer relationships. Moreover, the implementation of sophisticated deduction validation workflows and automated dispute resolution can be complex, particularly when integrating with legacy accounts receivable modules.
- These hurdles contribute to organizational inertia, slowing down the goal of achieving significant days sales outstanding reduction and bad debt minimization, which are primary incentives for adoption for order-to-cash team tools.
Exclusive Technavio Analysis on Customer Landscape
The accounts receivable automation market forecasting report includes the adoption lifecycle of the market, covering from the innovator’s stage to the laggard’s stage. It focuses on adoption rates in different regions based on penetration. Furthermore, the accounts receivable automation market report also includes key purchase criteria and drivers of price sensitivity to help companies evaluate and develop their market growth analysis strategies.
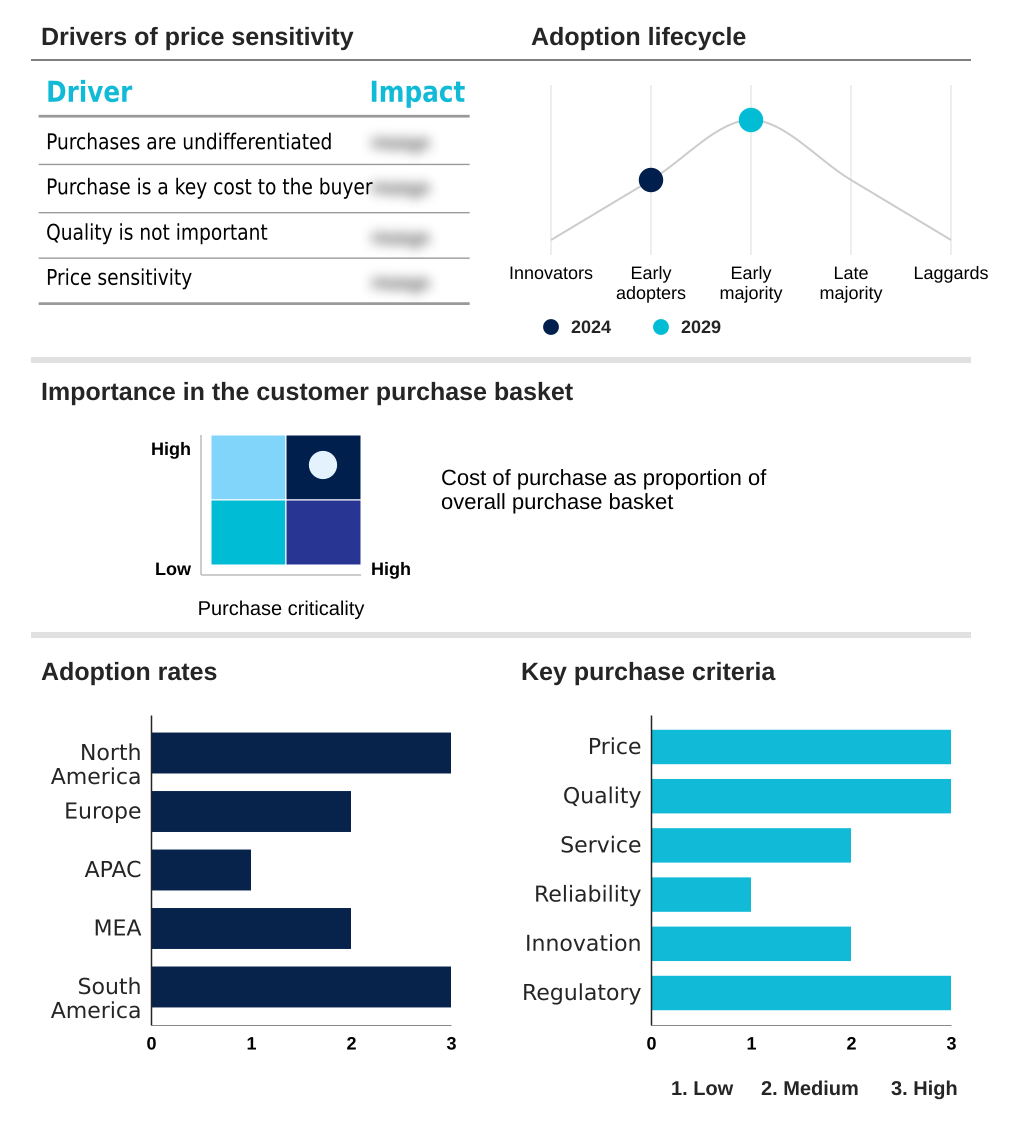
Customer Landscape of Accounts Receivable Automation Industry
Competitive Landscape
Companies are implementing various strategies, such as strategic alliances, accounts receivable automation market forecast, partnerships, mergers and acquisitions, geographical expansion, and product/service launches, to enhance their presence in the industry.
Ash Conversions International - Delivers comprehensive data and document automation solutions, enabling streamlined accounts payable processes and digital mailroom operations for enhanced enterprise efficiency.
The industry research and growth report includes detailed analyses of the competitive landscape of the market and information about key companies, including:
- Ash Conversions International
- BlackLine Inc.
- BlueSnap Inc.
- Bottomline Technologies Inc.
- Comarch SA
- Corcentric Inc.
- Emagia Corpo
- Esker SA
- HighRadius Corp.
- Mynd Integrated Solutions
- Oracle Corp.
- Pagero
- QUADIENT
- Qvalia Group AB
- Sage Group Plc
- SAP SE
- SK Global Software LLC
- Tungsten Automation Corp.
- Workday Inc.
- Zoho Corp. Pvt. Ltd.
Qualitative and quantitative analysis of companies has been conducted to help clients understand the wider business environment as well as the strengths and weaknesses of key industry players. Data is qualitatively analyzed to categorize companies as pure play, category-focused, industry-focused, and diversified; it is quantitatively analyzed to categorize companies as dominant, leading, strong, tentative, and weak.
Recent Development and News in Accounts receivable automation market
- In September, 2024, HighRadius Corp. announced the launch of a new generative AI assistant for its order-to-cash platform, designed to automate customer query responses and predict payment delays with over 90% accuracy.
- In November, 2024, SAP SE revealed a strategic partnership with a major B2B payments network to embed seamless, real-time payment capabilities directly within its S/4HANA Cloud AR module, simplifying the invoice-to-cash cycle for its enterprise clients.
- In February, 2025, Oracle Corp. acquired a niche fintech startup specializing in AI-driven credit risk assessment, integrating its technology into the Oracle Fusion Cloud ERP suite to offer dynamic credit limit adjustments.
- In April, 2025, BlackLine Inc. rolled out an enhanced version of its cash application solution, featuring advanced AI-powered invoice matching algorithms that reduce manual exception handling by an additional 40% for complex remittance data.
Dive into Technavio’s robust research methodology, blending expert interviews, extensive data synthesis, and validated models for unparalleled Accounts Receivable Automation Market insights. See full methodology.
| Market Scope | |
|---|---|
| Page number | 277 |
| Base year | 2024 |
| Historic period | 2019-2023 |
| Forecast period | 2025-2029 |
| Growth momentum & CAGR | Accelerate at a CAGR of 9.3% |
| Market growth 2025-2029 | USD 1086.9 million |
| Market structure | Fragmented |
| YoY growth 2024-2025(%) | 8.6% |
| Key countries | US, Canada, Mexico, UK, Germany, France, Italy, Spain, The Netherlands, China, Japan, India, South Korea, Australia, Indonesia, Saudi Arabia, UAE, South Africa, Israel, Turkey, Brazil, Argentina and Chile |
| Competitive landscape | Leading Companies, Market Positioning of Companies, Competitive Strategies, and Industry Risks |
Research Analyst Overview
- The accounts receivable automation market is undergoing a strategic evolution, transitioning from a focus on basic process efficiency to intelligent cash flow optimization. This shift is underpinned by the corporate mandate to enhance liquidity and build financial resilience.
- The core of this transformation lies in the ability of modern platforms to provide a holistic view of the entire cash conversion cycle. At a boardroom level, investment decisions are increasingly tied to the technology's ability to provide predictive insights that inform strategic financial planning.
- For example, the capability to forecast payment behaviors with high accuracy allows for more reliable cash flow projections, directly impacting budgeting and investment strategies.
- Businesses adopting these advanced systems have reported up to a 30% reduction in invoice processing time, freeing up finance teams to concentrate on value-added activities such as risk analysis and customer relationship management rather than transactional tasks.
What are the Key Data Covered in this Accounts Receivable Automation Market Research and Growth Report?
-
What is the expected growth of the Accounts Receivable Automation Market between 2025 and 2029?
-
USD 1.09 billion, at a CAGR of 9.3%
-
-
What segmentation does the market report cover?
-
The report is segmented by Component (Solution, and Services), Deployment (Cloud, and On-premises), Organization Size (Large organization and SMEs) and Geography (North America, Europe, APAC, Middle East and Africa, South America)
-
-
Which regions are analyzed in the report?
-
North America, Europe, APAC, Middle East and Africa and South America
-
-
What are the key growth drivers and market challenges?
-
Increasing demand for cloud-based AR automation solution, Data privacy and security concerns
-
-
Who are the major players in the Accounts Receivable Automation Market?
-
Ash Conversions International, BlackLine Inc., BlueSnap Inc., Bottomline Technologies Inc., Comarch SA, Corcentric Inc., Emagia Corpo, Esker SA, HighRadius Corp., Mynd Integrated Solutions, Oracle Corp., Pagero, QUADIENT, Qvalia Group AB, Sage Group Plc, SAP SE, SK Global Software LLC, Tungsten Automation Corp., Workday Inc. and Zoho Corp. Pvt. Ltd.
-
Market Research Insights
- Market dynamics are increasingly shaped by the pursuit of measurable improvements in financial operations efficiency. The adoption of SaaS financial software is accelerating as companies prioritize working capital optimization and liquidity improvement. This shift is validated by performance metrics showing that integrated platforms can lead to a 25% reduction in days sales outstanding.
- Furthermore, the focus on B2B payment automation and streamlined ERP system integration for AR is paramount. Platforms that deliver deep customer payment behavior insights enable more effective credit management automation, reducing bad debt by up to 15%. This data-driven approach transforms AR from a simple back-office function into a strategic component of corporate finance.
We can help! Our analysts can customize this accounts receivable automation market research report to meet your requirements.
 RIA -
RIA - 
