Active Optical Cable Market Analysis APAC, North America, Europe, South America, Middle East and Africa - China, US, Japan, South Korea, Germany - Size and Forecast 2024-2028

Active Optical Cable Market Analysis APAC, North America, Europe, South America, Middle East and Africa - China, US, Japan, South Korea, Germany - Size and Forecast 2024-2028

Published: Jul 2024 145 Pages SKU: IRTNTR73853

Market Overview at a Glance

$9.57 B
Market Opportunity
34.73%
CAGR
25.9
YoY growth 2023-2024(%)

Active Optical Cable Market Size 2024-2028

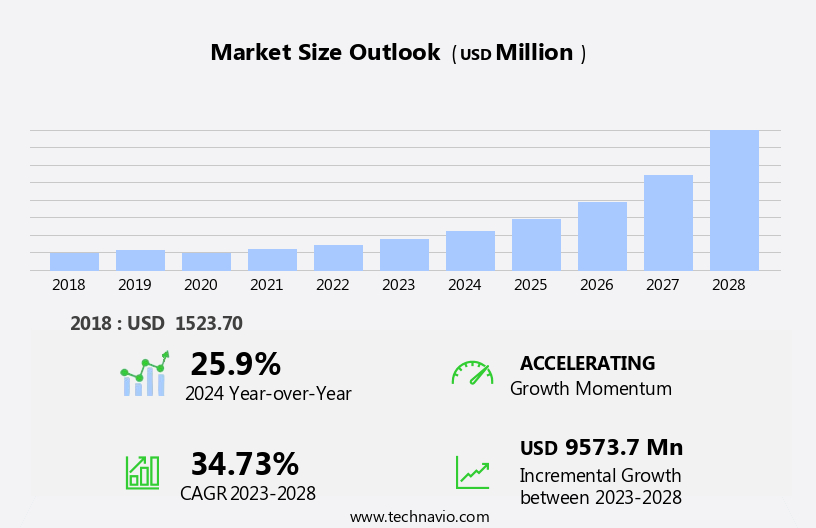
The active optical cable market size is forecast to increase by USD 9.57 billion at a CAGR of 34.73% between 2023 and 2028.

  • The Active Optical Cable (AOC) market is experiencing significant growth due to several key trends. The expansion of data centers is one of the primary drivers, as businesses continue to digitize and store large amounts of data. Additionally, the adoption of 5G networks is increasing the demand for high-speed connectivity solutions, making AOCs an attractive option due to their ability to transmit data at faster rates than traditional copper cables. However, the market also faces challenges, such as the complexities involved in implementing and managing AOCs. These complexities include the need for specialized knowledge and equipment, as well as higher upfront costs compared to copper cables.
  • Despite these challenges, the benefits of AOCs, including their high bandwidth, low power consumption, and long reach capabilities, make them a valuable investment for organizations in need of reliable, high-speed connectivity solutions.
  • What will be the Size of the Active Optical Cable Market During the Forecast Period?

    Active Optical Cable Market Size

     Request Free Sample

  • The market is experiencing significant growth due to the increasing demand for high-speed data transfer in various industries. With the digitalization of businesses and the rise of cloud-based services, the need for reliable and efficient data transmission solutions has become crucial. Active optical cables offer several advantages over traditional copper cables, including lower power consumption, higher bandwidth, and longer transmission distances. The market is segmented into QSFP, SFP+, Infiniband, and HDMI segments based on connector type. The Infiniband segment is expected to dominate the market due to its widespread use in data centers, high-performance computing, and military and aerospace applications.
  • The SFP+ segment is also gaining popularity in WLAN networks, software-defined networking, and network-function virtualization. The advent of 5G networks and the increasing adoption of Ethernet protocols in various industries are further driving the growth of the market. End users in data centers, high-performance computing, personal computers, digital signage, consumer electronics, and other industries are increasingly adopting active optical cables for their high-speed data transfer needs. Despite the advantages, the market faces challenges such as high initial investment costs and the availability of alternative solutions like passive optical cables and copper cables. Overall, the market is poised for significant growth In the coming years.
  • How is this Active Optical Cable Industry segmented and which is the largest segment?

    The active optical cable industry research report provides comprehensive data (region-wise segment analysis), with forecasts and estimates in "USD million" for the period 2024-2028, as well as historical data from 2018-2022 for the following segments.

    • End-user
      • Data center
      • Consumer electronics
      • High performance computing
      • Telecommunication
      • Others
    • Geography
      • APAC
        • China
        • Japan
        • South Korea
      • North America
        • US
      • Europe
        • Germany
      • South America
        • Middle East and Africa

        By End-user Insights

        • The data center segment is estimated to witness significant growth during the forecast period.

        Active optical cables (AOCs) are a crucial component in data center infrastructure, offering high-speed, reliable, and plug-and-play connectivity solutions. The rising trend of data center consolidation, driven by cost savings, enhanced security, and improved efficiency, is fueling the demand for AOCs. Consolidation projects enable enterprises to reduce operating expenses by up to 30%, enhance data security by up to 35%, and improve data transmission efficiency by up to 50%, while reducing power consumption by up to 55%. The shift towards cloud-based services, digitalization, and the deployment of 5G networks are further boosting the demand for AOCs in various sectors, including data centers, high-performance computing, personal computing, digital signage, consumer electronics, and more.

        Key segments, such as QSFP, SFP+, and InfiniBand, are expected to dominate the market during the forecast period. AOCs are also gaining traction in industries like military, aerospace, automotive, power plants, oil, gas refineries, telecom, and more, due to their high-performance capabilities and reliability. Technologies like software-defined networking, network-function virtualization, and Ethernet protocols are also driving the market growth.

        Active Optical Cable Market Size

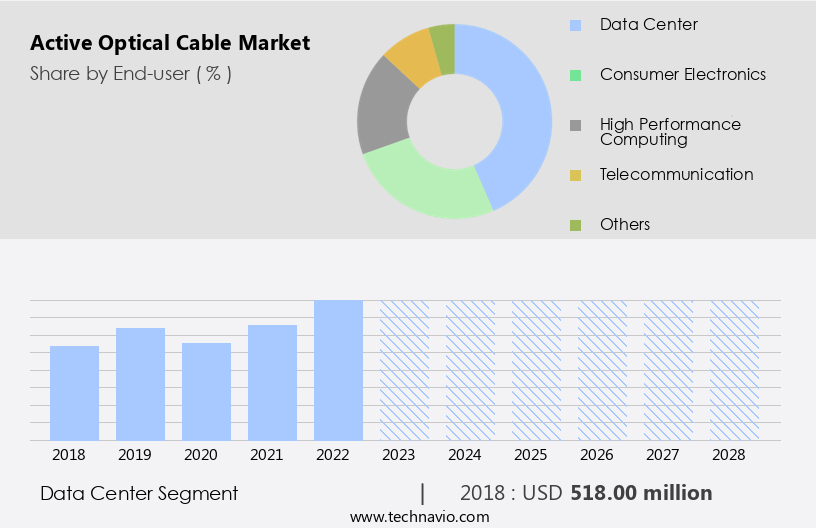
        Get a glance at the  Active Optical Cable Industry report of share of various segments Request Free Sample

        The Data center segment was valued at USD 518.00 billion in 2018 and showed a gradual increase during the forecast period.
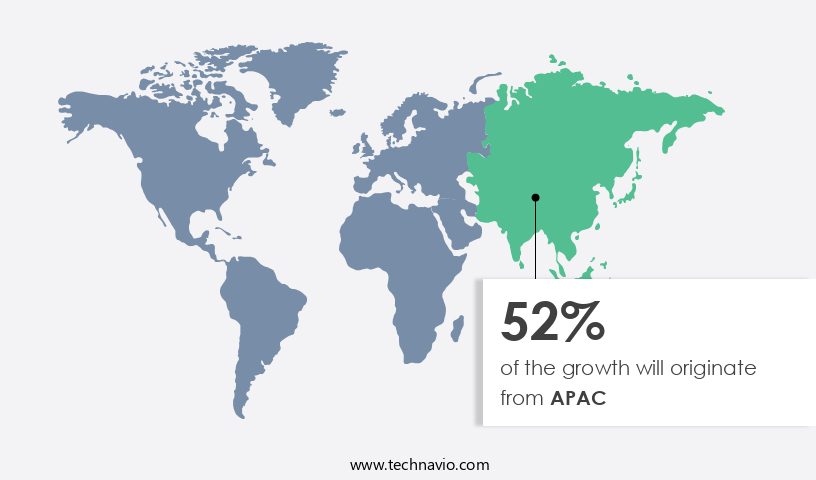
        Regional Analysis

        • APAC is estimated to contribute 52% to the growth of the global market during the forecast period.

        Technavio’s analysts have elaborately explained the regional trends and drivers that shape the market during the forecast period.

        Active Optical Cable Market Share by Geography

        For more insights on the market share of various regions, Request Free Sample

        The market In the Asia Pacific region is experiencing growth due to the expanding telecom sector and the focus on digitalization in developing countries like India and China. The deployment of active optical cable technology is essential for the smooth functioning of cloud-based services, which are increasingly being adopted. Telecom service providers are investing heavily in active optical cables to meet the growing demand for high-speed data transmission. The market in APAC is anticipated to expand significantly during the forecast period, driven by the increasing need for advanced connectivity solutions in data centers, 5G networks, and various end-user industries, including high-performance computing, personal computing, digital signage, consumer electronics, and professional audio, video applications.

        Additionally, sectors such as military, aerospace, automotive, power plants, oil, gas refineries, and telecom are also adopting active optical cable technology for their high-speed data transmission requirements. The technology's advantages, including its smaller form factor, lower power consumption, and higher bandwidth, make it a preferred choice for various applications. Active optical cable is also being used in various industries, including medical imaging, Internet of Things, FTTH, remote radio heads, distributed antenna systems, metro, and long-haul networks, high-resolution displays, televisions, monitors, projectors, gaming consoles, home theatre systems, augmented and virtual reality, and Quad small form-factor pluggable (QSFP), Small form-factor pluggable plus (SFP+), and InfiniBand segments.

        The market is expected to continue growing due to the increasing demand for high-speed data transmission and the ongoing digitalization trend.

        Market Dynamics

        Our  researchers analyzed the data with 2023 as the base year, along with the key drivers, trends, and challenges. A holistic analysis of drivers will help companies refine their marketing strategies to gain a competitive advantage.

        What are the key market drivers leading to the rise In the adoption of Active Optical Cable Industry?

        Expansion of data centers is the key driver of the market.

      • The Active Optical Cable (AOC) market is experiencing significant growth due to the digitalization trend and the increasing adoption of cloud-based services, 5G networks, and high-performance computing in various industries. In the data center sector, the demand for AOCs is increasing as companies invest in constructing new data centers or expanding existing ones to support the growing need for data storage and processing. The QSFP, SFP+, and InfiniBand segments are expected to dominate the market due to their high-speed capabilities and wide usage in data centers, high-performance computing, and telecommunication networks. Moreover, the AOC market is witnessing increased demand in sectors such as military, aerospace, automotive, power plants, oil, gas refineries, and telecom, among others, due to the need for high-speed connectivity and data transfer.
      • Fiber optics technology, including laser diodes, optical fibers, control circuitry, insulating materials, connectors, and housing, plays a crucial role In the production of AOCs. The market is also witnessing significant growth in professional audio, video applications, medical imaging systems, and aerospace systems, among others. The increasing adoption of software-defined networking, network-function virtualization, and Ethernet protocols is also driving the demand for AOCs. End users In the data center, high-performance computing, personal computer, digital signage, consumer electronics, and other industries are expected to drive the growth of the AOC market during the forecast period. Furthermore, the Internet of Things (IoT), FTTH, remote radio heads, distributed antenna systems, metro, long-haul networks, high-resolution displays, televisions, monitors, projectors, gaming consoles, home theatre systems, augmented, and virtual reality are some of the applications that are expected to fuel the growth of the AOC market.
      • Overall, the market is expected to witness significant growth during the forecast period due to the increasing demand for high-speed connectivity and data transfer in various industries.
      • What are the market trends shaping the Active Optical Cable Industry?

        Adoption of 5G networks is the upcoming market trend.

      • The Active Optical Cable (AOC) market is experiencing significant growth due to the increasing adoption of 5G networks and digitalization. With 5G networks providing ultra-fast Internet connectivity and low latency, there is a growing demand for flexible spectrum frameworks, such as AOCs. These cables are essential for carrying high-bandwidth applications, including digital signage, cloud-based services, and high-performance computing. In the data center sector, AOCs are being used extensively in applications such as InfiniBand, Ethernet, and Fibre Channel. The QSFP28, SFP+, and CXP connector types are particularly popular in data centers due to their high-speed capabilities. The military, aerospace, and automotive sectors are also adopting AOCs for applications such as avionics, satellite communications, unmanned aerial vehicles, and medical imaging systems.
      • Fiber optics technology, including laser diodes, optical fibers, control circuitry, insulating materials, connectors, and housing, plays a crucial role In the production of AOCs. Key technologies, such as software-defined networking and network-function virtualization, are also driving the demand for AOCs in various applications. The increasing use of Ethernet protocols, including 10G, 40G, and 100G, is also contributing to the growth of the AOC market. End users in various industries, including telecom, power plants, oil, gas refineries, and consumer electronics, are adopting AOCs for their high-speed connectivity requirements. The Internet of Things (IoT), FTTH, remote radio heads, and distributed antenna systems are some of the emerging applications of AOCs.
      • The market for AOCs is expected to continue growing due to the increasing demand for high-resolution displays, televisions, monitors, projectors, gaming consoles, home theatre systems, and augmented, virtual reality applications.
      • What challenges does the Active Optical Cable Industry face during its growth?

        Complexities involved in wired communication networks is a key challenge affecting the industry growth.

      • Active optical cables (AOCs) are experiencing significant growth in various industries due to digitalization and the adoption of cloud-based services, 5G networks, and advanced technologies such as Software-defined networking (SDN) and Network-function virtualization (NFV). The AOC market comprises several segments, including QSFP, SFP+, InfiniBand, and HDMI, each catering to distinct applications. Despite the market's potential, challenges persist, particularly In the area of fault detection in existing fiber optic cables. Traditional methods like time-domain reflectometry (TDR) and frequency-domain fault detection (FD) require costly testing equipment. Moreover, the high costs associated with installing wired communication networks, including labor, materials, and replacement, can negatively impact the return on investment (ROI).
      • These factors are driving network operators to explore wireless technologies as alternatives, which may potentially reduce the demand for active optical cables and hinder market growth. However, the AOC market continues to expand in sectors such as data centers, high-performance computing, personal computers, digital signage, consumer electronics, and professional audio, video applications. Industries like military, aerospace, automotive, power plants, oil, gas refineries, telecom, and satellite communications also rely on fiber optics technology for their communication needs. Advancements in fiber optics technology, including laser diodes, optical fibers, control circuitry, insulating materials, connectors, housing, photodiodes, and telecommunication networks, contribute to the market's growth.
      • Applications in medical imaging systems, such as computed tomography, ultrasound devices, and magnetic resonance imaging, are also driving demand for active optical cables. The Internet of Things (IoT), FTTH, remote radio heads, distributed antenna systems, metro, and long-haul networks, high-resolution displays, televisions, monitors, projectors, gaming consoles, home theatre systems, augmented, and virtual reality devices further fuel market expansion.
      • Exclusive Customer Landscape

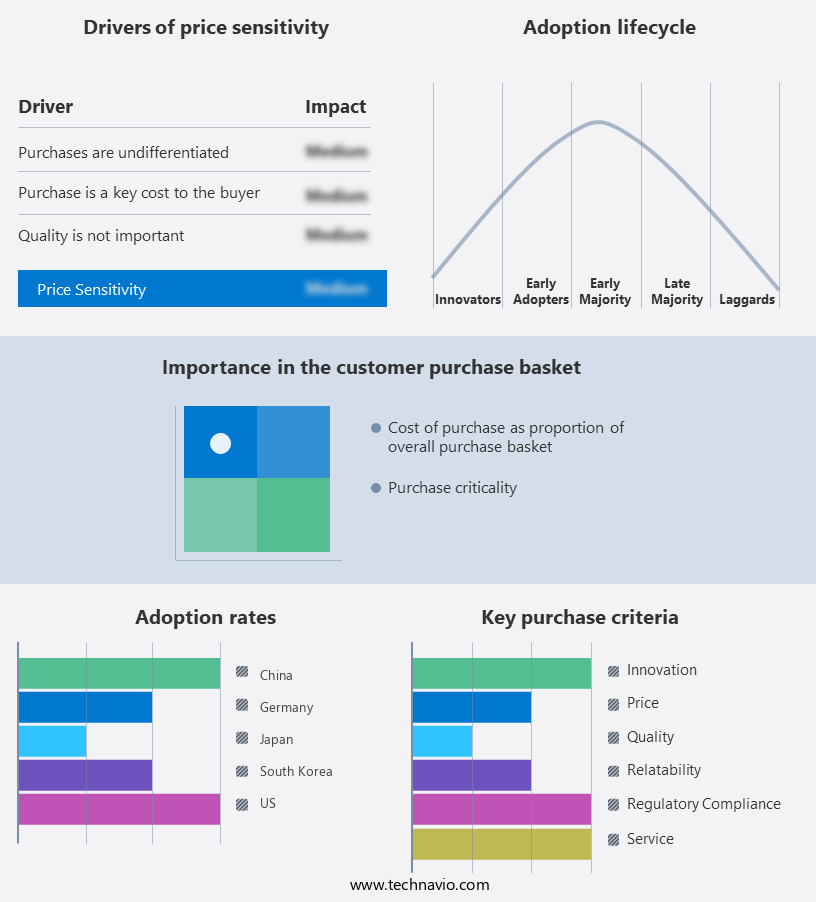
        The active optical cable market forecasting report includes the adoption lifecycle of the market, covering from the innovator’s stage to the laggard’s stage. It focuses on adoption rates in different regions based on penetration. Furthermore, the active optical cable market report also includes key purchase criteria and drivers of price sensitivity to help companies evaluate and develop their market growth analysis strategies.

        Active Optical Cable Market Share by Geography

         Customer Landscape

        Key Companies & Market Insights

        Companies are implementing various strategies, such as strategic alliances, active optical cable market forecast, partnerships, mergers and acquisitions, geographical expansion, and product/service launches, to enhance their presence In the industry.

        3M Co. - Active optical cables are lightweight and flexible solutions engineered for high-performance computing clusters and high-speed servers. These cables offer superior data transfer rates and are routable, making them an ideal choice for data center applications. With their ability to support high bandwidth and low latency, active optical cables are essential for powering today's data-intensive workloads. The technology behind these cables enables longer transmission distances and reduced power consumption compared to traditional copper cables. By delivering unmatched performance and reliability, active optical cables are a crucial investment for organizations seeking to optimize their data infrastructure.

        The industry research and growth report includes detailed analyses of the competitive landscape of the market and information about key companies, including:

        • 3M Co.
        • Amphenol Corp.
        • Broadcom Inc.
        • Emcore Corp.
        • Fujikura Co. Ltd.
        • Fujitsu Ltd.
        • GIGALIGHT
        • Hitachi Ltd.
        • International Business Machines Corp.
        • II VI Inc.
        • Koch Industries Inc.
        • Leoni AG
        • Lumentum Holdings Inc.
        • Optomind Inc.
        • SANWA DENKI KOGYO Co.Ltd.
        • Sopto Technology Co. Ltd.
        • Sumitomo Electric Industries Ltd.
        • TE Connectivity Ltd.
        • The Siemon Co.
        • Yangtze Optical Fibre and Cable Joint Stock Ltd. Co.

        Qualitative and quantitative analysis of companies has been conducted to help clients understand the wider business environment as well as the strengths and weaknesses of key industry players. Data is qualitatively analyzed to categorize companies as pure play, category-focused, industry-focused, and diversified; it is quantitatively analyzed to categorize companies as dominant, leading, strong, tentative, and weak.

        Research Analyst Overview

        Active optical cables (AOCs) have emerged as a significant alternative to traditional copper cables in various industries due to their ability to provide high-speed data transfer and improved bandwidth efficiency. The market is driven by the increasing demand for cloud-based services, digitalization, and the deployment of 5G networks. AOCs utilize fiber optic technology, which is based on the transmission of light signals through optical fibers. This technology offers several advantages over copper cables, including longer transmission distances, higher bandwidth, and lower power consumption. The QSFP segment, SFP+ segment, and Infiniband segment are key market categories that are expected to witness substantial growth due to their application in high-performance computing, data centers, and telecommunication networks.

        The technology behind AOCs comprises several components, including laser diodes, optical fibers, control circuitry, insulating materials, connectors, and housing. The use of photodiodes and telecommunication networks further enhances the capabilities of AOCs, making them suitable for professional audio, video applications, and medical imaging systems. The market for active optical cables is diverse and spans various sectors, including data centers, military, aerospace, automotive, power plants, oil, gas refineries, telecom, and consumer electronics. In the data center sector, AOCs are increasingly being adopted for high-performance computing, personal computing, and software-defined networking applications. In the telecom sector, AOCs are used to build metro, long-haul networks, and remote radio heads, while In the consumer electronics sector, they are used for high-resolution displays, televisions, monitors, projectors, gaming consoles, and home theatre systems.

        The market for active optical cables is also driven by the increasing adoption of augmented and virtual reality technologies, which require high-speed data transfer and low latency. The use of AOCs in unmanned aerospace vehicles, satellite communications, and avionics systems is another significant application area that is expected to fuel market growth. The market dynamics of active optical cables are influenced by several factors, including technological advancements, regulatory frameworks, and economic conditions. The ongoing trend towards digitalization and the increasing demand for high-speed data transfer are key growth drivers. However, the market is also facing challenges such as high production costs and the availability of alternative solutions.

        In conclusion, the market is a dynamic and growing industry that is driven by the increasing demand for high-speed data transfer and digitalization. The market is expected to witness significant growth In the coming years, with applications spanning various sectors, including data centers, telecom, military, aerospace, and consumer electronics. The technology behind AOCs is continually evolving, with advancements in fiber optics technology, laser diodes, and control circuitry expected to further enhance the capabilities of AOCs.

        Market Scope

        Report Coverage

        Details

        Page number

        145

        Base year

        2023

        Historic period

        2018-2022

        Forecast period

        2024-2028

        Growth momentum & CAGR

        Accelerate at a CAGR of 34.73%

        Market growth 2024-2028

        USD 9573.7 million

        Market structure

        Fragmented

        YoY growth 2023-2024(%)

        25.9

        Key countries

        China, US, Japan, South Korea, and Germany

        Competitive landscape

        Leading Companies, Market Positioning of Companies, Competitive Strategies, and Industry Risks

        Request Free Sample

        What are the Key Data Covered in this Active Optical Cable Market Research and Growth Report?

        • CAGR of the Active Optical Cable industry during the forecast period
        • Detailed information on factors that will drive the growth and forecasting between 2024 and 2028
        • Precise estimation of the size of the market and its contribution of the industry in focus to the parent market
        • Accurate predictions about upcoming growth and trends and changes in consumer behaviour
        • Growth of the market across APAC, North America, Europe, South America, and Middle East and Africa
        • Thorough analysis of the market’s competitive landscape and detailed information about companies
        • Comprehensive analysis of factors that will challenge the active optical cable market growth of industry companies

        We can help! Our analysts can customize this active optical cable market research report to meet your requirements.

        Get in touch


        1 Executive Summary

        • 1.1 Market overview
          • Executive Summary - Chart on Market Overview
          • Executive Summary - Data Table on Market Overview
          • Executive Summary - Chart on Global Market Characteristics
          • Executive Summary - Chart on Market by Geography
          • Executive Summary - Chart on Market Segmentation by End-user
          • Executive Summary - Chart on Incremental Growth
          • Executive Summary - Data Table on Incremental Growth
          • Executive Summary - Chart on Company Market Positioning

        2 Market Landscape

        • 2.1 Market ecosystem
          • Parent Market
          • Data Table on - Parent Market
        • 2.2 Market characteristics
          • Market characteristics analysis
        • 2.3 Value chain analysis
          • Value Chain Analysis

        3 Market Sizing

        • 3.1 Market definition
          • Offerings of companies included in the market definition
        • 3.2 Market segment analysis
          • Market segments
        • 3.3 Market size 2023
          • 3.4 Market outlook: Forecast for 2023-2028
            • Chart on Global - Market size and forecast 2023-2028 ($ million)
            • Data Table on Global - Market size and forecast 2023-2028 ($ million)
            • Chart on Global Market: Year-over-year growth 2023-2028 (%)
            • Data Table on Global Market: Year-over-year growth 2023-2028 (%)

          4 Historic Market Size

          • 4.1 Global Active Optical Cable Market 2018 - 2022
            • Historic Market Size - Data Table on Global Active Optical Cable Market 2018 - 2022 ($ million)
          • 4.2 End-user segment analysis 2018 - 2022
            • Historic Market Size - End-user Segment 2018 - 2022 ($ million)
          • 4.3 Geography segment analysis 2018 - 2022
            • Historic Market Size - Geography Segment 2018 - 2022 ($ million)
          • 4.4 Country segment analysis 2018 - 2022
            • Historic Market Size - Country Segment 2018 - 2022 ($ million)

          5 Five Forces Analysis

          • 5.1 Five forces summary
            • Five forces analysis - Comparison between 2023 and 2028
          • 5.2 Bargaining power of buyers
            • Bargaining power of buyers - Impact of key factors 2023 and 2028
          • 5.3 Bargaining power of suppliers
            • Bargaining power of suppliers - Impact of key factors in 2023 and 2028
          • 5.4 Threat of new entrants
            • Threat of new entrants - Impact of key factors in 2023 and 2028
          • 5.5 Threat of substitutes
            • Threat of substitutes - Impact of key factors in 2023 and 2028
          • 5.6 Threat of rivalry
            • Threat of rivalry - Impact of key factors in 2023 and 2028
          • 5.7 Market condition
            • Chart on Market condition - Five forces 2023 and 2028

          6 Market Segmentation by End-user

          • 6.1 Market segments
            • Chart on End-user - Market share 2023-2028 (%)
            • Data Table on End-user - Market share 2023-2028 (%)
          • 6.2 Comparison by End-user
            • Chart on Comparison by End-user
            • Data Table on Comparison by End-user
          • 6.3 Data center - Market size and forecast 2023-2028
            • Chart on Data center - Market size and forecast 2023-2028 ($ million)
            • Data Table on Data center - Market size and forecast 2023-2028 ($ million)
            • Chart on Data center - Year-over-year growth 2023-2028 (%)
            • Data Table on Data center - Year-over-year growth 2023-2028 (%)
          • 6.4 Consumer electronics - Market size and forecast 2023-2028
            • Chart on Consumer electronics - Market size and forecast 2023-2028 ($ million)
            • Data Table on Consumer electronics - Market size and forecast 2023-2028 ($ million)
            • Chart on Consumer electronics - Year-over-year growth 2023-2028 (%)
            • Data Table on Consumer electronics - Year-over-year growth 2023-2028 (%)
          • 6.5 High performance computing - Market size and forecast 2023-2028
            • Chart on High performance computing - Market size and forecast 2023-2028 ($ million)
            • Data Table on High performance computing - Market size and forecast 2023-2028 ($ million)
            • Chart on High performance computing - Year-over-year growth 2023-2028 (%)
            • Data Table on High performance computing - Year-over-year growth 2023-2028 (%)
          • 6.6 Telecommunication - Market size and forecast 2023-2028
            • Chart on Telecommunication - Market size and forecast 2023-2028 ($ million)
            • Data Table on Telecommunication - Market size and forecast 2023-2028 ($ million)
            • Chart on Telecommunication - Year-over-year growth 2023-2028 (%)
            • Data Table on Telecommunication - Year-over-year growth 2023-2028 (%)
          • 6.7 Others - Market size and forecast 2023-2028
            • Chart on Others - Market size and forecast 2023-2028 ($ million)
            • Data Table on Others - Market size and forecast 2023-2028 ($ million)
            • Chart on Others - Year-over-year growth 2023-2028 (%)
            • Data Table on Others - Year-over-year growth 2023-2028 (%)
          • 6.8 Market opportunity by End-user
            • Market opportunity by End-user ($ million)
            • Data Table on Market opportunity by End-user ($ million)

          7 Customer Landscape

          • 7.1 Customer landscape overview
            • Analysis of price sensitivity, lifecycle, customer purchase basket, adoption rates, and purchase criteria

          8 Geographic Landscape

          • 8.1 Geographic segmentation
            • Chart on Market share by geography 2023-2028 (%)
            • Data Table on Market share by geography 2023-2028 (%)
          • 8.2 Geographic comparison
            • Chart on Geographic comparison
            • Data Table on Geographic comparison
          • 8.3 APAC - Market size and forecast 2023-2028
            • Chart on APAC - Market size and forecast 2023-2028 ($ million)
            • Data Table on APAC - Market size and forecast 2023-2028 ($ million)
            • Chart on APAC - Year-over-year growth 2023-2028 (%)
            • Data Table on APAC - Year-over-year growth 2023-2028 (%)
          • 8.4 North America - Market size and forecast 2023-2028
            • Chart on North America - Market size and forecast 2023-2028 ($ million)
            • Data Table on North America - Market size and forecast 2023-2028 ($ million)
            • Chart on North America - Year-over-year growth 2023-2028 (%)
            • Data Table on North America - Year-over-year growth 2023-2028 (%)
          • 8.5 Europe - Market size and forecast 2023-2028
            • Chart on Europe - Market size and forecast 2023-2028 ($ million)
            • Data Table on Europe - Market size and forecast 2023-2028 ($ million)
            • Chart on Europe - Year-over-year growth 2023-2028 (%)
            • Data Table on Europe - Year-over-year growth 2023-2028 (%)
          • 8.6 South America - Market size and forecast 2023-2028
            • Chart on South America - Market size and forecast 2023-2028 ($ million)
            • Data Table on South America - Market size and forecast 2023-2028 ($ million)
            • Chart on South America - Year-over-year growth 2023-2028 (%)
            • Data Table on South America - Year-over-year growth 2023-2028 (%)
          • 8.7 Middle East and Africa - Market size and forecast 2023-2028
            • Chart on Middle East and Africa - Market size and forecast 2023-2028 ($ million)
            • Data Table on Middle East and Africa - Market size and forecast 2023-2028 ($ million)
            • Chart on Middle East and Africa - Year-over-year growth 2023-2028 (%)
            • Data Table on Middle East and Africa - Year-over-year growth 2023-2028 (%)
          • 8.8 China - Market size and forecast 2023-2028
            • Chart on China - Market size and forecast 2023-2028 ($ million)
            • Data Table on China - Market size and forecast 2023-2028 ($ million)
            • Chart on China - Year-over-year growth 2023-2028 (%)
            • Data Table on China - Year-over-year growth 2023-2028 (%)
          • 8.9 US - Market size and forecast 2023-2028
            • Chart on US - Market size and forecast 2023-2028 ($ million)
            • Data Table on US - Market size and forecast 2023-2028 ($ million)
            • Chart on US - Year-over-year growth 2023-2028 (%)
            • Data Table on US - Year-over-year growth 2023-2028 (%)
          • 8.10 Japan - Market size and forecast 2023-2028
            • Chart on Japan - Market size and forecast 2023-2028 ($ million)
            • Data Table on Japan - Market size and forecast 2023-2028 ($ million)
            • Chart on Japan - Year-over-year growth 2023-2028 (%)
            • Data Table on Japan - Year-over-year growth 2023-2028 (%)
          • 8.11 South Korea - Market size and forecast 2023-2028
            • Chart on South Korea - Market size and forecast 2023-2028 ($ million)
            • Data Table on South Korea - Market size and forecast 2023-2028 ($ million)
            • Chart on South Korea - Year-over-year growth 2023-2028 (%)
            • Data Table on South Korea - Year-over-year growth 2023-2028 (%)
          • 8.12 Germany - Market size and forecast 2023-2028
            • Chart on Germany - Market size and forecast 2023-2028 ($ million)
            • Data Table on Germany - Market size and forecast 2023-2028 ($ million)
            • Chart on Germany - Year-over-year growth 2023-2028 (%)
            • Data Table on Germany - Year-over-year growth 2023-2028 (%)
          • 8.13 Market opportunity by geography
            • Market opportunity by geography ($ million)
            • Data Tables on Market opportunity by geography ($ million)

          9 Drivers, Challenges, and Opportunity/Restraints

          • 9.1 Market drivers
            • 9.2 Market challenges
              • 9.3 Impact of drivers and challenges
                • Impact of drivers and challenges in 2023 and 2028
              • 9.4 Market opportunities/restraints

                10 Competitive Landscape

                • 10.1 Overview
                  • 10.2 Competitive Landscape
                    • Overview on criticality of inputs and factors of differentiation
                  • 10.3 Landscape disruption
                    • Overview on factors of disruption
                  • 10.4 Industry risks
                    • Impact of key risks on business

                  11 Competitive Analysis

                  • 11.1 Companies profiled
                    • Companies covered
                  • 11.2 Market positioning of companies
                    • Matrix on companies position and classification
                  • 3M Co.
                    • 3M Co. - Overview
                    • 3M Co. - Business segments
                    • 3M Co. - Key news
                    • 3M Co. - Key offerings
                    • 3M Co. - Segment focus
                  • 11.4 Amphenol Corp.
                    • Amphenol Corp. - Overview
                    • Amphenol Corp. - Business segments
                    • Amphenol Corp. - Key news
                    • Amphenol Corp. - Key offerings
                    • Amphenol Corp. - Segment focus
                  • 11.5 Broadcom Inc.
                    • Broadcom Inc. - Overview
                    • Broadcom Inc. - Business segments
                    • Broadcom Inc. - Key news
                    • Broadcom Inc. - Key offerings
                    • Broadcom Inc. - Segment focus
                  • 11.6 Emcore Corp.
                    • Emcore Corp. - Overview
                    • Emcore Corp. - Business segments
                    • Emcore Corp. - Key offerings
                    • Emcore Corp. - Segment focus
                  • 11.7 Fujitsu Ltd.
                    • Fujitsu Ltd. - Overview
                    • Fujitsu Ltd. - Business segments
                    • Fujitsu Ltd. - Key news
                    • Fujitsu Ltd. - Key offerings
                    • Fujitsu Ltd. - Segment focus
                  • 11.8 Hitachi Ltd.
                    • Hitachi Ltd. - Overview
                    • Hitachi Ltd. - Business segments
                    • Hitachi Ltd. - Key news
                    • Hitachi Ltd. - Key offerings
                    • Hitachi Ltd. - Segment focus
                  • 11.9 II VI Inc.
                    • II VI Inc. - Overview
                    • II VI Inc. - Business segments
                    • II VI Inc. - Key news
                    • II VI Inc. - Key offerings
                    • II VI Inc. - Segment focus
                  • 11.10 Leoni AG
                    • Leoni AG - Overview
                    • Leoni AG - Business segments
                    • Leoni AG - Key offerings
                    • Leoni AG - Segment focus
                  • 11.11 Optomind Inc.
                    • Optomind Inc. - Overview
                    • Optomind Inc. - Product / Service
                    • Optomind Inc. - Key offerings
                  • 11.12 SANWA DENKI KOGYO Co.Ltd.
                    • SANWA DENKI KOGYO Co.Ltd. - Overview
                    • SANWA DENKI KOGYO Co.Ltd. - Product / Service
                    • SANWA DENKI KOGYO Co.Ltd. - Key offerings

                  12 Appendix

                  • 12.1 Scope of the report
                    • 12.2 Inclusions and exclusions checklist
                      • Inclusions checklist
                      • Exclusions checklist
                    • 12.3 Currency conversion rates for US$
                      • Currency conversion rates for US$
                    • 12.4 Research methodology
                      • Research methodology
                    • 12.5 Data procurement
                      • Information sources
                    • 12.6 Data validation
                      • Data validation
                    • 12.7 Validation techniques employed for market sizing
                      • Validation techniques employed for market sizing
                    • 12.8 Data synthesis
                      • Data synthesis
                    • 12.9 360 degree market analysis
                      • 360 degree market analysis
                    • 12.10 List of abbreviations
                      • List of abbreviations

                    Research Methodology

                    Technavio presents a detailed picture of the market by way of study, synthesis, and summation of data from multiple sources. The analysts have presented the various facets of the market with a particular focus on identifying the key industry influencers. The data thus presented is comprehensive, reliable, and the result of extensive research, both primary and secondary.

                    INFORMATION SOURCES

                    Primary sources

                    • Manufacturers and suppliers
                    • Channel partners
                    • Industry experts
                    • Strategic decision makers

                    Secondary sources

                    • Industry journals and periodicals
                    • Government data
                    • Financial reports of key industry players
                    • Historical data
                    • Press releases

                    DATA ANALYSIS

                    Data Synthesis

                    • Collation of data
                    • Estimation of key figures
                    • Analysis of derived insights

                    Data Validation

                    • Triangulation with data models
                    • Reference against proprietary databases
                    • Corroboration with industry experts

                    REPORT WRITING

                    Qualitative

                    • Market drivers
                    • Market challenges
                    • Market trends
                    • Five forces analysis

                    Quantitative

                    • Market size and forecast
                    • Market segmentation
                    • Geographical insights
                    • Competitive landscape

                    Interested in this report?

                    Get your sample now to see our research methodology and insights!

                    Download Now

                    Frequently Asked Questions

                    Active Optical Cable market growth will increase by $ 9573.7 mn during 2024-2028 .

                    The Active Optical Cable market is expected to grow at a CAGR of 34.73% during 2024-2028 .

                    Active Optical Cable market is segmented by End-user( Data center, Consumer electronics, High performance computing, Telecommunication, Others)

                    3M Co., Amphenol Corp., Broadcom Inc., Emcore Corp., Fujikura Co. Ltd., Fujitsu Ltd., GIGALIGHT, Hitachi Ltd., International Business Machines Corp., II VI Inc., Koch Industries Inc., Leoni AG, Lumentum Holdings Inc., Optomind Inc., SANWA DENKI KOGYO Co.Ltd., Sopto Technology Co. Ltd., Sumitomo Electric Industries Ltd., TE Connectivity Ltd., The Siemon Co., Yangtze Optical Fibre and Cable Joint Stock Ltd. Co. are a few of the key vendors in the Active Optical Cable market.

                    APAC will register the highest growth rate of 52% among the other regions. Therefore, the Active Optical Cable market in APAC is expected to garner significant business opportunities for the vendors during the forecast period.

                    China, US, Japan, South Korea, Germany

                    • Expansion of data centersData centers have become an important part of almost all business enterprises. Massive growth in the data generated by in IT and telecommunication companies has compelled several vendors to build data centers of their own or lease data center space. The growing focus on cloud computing will drive the need for data centers during the forecast period. Several firms have been investing in the construction of data centers is the driving factor this market.
                    • and some examples are provided below: In May 2022 is the driving factor this market.
                    • NTT DATA Corporation announced the unveiling of a new data center campus in Maharashtra is the driving factor this market.
                    • India. The new data center has the capacity to host 5 is the driving factor this market.
                    • 000 racks and support over 30 MW of IT load. In March 2021 is the driving factor this market.
                    • Amazon.com Inc announced a plan worth $2.77 billion to set up world-class data centers in Telangana is the driving factor this market.
                    • India. Through this initiative is the driving factor this market.
                    • the new AWS Asia Region is expected to join other AWS Zones in Australia is the driving factor this market.
                    • Greater China is the driving factor this market.
                    • Japan is the driving factor this market.
                    • Korea is the driving factor this market.
                    • and Singapore.In May 2021 is the driving factor this market.
                    • Liberty Global and Digital Colony launched AtlasEdge to run 100+ Edge data centers in Europe.Several investments are being made in the construction of data centers is the driving factor this market.
                    • which indicates the growing need for these data centers to support the enormous expansion in data volumes. Thus is the driving factor this market.
                    • the growing demand for data centers also increases the need for active optical cables for faster data transmission is the driving factor this market.
                    • which will drive the growth of the global active optical cable market during the forecast period. is the driving factor this market.

                    The Active Optical Cable market vendors should focus on grabbing business opportunities from the Data center segment as it accounted for the largest market share in the base year.