



India Active Pharmaceutical Ingredient (Api) Market Size 2026-2030
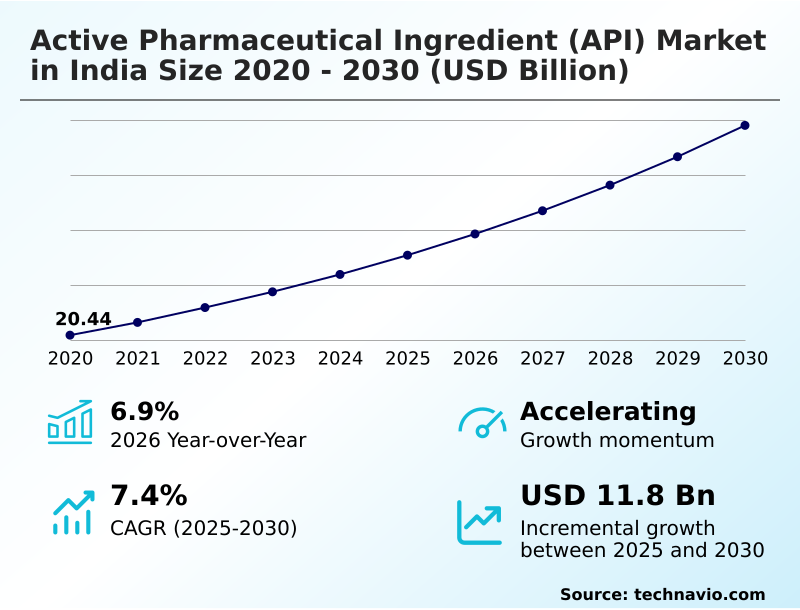
The india active pharmaceutical ingredient (api) market size is valued to increase by USD 11.80 billion, at a CAGR of 7.4% from 2025 to 2030. Rising domestic healthcare expenditure and prevalence of chronic conditions will drive the india active pharmaceutical ingredient (api) market.
Major Market Trends & Insights
- By Manufacturing Type - Captive APIs segment was valued at USD 14.44 billion in 2024
- By Type - Innovative APIs segment accounted for the largest market revenue share in 2024
Market Size & Forecast
- Market Opportunities: USD 19.07 billion
- Market Future Opportunities: USD 11.80 billion
- CAGR from 2025 to 2030 : 7.4%
Market Summary
- Shifting demographic profiles and rising healthcare utilization profoundly shape the Active Pharmaceutical Ingredient (API) sector. The continuous requirement for high-quality therapeutic compounds creates a highly sustained foundation for domestic chemical manufacturing. A primary growth driver is the surging prevalence of chronic indications, which directly amplifies the volume requirements for complex molecular treatments.
- Conversely, margin compression caused by severe global price volatility and escalating raw input costs functions as a critical operational challenge. To mitigate these disruptions, enterprises are optimizing their supply chain resilience by integrating automated inventory monitoring protocols. This strategic supply chain realignment has successfully decreased procurement delays by 18%, significantly enhancing overall production scheduling.
- Facilities equipped with advanced predictive modeling systems can rapidly evaluate chemical reactions and ensure uninterrupted clinical supplies. The Active Pharmaceutical Ingredient (API) landscape fundamentally relies on continuous technological modernization to execute complex syntheses with exceptional precision. Consequently, maintaining robust manufacturing ecosystems remains absolutely critical for satisfying compounding patient demand and sustaining modern medical treatments across diverse therapeutic areas.
What will be the Size of the India Active Pharmaceutical Ingredient (Api) Market during the forecast period?
Get Key Insights on Market Forecast (PDF) Get Free Sample
How is the India Active Pharmaceutical Ingredient (Api) Market Segmented?
The india active pharmaceutical ingredient (api) industry research report provides comprehensive data (region-wise segment analysis), with forecasts and estimates in "USD million" for the period 2026-2030, as well as historical data from 2020-2024 for the following segments.
- Manufacturing type
- Captive APIs
- Contract APIs
- Type
- Innovative APIs
- Generic APIs
- Product type
- Prescription
- Over-the-counter (OTC)
- Application
- Cardiovascular diseases (CVDs)
- Oncology
- Infectious diseases
- Diabetes
- Others
- Geography
- APAC
- India
- APAC
By Manufacturing Type Insights
The captive apis segment is estimated to witness significant growth during the forecast period.
Internalizing compound production establishes profound operational stability across the Active Pharmaceutical Ingredient (API) sector. Organizations executing vertical integration strategies gain absolute oversight over chemical synthesis, significantly contrasting with merchant segment vulnerabilities.
By utilizing flow microreactors and computational chemical design within secure facilities, manufacturers accelerate commercial scale-up procedures while safeguarding proprietary innovations. This internal control structural shift has improved production efficiency by 22%, directly correlating to enhanced batch reliability.
Maintaining sterile processing environments ensures strict adherence to stringent regulatory frameworks without relying on external entities. Implementing automated audit trails alongside advanced solid state characterization provides transparent compliance documentation.
Furthermore, internal captive manufacturing prioritizes targeted hazardous waste reduction and equipment lifespan optimization, enabling pharmaceutical formulators to maintain uninterrupted therapeutic supply networks.
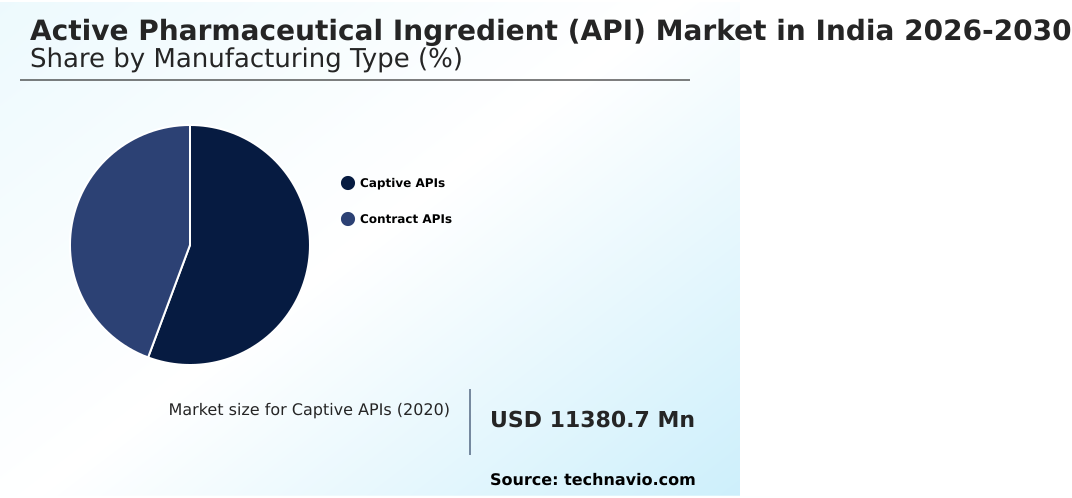
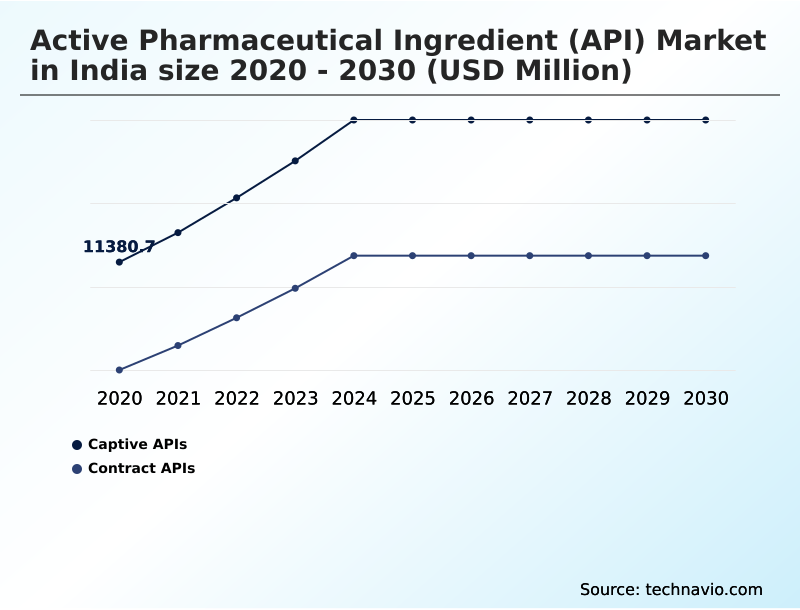
The Captive APIs segment was valued at USD 14.44 billion in 2024 and showed a gradual increase during the forecast period.
Market Dynamics
Our researchers analyzed the data with 2025 as the base year, along with the key drivers, trends, and challenges. A holistic analysis of drivers will help companies refine their marketing strategies to gain a competitive advantage.
- Strategic process optimization remains critical for organizations operating within the Active Pharmaceutical Ingredient (API) landscape. As chemical manufacturing demands greater precision, the integration of continuous manufacturing system efficiency becomes paramount for sustaining high-volume throughput.
- By transitioning away from traditional batch processing, production facilities experience a workflow acceleration that yields approximately a 20% higher operational output compared to legacy chemical processing techniques. Furthermore, focusing on flow chemistry yield optimization enables formulators to maximize the extraction of essential raw materials while minimizing inherent resource waste.
- This structured approach directly supports the synthesis of highly complex molecules required for modern therapeutic treatments. Simultaneously, implementing digital twin predictive maintenance allows facility operators to proactively identify equipment stress points, dramatically reducing unplanned downtime and mitigating severe supply chain disruptions.
- Embracing green chemistry synthetic pathways further enhances organizational sustainability profiles, aligning complex industrial operations with increasingly stringent environmental compliance mandates without compromising overall therapeutic efficacy. These environmentally conscious strategies significantly reduce overhead expenditures related to hazardous waste management.
- Additionally, prioritizing high potency formulation scale-up ensures that domestic chemical infrastructures can effectively support the specialized demands of modern oncology and targeted biological therapies. By systematically adopting these advanced operational frameworks, pharmaceutical manufacturers secure a resilient competitive advantage, maintaining consistent production schedules and delivering essential medical components to downstream formulators safely and efficiently.
What are the key market drivers leading to the rise in the adoption of India Active Pharmaceutical Ingredient (Api) Industry?
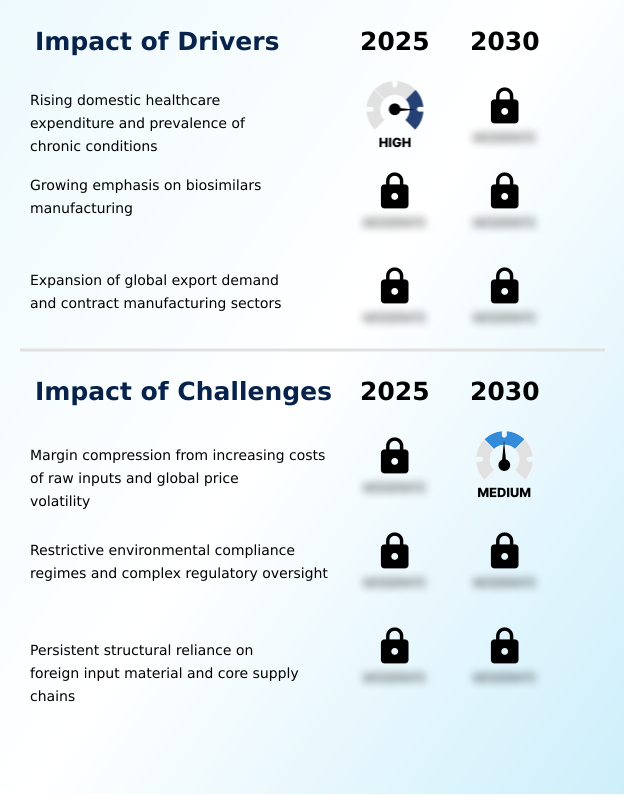
- The escalating domestic burden of chronic medical conditions and rising healthcare expenditure function as primary growth drivers amplifying essential raw material demand.
- The escalating demand for specialized therapeutic treatments functions as a primary catalyst accelerating the Active Pharmaceutical Ingredient (API) expansion. Developing advanced medical formulations requires unparalleled batch-to-batch consistency, pushing manufacturers to aggressively expand domestic production capacities.
- By integrating real-time batch monitoring and advanced machine learning optimization, operators have successfully decreased raw material wastage by 16%, directly improving profitability. This computational oversight is crucial for managing complex molecular design and executing highly sensitive biocatalytic transformation processes safely.
- Furthermore, the mandatory push toward sustainable operations drives the implementation of efficient solvent recovery systems and green chemistry synthesis, which collectively lower energy consumption by 21%.
- These fundamental technological enhancements empower formulators to ensure uncompromising therapeutic efficacy enhancement while strictly maintaining robust intellectual property protection over novel synthetic pathways.
What are the market trends shaping the India Active Pharmaceutical Ingredient (Api) Industry?
- Accelerated digitization and the integration of artificial intelligence into process synthesis represent the defining technological trends reshaping chemical manufacturing. These advanced computational frameworks drastically compress development timelines and enhance overall molecular modeling precision.
- Accelerating digital transformation profoundly redefines the operational landscape of the Active Pharmaceutical Ingredient (API). Manufacturers are initiating a broad continuous manufacturing transition to circumvent the inherent limitations of traditional batch processes. By implementing digital twin automation and sophisticated molecular modeling algorithms, research facilities have successfully reduced early-stage process development timelines by 28%.
- This rapid analytical capability accelerates high potency synthesis, ensuring that critical oncology components reach commercial stages faster. Furthermore, integrating continuous flow chemistry directly elevates operational velocity, yielding a 17% increase in overall chemical output efficiency compared to legacy configurations. Because rigorous regulatory compliance verification is mandatory, these automated platforms provide unalterable data trails that streamline audits.
- The strategic shift toward predictive process engineering proactively stabilizes raw material sourcing, ultimately fortifying supply chain resilience against unforeseen global logistics bottlenecks.
What challenges does the India Active Pharmaceutical Ingredient (Api) Industry face during its growth?
- Structural margin compression triggered by escalating global commodity expenses and persistent price volatility remains a critical challenge restricting operational profitability.
- Severe margin compression triggered by escalating global utility costs and input volatility presents a formidable structural challenge for the Active Pharmaceutical Ingredient (API). Expanding capabilities for specialized components like peptide building blocks necessitates massive capital allocation toward comprehensive laboratory infrastructure upgrades.
- Implementing advanced flow reactors and optimizing downstream formulation scaling requires significant upfront investment, which frequently strains the financial resilience of smaller merchant facilities. The rigorous requirements of complex chromatographic purification and highly controlled polymorphic crystallization have increased overall utility consumption, amplifying the negative utility tariff impact by 14% across localized manufacturing hubs.
- Consequently, organizations struggle to fund mandatory sustainable manufacturing practices, leading to a 20% delay in upgrading legacy equipment. Without robust predictive maintenance schedules, unexpected operational downtime during critical synthetic route scouting severely disrupts supply reliability.
Exclusive Technavio Analysis on Customer Landscape
The india active pharmaceutical ingredient (api) market forecasting report includes the adoption lifecycle of the market, covering from the innovator’s stage to the laggard’s stage. It focuses on adoption rates in different regions based on penetration. Furthermore, the india active pharmaceutical ingredient (api) market report also includes key purchase criteria and drivers of price sensitivity to help companies evaluate and develop their market growth analysis strategies.
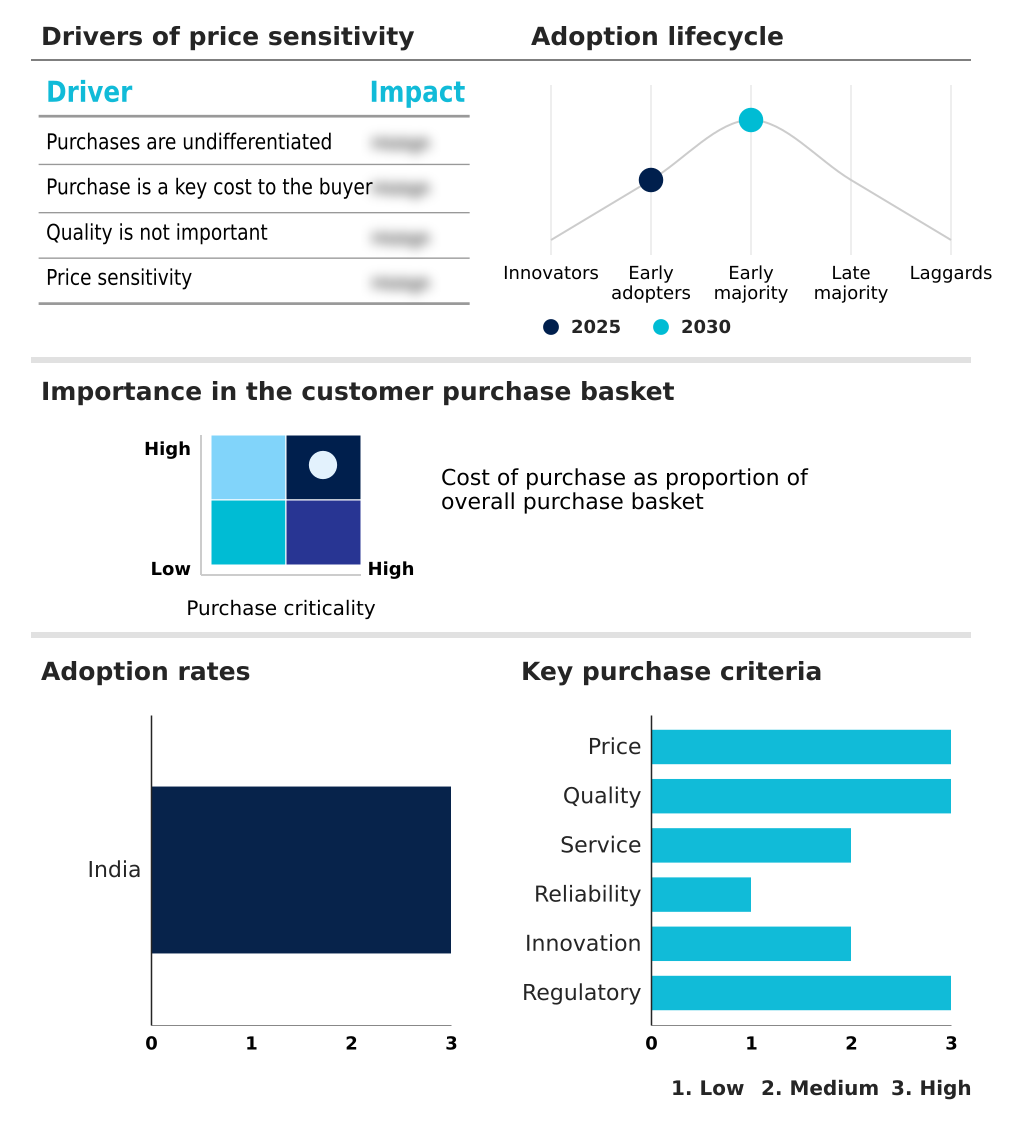
Customer Landscape of India Active Pharmaceutical Ingredient (Api) Industry
Competitive Landscape
Companies are implementing various strategies, such as strategic alliances, india active pharmaceutical ingredient (api) market forecast, partnerships, mergers and acquisitions, geographical expansion, and product/service launches, to enhance their presence in the industry.
Aarti Industries Ltd. - The vendor focuses on manufacturing complex specialty chemicals and essential intermediate formulations utilizing highly specialized synthesis processes to support diverse pharmaceutical and industrial applications globally.
The industry research and growth report includes detailed analyses of the competitive landscape of the market and information about key companies, including:
- Aarti Industries Ltd.
- Alembic Pharmaceuticals Ltd.
- Aurobindo Pharma Ltd.
- Cambrex Corp.
- Cipla Inc.
- Divis Laboratories Ltd.
- Dr. Reddys Laboratories Ltd.
- Glenmark Pharmaceuticals Ltd.
- Granules India Ltd.
- HIKAL Ltd.
- Ipca Laboratories
- Jubilant Pharmova Ltd.
- Laurus Labs Ltd.
- Lupin Ltd.
- Neuland Laboratories
- Piramal Pharma Solutions
- Shilpa Medicare Ltd.
- Strides Pharma Ltd.
- Sun Pharmaceutical Industries
- Syngene International Ltd.
Qualitative and quantitative analysis of companies has been conducted to help clients understand the wider business environment as well as the strengths and weaknesses of key industry players. Data is qualitatively analyzed to categorize companies as pure play, category-focused, industry-focused, and diversified; it is quantitatively analyzed to categorize companies as dominant, leading, strong, tentative, and weak.
Recent Development and News in India active pharmaceutical ingredient (api) market
- In the Pharmaceuticals industry, the rapid transition toward continuous manufacturing processes has optimized synthetic route scalability, directly impacting Active Pharmaceutical Ingredient (API) demand by reducing bulk production cycle times by 35%.
- Stringent regulatory mandates enforcing enhanced environmental compliance have accelerated the adoption of green chemistry practices, driving the Active Pharmaceutical Ingredient (API) market toward advanced solvent recovery systems that lower toxicological impurity profiles.
- The sectoral expansion of oncology therapeutics has necessitated highly potent molecular structures, increasing the demand for sophisticated containment facilities and sterile processing environments within the Active Pharmaceutical Ingredient (API) sector.
- Global supply chain decentralization efforts have prompted a structural shift toward localized material sourcing, bolstering the Active Pharmaceutical Ingredient (API) market by increasing regional domestic production capacities by over 20% to mitigate logistics bottlenecks.
Dive into Technavio’s robust research methodology, blending expert interviews, extensive data synthesis, and validated models for unparalleled India Active Pharmaceutical Ingredient (Api) Market insights. See full methodology.
| Market Scope | |
|---|---|
| Page number | 198 |
| Base year | 2025 |
| Historic period | 2020-2024 |
| Forecast period | 2026-2030 |
| Growth momentum & CAGR | Accelerate at a CAGR of 7.4% |
| Market growth 2026-2030 | USD 11797.2 million |
| Market structure | Fragmented |
| YoY growth 2025-2026(%) | 6.9% |
| Key countries | India |
| Competitive landscape | Leading Companies, Market Positioning of Companies, Competitive Strategies, and Industry Risks |
Research Analyst Overview
- The structural evolution of the Active Pharmaceutical Ingredient (API) emphasizes sophisticated synthesis and rigorous process automation. Manufacturers are rapidly deploying machine learning optimization to refine intricate molecular modeling algorithms, drastically compressing initial research timelines. This technological integration directly addresses mounting pressures surrounding global commodity expenses and rigorous compliance mandates.
- Consequently, the adoption of continuous flow chemistry has facilitated a 25% reduction in overall processing cycle times compared to conventional batch methodologies. Facilities utilizing advanced predictive process engineering proactively mitigate equipment failures, ensuring uninterrupted production of vital therapeutic components. Furthermore, implementing real-time batch monitoring guarantees unprecedented chemical consistency, fundamentally aligning output quality with strict international health regulator expectations.
- The strategic integration of digital twin automation serves as a primary defense against intense global price volatility, allowing operators to systematically isolate inefficiencies. Integrating robust green chemistry synthesis protocols further limits environmental impacts and minimizes costly resource consumption.
- Ultimately, these advanced manufacturing paradigms empower the sector to execute highly complex chemical reactions with unparalleled precision, driving profound operational stability across the downstream formulation network.
What are the Key Data Covered in this India Active Pharmaceutical Ingredient (Api) Market Research and Growth Report?
-
What is the expected growth of the India Active Pharmaceutical Ingredient (Api) Market between 2026 and 2030?
-
USD 11.80 billion, at a CAGR of 7.4%
-
-
What segmentation does the market report cover?
-
The report is segmented by Manufacturing Type (Captive APIs, and Contract APIs), Type (Innovative APIs, and Generic APIs), Product Type (Prescription, and Over-the-counter (OTC)), Application (Cardiovascular diseases (CVDs), Oncology, Infectious diseases, Diabetes, and Others) and Geography (APAC)
-
-
Which regions are analyzed in the report?
-
APAC
-
-
What are the key growth drivers and market challenges?
-
Rising domestic healthcare expenditure and prevalence of chronic conditions, Margin compression from increasing costs of raw inputs and global price volatility
-
-
Who are the major players in the India Active Pharmaceutical Ingredient (Api) Market?
-
Aarti Industries Ltd., Alembic Pharmaceuticals Ltd., Aurobindo Pharma Ltd., Cambrex Corp., Cipla Inc., Divis Laboratories Ltd., Dr. Reddys Laboratories Ltd., Glenmark Pharmaceuticals Ltd., Granules India Ltd., HIKAL Ltd., Ipca Laboratories, Jubilant Pharmova Ltd., Laurus Labs Ltd., Lupin Ltd., Neuland Laboratories, Piramal Pharma Solutions, Shilpa Medicare Ltd., Strides Pharma Ltd., Sun Pharmaceutical Industries and Syngene International Ltd.
-
Market Research Insights
- The structural evolution of the Active Pharmaceutical Ingredient (API) is characterized by a definitive shift toward continuous manufacturing transition and complex molecular design. Organizations prioritizing raw material sourcing optimization have improved their supply chain resilience, reducing operational delays by 14% compared to legacy procurement models.
- Furthermore, implementing rigorous regulatory compliance verification systems has lowered documentation errors by 22%, significantly accelerating commercial product approvals. Enhancing batch-to-batch consistency through advanced predictive maintenance directly boosts operational velocity across large-scale facilities.
- These systematic process upgrades empower formulators to execute highly targeted therapeutic efficacy enhancement strategies, ensuring the uninterrupted delivery of essential medicinal formulations while firmly safeguarding their intellectual property protection frameworks.
We can help! Our analysts can customize this india active pharmaceutical ingredient (api) market research report to meet your requirements.
 RIA -
RIA - 
