Adaptive Driving Equipment Market Analysis North America, Europe, APAC, South America, Middle East and Africa - US, Canada, China, Germany, UK - Size and Forecast 2024-2028

Adaptive Driving Equipment Market Analysis North America, Europe, APAC, South America, Middle East and Africa - US, Canada, China, Germany, UK - Size and Forecast 2024-2028

Published: Dec 2023 164 Pages SKU: IRTNTR77050

Market Overview at a Glance

$1.51 B
Market Opportunity
7.71%
CAGR
7.07
YoY growth 2023-2024(%)

Adaptive Driving Equipment Market 2024-2028

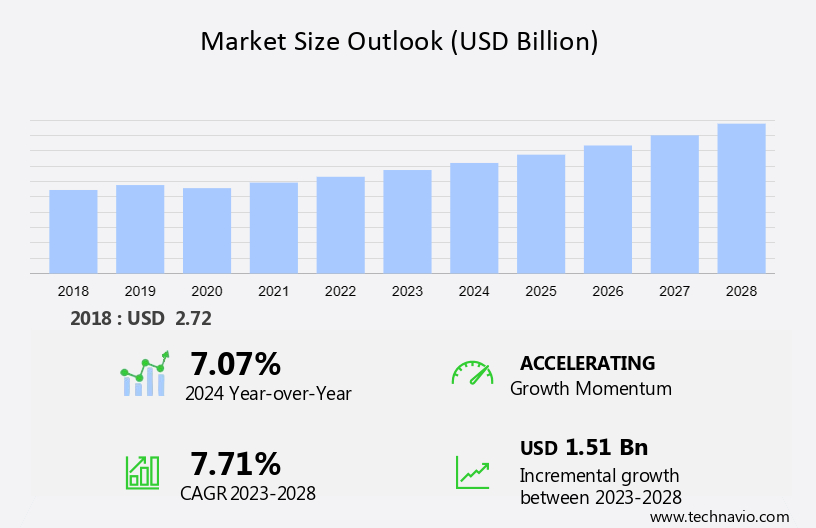
The adaptive driving equipment market size is forecast to increase by USD 1.51 billion with a growth at a CAGR of 7.71% between 2024 and 2028. The growth rate of the market depends on several factors such as the rising aging population, the increasing urbanization leading to increased demand for adaptive driving equipment, and the rising awareness about accessibility driving adaptive equipment.

The report includes a comprehensive outlook on the Adaptive Driving Equipment Market, offering forecasts for the industry segmented by Application, which comprises passenger car and commercial vehicle. Additionally, it categorizes Type into wheelchair and scooter lifts, wheelchair securements, hand controls, and swivel seatings, and covers Regions, including North America, Europe, APAC, South America, and Middle East and Africa. The report provides market size, historical data spanning from 2018 to 2022, and future projections, all presented in terms of value in USD million for each of the mentioned segments.

What will be the Size of the Adaptive Driving Equipment Market During the Forecast Period?

Adaptive Driving Equipment Market Size

Adaptive Driving Equipment Market Forecast 2024-2028

To learn more about this report,  Request Free Sample

Adaptive Driving Equipment Market Dynamics

Driver- Rising aging population

As people age, they may experience mobility challenges, making it difficult to drive safely without assistance. The demand for adaptive driving solutions is increasing rapidly among the old age population. Older individuals often value their independence and autonomy. Adaptive driving equipment enables them to continue driving safely, maintaining a sense of self-sufficiency and freedom. Adaptive driving equipment contributes to an improved quality of life for seniors by enabling them to participate in social activities, run errands, and maintain a sense of normalcy, which is crucial for mental and emotional well-being.

Furthermore, age-related conditions, like reduced reaction times, diminished vision, or physical limitations, can impact driving ability. Adaptive driving equipment helps compensate for these challenges, allowing seniors to drive more comfortably. As technology becomes more user-friendly, seniors are increasingly adopting modern solutions. Adaptive driving equipment, incorporating user-friendly interfaces and advanced safety features, aligns with this trend. Therefore, the rising aging population is a key catalyst for the growth of the adaptive driving equipment market, driving innovation and solutions that cater to the mobility challenges associated with aging. Hence, the global adaptive driving equipment market is expected to grow during the forecast period.

Trends- Advancements in assistive technologies in driving adaptive equipment

There are various advancements carried out by the vendors in the global driving adaptive equipment market, such as autonomous driving features, smart Interfaces and connectivity, gesture recognition and voice controls, and sensor technologies, among others. Vendors are increasingly incorporating smart interfaces and connectivity options into adaptive equipment. This allows users to control various aspects of their vehicles using smartphones or other smart devices, improving convenience and accessibility. Advancements in gesture recognition and voice control technologies have made their way into driving adaptive equipment.

Moreover, vendors are also focusing on creating adaptive equipment with highly customizable controls. This allows users to tailor the driving experience to their specific needs and preferences, promoting inclusivity and user satisfaction. Some of the adaptive equipment vendors explore integration with wearable devices, such as smartwatches or specialized control devices. This integration enables users to interact with and control adaptive features more conveniently. Therefore, advancements in assistive technologies in driving adaptive equipment will drive the growth of the global adaptive driving equipment market during the forecast period.

Challenge- High cost of driving adaptive equipment

The cost of adaptive driving equipment can vary widely based on factors such as the type of equipment needed, the extent of vehicle modifications required, and the specific features chosen. Additionally, prices can vary depending on the region, service providers, and individual customization needs. The approximate costs for some of the common types of adaptive driving equipment include hand controls, spinner knobs, pedal extensions, lifts and ramps, and electronic mobility controls, among others.

Moreover, the actual cost can vary based on individual needs, vehicle type, and installation requirements. Also, expenses related to professional installation, consultations, and potential vehicle modifications are considered separately. Therefore, the high cost of driving adaptive equipment is expected to hinder the growth of the global adaptive driving equipment market during the forecast period.

Adaptive Driving Equipment Market Segmentation by Application, Type, and Region

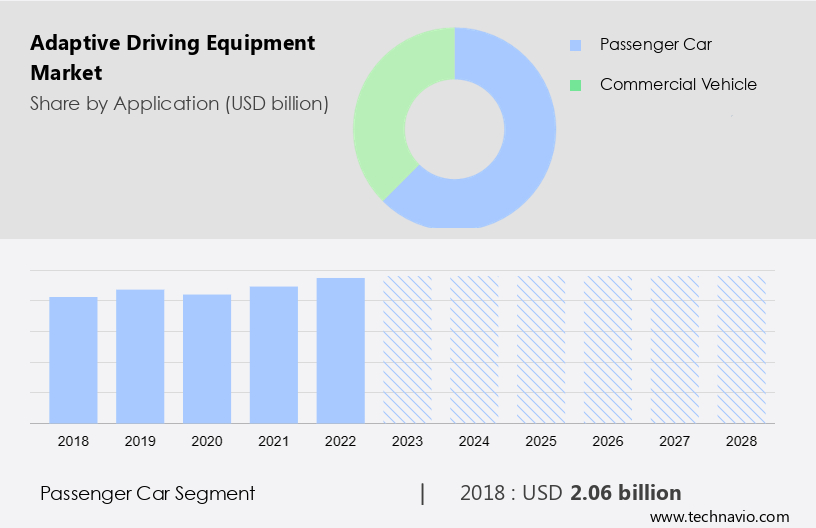
The passenger car segment will account for a major share of the market's growth during the forecast period.? 

Adaptive Driving Equipment Market Size

Customised Report as per your requirements!

The passenger car segment was valued at USD 2.06 billion in 2018. Adaptive driving equipment in passenger cars serves to enhance accessibility and accommodate individuals with diverse mobility needs. Some of the applications of adaptive driving equipment in passenger cars include hand controls, steering modifications, lifts and ramps, and Voice-Activated Systems among others. These applications aim to make driving more inclusive by tailoring the driving environment to the individual needs of people with disabilities, thereby promoting independence and expanding opportunities for mobility. This, in turn, increases the demand for adaptive driving equipment in passenger cars among disabled individuals, thereby driving the growth of the passenger cars of the global adaptive driving equipment market during the forecast period.

Type Segment Analysis

Based on Type, the market has been segmented into wheelchair and scooter lifts, wheelchair securements, hand controls, and swivel seatings. The wheelchair and scooter lifts segment will account for the largest share of this segment. Wheelchair and scooter lifts are essential adaptive driving equipment designed to facilitate the transportation of individuals using wheelchairs or scooters. There are several types of wheelchair and scooter lifts commonly used, such as platform lifts, crane lifts, under-vehicle lifts, side-entry lifts, and automatic door openers. Wheelchair and scooter lifts significantly enhance accessibility to vehicles for individuals using wheelchairs or scooters. They provide a convenient and safe way for individuals to enter and exit vehicles without the need for complex transfers. Therefore, such factors will drive the growth of the wheelchair and scooter lifts segment of the global adaptive driving equipment market during the forecast period.

Regional Analysis

Adaptive Driving Equipment Market Share by Geography

For more insights on the market share of various regions Download Sample PDF now!

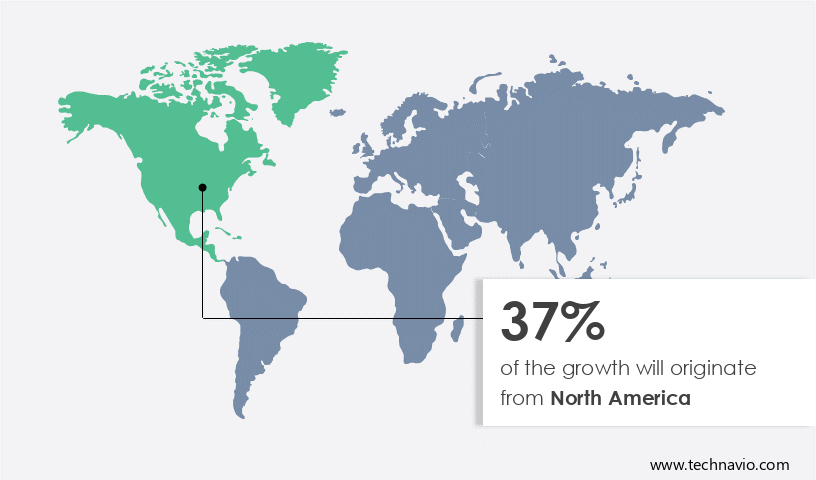
North America is estimated to contribute 37% to the growth by 2027. Technavio’s analysts have elaborately explained the regional trends, drivers, and challenges that are expected to shape the market during the forecast period. In 2021, the US was the major contributor to the adaptive driving equipment market in North America. The country is witnessing the rising demand for adaptive driving equipment technologies, owing to the strong presence of prominent vendors and robust consumer awareness about adaptive driving equipment. Furthermore, North America is one of the front runners in adopting innovative automotive technologies, owing to the large presence of early adopters. Hence, adaptive driving equipment technologies are witnessing significant adoption in the region when compared with other regions.

Additionally, the production of automobiles is rapidly expanding in Mexico, especially in the central states of Aguascalientes and Guanajuato, where the labor costs are relatively lower than those in countries like the US. Automotive OEMs, especially those based in countries such as the US, are expanding their automotive production plants in Mexico, as this will help them to reduce their overall costs. Such factors will increase the market growth in this region during the forecast period.

Who are the Major Adaptive Driving Equipment Market Companies?

Companies are implementing various strategies, such as strategic alliances, partnerships, mergers and acquisitions, geographical expansion, and product/service launches, to enhance their presence in the market.

Adapt Solutions Ltd. - The company offers adaptive driving equipment such as LINK, ASENTO XL SEAT, XL BASE, and XL BOARD.

We also have detailed analyses of the market’s competitive landscape and offer information on 20 market companies, including:

ATConversions, Bruno Independent Living Aids Inc., Drive Master, Elap, Electronic Mobility Controls LLC, FADIEL Italiana Srl, Focaccia Group Srl, Ford Motor Co., Freedom Motors USA, Guidosimplex srl, Handicare Group AB, Jeff Gosling Hand Controls Ltd., Kivi S.r.l, Koller Engineering Ltd., PARAVAN GmbH, Sure Grip Hand Controls, Vantage Mobility International, Veigel GmbH and Co. KG, and BraunAbility

Technavio report provides an in-depth analysis of the market and its players through combined qualitative and quantitative data. The analysis classifies companies into categories based on their business approaches, including pure-play, category-focused, industry-focused, and diversified. Companies are specially categorized into dominant, leading, strong, tentative, and weak, based on their quantitative data analysis.  

Segment Overview

The adaptive driving equipment market report forecasts market growth by revenue at global, regional & country levels and provides an analysis of the latest trends and growth opportunities from 2018 to 2028. 

  • Application Outlook 
    • Passenger car
    • Commercial vehicle
  • Type Outlook 
    • Wheelchair and scooter lifts
    • Wheelchair securements
    • Hand controls
    • Swivel seatings
  • Region Outlook
    • North America
      • The U.S.
      • Canada
    • Europe
      • The U.K.
      • Germany
      • France
      • Rest of Europe
    • APAC
      • China
      • India
    • South America
      • Chile
      • Brazil 
      • Argentina
    • Middle East & Africa
      • Saudi Arabia
      • South Africa
      • Rest of the Middle East & Africa

Adaptive Driving Equipment Market Scope

Report Coverage

Details

Page number

164

Base year

2023

Historic period

2018-2022

Forecast period

2024-2028

Growth momentum & CAGR

Accelerate at a CAGR of 7.71%

Market Growth 2024-2028

USD 1.51 billion

Market structure

Fragmented

YoY growth 2023-2024(%)

7.07

Regional analysis

North America, Europe, APAC, South America, and Middle East and Africa

Performing market contribution

North America at 37%

Key countries

US, Canada, China, Germany, and UK

Competitive landscape

Leading Companies, Market Positioning of Companies, Competitive Strategies, and Industry Risks

Key companies profiled

Adapt Solutions Ltd., ATConversions, Bruno Independent Living Aids Inc., Drive Master, Elap, Electronic Mobility Controls LLC, FADIEL Italiana Srl, Focaccia Group Srl, Ford Motor Co., Freedom Motors USA, Guidosimplex srl, Handicare Group AB, Jeff Gosling Hand Controls Ltd., Kivi S.r.l, Koller Engineering Ltd., PARAVAN GmbH, Sure Grip Hand Controls, Vantage Mobility International, Veigel GmbH and Co. KG, and BraunAbility

Market dynamics

Parent market analysis, Market growth inducers and obstacles, Fast-growing and slow-growing segment analysis, COVID-19 impact and recovery analysis and future consumer dynamics, and Market condition analysis for the forecast period.

Customization purview

If our report has not included the data that you are looking for, you can reach out to our analysts and get segments customized.

Request Sample PDF 

What are the Key Data Covered in this Adaptive Driving Equipment Market Research Report?

  • CAGR of the market during the forecast period
  • Detailed information on factors that will drive the growth of the adaptive driving equipment market between 2024 and 2028
  • Precise estimation of the adaptive driving equipment market size and its contribution to the market in focus on the parent market
  • Accurate predictions about upcoming trends and changes in consumer behavior
  • Growth of the market industry across North America, Europe, APAC, South America, and Middle East and Africa
  • A thorough analysis of the market’s competitive landscape and detailed information about companies
  • Comprehensive analysis of factors that will challenge the growth of adaptive driving equipment market companies

We can help! Our analysts can customize this market research report to meet your requirements. Get in touch

1 Executive Summary

  • 1.1 Market overview
    • Exhibit 01: Executive Summary – Chart on Market Overview
    • Exhibit 02: Executive Summary – Data Table on Market Overview
    • Exhibit 03: Executive Summary – Chart on Global Market Characteristics
    • Exhibit 04: Executive Summary – Chart on Market by Geography
    • Exhibit 05: Executive Summary – Chart on Market Segmentation by Application
    • Exhibit 06: Executive Summary – Chart on Market Segmentation by Type
    • Exhibit 07: Executive Summary – Chart on Incremental Growth
    • Exhibit 08: Executive Summary – Data Table on Incremental Growth
    • Exhibit 09: Executive Summary – Chart on Vendor Market Positioning

2 Market Landscape

  • 2.1 Market ecosystem
    • Exhibit 10: Parent market
    • Exhibit 11: Market Characteristics

3 Market Sizing

  • 3.1 Market definition
    • Exhibit 12: Offerings of vendors included in the market definition
  • 3.2 Market segment analysis
    • Exhibit 13: Market segments
  • 3.3 Market size 2023
    • 3.4 Market outlook: Forecast for 2023-2028
      • Exhibit 14: Chart on Global - Market size and forecast 2023-2028 ($ billion)
      • Exhibit 15: Data Table on Global - Market size and forecast 2023-2028 ($ billion)
      • Exhibit 16: Chart on Global Market: Year-over-year growth 2023-2028 (%)
      • Exhibit 17: Data Table on Global Market: Year-over-year growth 2023-2028 (%)

    4 Historic Market Size

    • 4.1 Global adaptive driving equipment market 2018 - 2022
      • Exhibit 18: Historic Market Size – Data Table on global adaptive driving equipment market 2018 - 2022 ($ billion)
    • 4.2 Application Segment Analysis 2018 - 2022
      • Exhibit 19: Historic Market Size – Application Segment 2018 - 2022 ($ billion)
    • 4.3 Type Segment Analysis 2018 - 2022
      • Exhibit 20: Historic Market Size – Type Segment 2018 - 2022 ($ billion)
    • 4.4 Geography Segment Analysis 2018 - 2022
      • Exhibit 21: Historic Market Size – Geography Segment 2018 - 2022 ($ billion)
    • 4.5 Country Segment Analysis 2018 - 2022
      • Exhibit 22: Historic Market Size – Country Segment 2018 - 2022 ($ billion)

    5 Five Forces Analysis

    • 5.1 Five forces summary
      • Exhibit 23: Five forces analysis - Comparison between 2023 and 2028
    • 5.2 Bargaining power of buyers
      • Exhibit 24: Chart on Bargaining power of buyers – Impact of key factors 2023 and 2028
    • 5.3 Bargaining power of suppliers
      • Exhibit 25: Bargaining power of suppliers – Impact of key factors in 2023 and 2028
    • 5.4 Threat of new entrants
      • Exhibit 26: Threat of new entrants – Impact of key factors in 2023 and 2028
    • 5.5 Threat of substitutes
      • Exhibit 27: Threat of substitutes – Impact of key factors in 2023 and 2028
    • 5.6 Threat of rivalry
      • Exhibit 28: Threat of rivalry – Impact of key factors in 2023 and 2028
    • 5.7 Market condition
      • Exhibit 29: Chart on Market condition - Five forces 2023 and 2028

    6 Market Segmentation by Application

    • 6.1 Market segments
      • Exhibit 30: Chart on Application - Market share 2023-2028 (%)
      • Exhibit 31: Data Table on Application - Market share 2023-2028 (%)
    • 6.2 Comparison by Application
      • Exhibit 32: Chart on Comparison by Application
      • Exhibit 33: Data Table on Comparison by Application
    • 6.3 Passenger car - Market size and forecast 2023-2028
      • Exhibit 34: Chart on Passenger car - Market size and forecast 2023-2028 ($ billion)
      • Exhibit 35: Data Table on Passenger car - Market size and forecast 2023-2028 ($ billion)
      • Exhibit 36: Chart on Passenger car - Year-over-year growth 2023-2028 (%)
      • Exhibit 37: Data Table on Passenger car - Year-over-year growth 2023-2028 (%)
    • 6.4 Commercial vehicle - Market size and forecast 2023-2028
      • Exhibit 38: Chart on Commercial vehicle - Market size and forecast 2023-2028 ($ billion)
      • Exhibit 39: Data Table on Commercial vehicle - Market size and forecast 2023-2028 ($ billion)
      • Exhibit 40: Chart on Commercial vehicle - Year-over-year growth 2023-2028 (%)
      • Exhibit 41: Data Table on Commercial vehicle - Year-over-year growth 2023-2028 (%)
    • 6.5 Market opportunity by Application
      • Exhibit 42: Market opportunity by Application ($ billion)
      • Exhibit 43: Data Table on Market opportunity by Application ($ billion)

    7 Market Segmentation by Type

    • 7.1 Market segments
      • Exhibit 44: Chart on Type - Market share 2023-2028 (%)
      • Exhibit 45: Data Table on Type - Market share 2023-2028 (%)
    • 7.2 Comparison by Type
      • Exhibit 46: Chart on Comparison by Type
      • Exhibit 47: Data Table on Comparison by Type
    • 7.3 Wheelchair and scooter lifts - Market size and forecast 2023-2028
      • Exhibit 48: Chart on Wheelchair and scooter lifts - Market size and forecast 2023-2028 ($ billion)
      • Exhibit 49: Data Table on Wheelchair and scooter lifts - Market size and forecast 2023-2028 ($ billion)
      • Exhibit 50: Chart on Wheelchair and scooter lifts - Year-over-year growth 2023-2028 (%)
      • Exhibit 51: Data Table on Wheelchair and scooter lifts - Year-over-year growth 2023-2028 (%)
    • 7.4 Wheelchair securements - Market size and forecast 2023-2028
      • Exhibit 52: Chart on Wheelchair securements - Market size and forecast 2023-2028 ($ billion)
      • Exhibit 53: Data Table on Wheelchair securements - Market size and forecast 2023-2028 ($ billion)
      • Exhibit 54: Chart on Wheelchair securements - Year-over-year growth 2023-2028 (%)
      • Exhibit 55: Data Table on Wheelchair securements - Year-over-year growth 2023-2028 (%)
    • 7.5 Hand controls - Market size and forecast 2023-2028
      • Exhibit 56: Chart on Hand controls - Market size and forecast 2023-2028 ($ billion)
      • Exhibit 57: Data Table on Hand controls - Market size and forecast 2023-2028 ($ billion)
      • Exhibit 58: Chart on Hand controls - Year-over-year growth 2023-2028 (%)
      • Exhibit 59: Data Table on Hand controls - Year-over-year growth 2023-2028 (%)
    • 7.6 Swivel seatings - Market size and forecast 2023-2028
      • Exhibit 60: Chart on Swivel seatings - Market size and forecast 2023-2028 ($ billion)
      • Exhibit 61: Data Table on Swivel seatings - Market size and forecast 2023-2028 ($ billion)
      • Exhibit 62: Chart on Swivel seatings - Year-over-year growth 2023-2028 (%)
      • Exhibit 63: Data Table on Swivel seatings - Year-over-year growth 2023-2028 (%)
    • 7.7 Market opportunity by Type
      • Exhibit 64: Market opportunity by Type ($ billion)
      • Exhibit 65: Data Table on Market opportunity by Type ($ billion)

    8 Customer Landscape

    • 8.1 Customer landscape overview
      • Exhibit 66: Analysis of price sensitivity, lifecycle, customer purchase basket, adoption rates, and purchase criteria

    9 Geographic Landscape

    • 9.1 Geographic segmentation
      • Exhibit 67: Chart on Market share by geography 2023-2028 (%)
      • Exhibit 68: Data Table on Market share by geography 2023-2028 (%)
    • 9.2 Geographic comparison
      • Exhibit 69: Chart on Geographic comparison
      • Exhibit 70: Data Table on Geographic comparison
    • 9.3 North America - Market size and forecast 2023-2028
      • Exhibit 71: Chart on North America - Market size and forecast 2023-2028 ($ billion)
      • Exhibit 72: Data Table on North America - Market size and forecast 2023-2028 ($ billion)
      • Exhibit 73: Chart on North America - Year-over-year growth 2023-2028 (%)
      • Exhibit 74: Data Table on North America - Year-over-year growth 2023-2028 (%)
    • 9.4 Europe - Market size and forecast 2023-2028
      • Exhibit 75: Chart on Europe - Market size and forecast 2023-2028 ($ billion)
      • Exhibit 76: Data Table on Europe - Market size and forecast 2023-2028 ($ billion)
      • Exhibit 77: Chart on Europe - Year-over-year growth 2023-2028 (%)
      • Exhibit 78: Data Table on Europe - Year-over-year growth 2023-2028 (%)
    • 9.5 APAC - Market size and forecast 2023-2028
      • Exhibit 79: Chart on APAC - Market size and forecast 2023-2028 ($ billion)
      • Exhibit 80: Data Table on APAC - Market size and forecast 2023-2028 ($ billion)
      • Exhibit 81: Chart on APAC - Year-over-year growth 2023-2028 (%)
      • Exhibit 82: Data Table on APAC - Year-over-year growth 2023-2028 (%)
    • 9.6 South America - Market size and forecast 2023-2028
      • Exhibit 83: Chart on South America - Market size and forecast 2023-2028 ($ billion)
      • Exhibit 84: Data Table on South America - Market size and forecast 2023-2028 ($ billion)
      • Exhibit 85: Chart on South America - Year-over-year growth 2023-2028 (%)
      • Exhibit 86: Data Table on South America - Year-over-year growth 2023-2028 (%)
    • 9.7 Middle East and Africa - Market size and forecast 2023-2028
      • Exhibit 87: Chart on Middle East and Africa - Market size and forecast 2023-2028 ($ billion)
      • Exhibit 88: Data Table on Middle East and Africa - Market size and forecast 2023-2028 ($ billion)
      • Exhibit 89: Chart on Middle East and Africa - Year-over-year growth 2023-2028 (%)
      • Exhibit 90: Data Table on Middle East and Africa - Year-over-year growth 2023-2028 (%)
    • 9.8 US - Market size and forecast 2023-2028
      • Exhibit 91: Chart on US - Market size and forecast 2023-2028 ($ billion)
      • Exhibit 92: Data Table on US - Market size and forecast 2023-2028 ($ billion)
      • Exhibit 93: Chart on US - Year-over-year growth 2023-2028 (%)
      • Exhibit 94: Data Table on US - Year-over-year growth 2023-2028 (%)
    • 9.9 China - Market size and forecast 2023-2028
      • Exhibit 95: Chart on China - Market size and forecast 2023-2028 ($ billion)
      • Exhibit 96: Data Table on China - Market size and forecast 2023-2028 ($ billion)
      • Exhibit 97: Chart on China - Year-over-year growth 2023-2028 (%)
      • Exhibit 98: Data Table on China - Year-over-year growth 2023-2028 (%)
    • 9.10 Germany - Market size and forecast 2023-2028
      • Exhibit 99: Chart on Germany - Market size and forecast 2023-2028 ($ billion)
      • Exhibit 100: Data Table on Germany - Market size and forecast 2023-2028 ($ billion)
      • Exhibit 101: Chart on Germany - Year-over-year growth 2023-2028 (%)
      • Exhibit 102: Data Table on Germany - Year-over-year growth 2023-2028 (%)
    • 9.11 UK - Market size and forecast 2023-2028
      • Exhibit 103: Chart on UK - Market size and forecast 2023-2028 ($ billion)
      • Exhibit 104: Data Table on UK - Market size and forecast 2023-2028 ($ billion)
      • Exhibit 105: Chart on UK - Year-over-year growth 2023-2028 (%)
      • Exhibit 106: Data Table on UK - Year-over-year growth 2023-2028 (%)
    • 9.12 Canada - Market size and forecast 2023-2028
      • Exhibit 107: Chart on Canada - Market size and forecast 2023-2028 ($ billion)
      • Exhibit 108: Data Table on Canada - Market size and forecast 2023-2028 ($ billion)
      • Exhibit 109: Chart on Canada - Year-over-year growth 2023-2028 (%)
      • Exhibit 110: Data Table on Canada - Year-over-year growth 2023-2028 (%)
    • 9.13 Market opportunity by geography
      • Exhibit 111: Market opportunity by geography ($ billion)
      • Exhibit 112: Data Tables on Market opportunity by geography ($ billion)

    10 Drivers, Challenges, and Trends

    • 10.1 Market drivers
      • 10.2 Market challenges
        • 10.3 Impact of drivers and challenges
          • Exhibit 113: Impact of drivers and challenges in 2023 and 2028
        • 10.4 Market trends

          11 Vendor Landscape

          • 11.1 Overview
            • 11.2 Vendor landscape
              • Exhibit 114: Overview on Criticality of inputs and Factors of differentiation
            • 11.3 Landscape disruption
              • Exhibit 115: Overview on factors of disruption
            • 11.4 Industry risks
              • Exhibit 116: Impact of key risks on business

            12 Vendor Analysis

            • 12.1 Vendors covered
              • Exhibit 117: Vendors covered
            • 12.2 Market positioning of vendors
              • Exhibit 118: Matrix on vendor position and classification
            • 12.3 Adapt Solutions Ltd.
              • Exhibit 119: Adapt Solutions Ltd. - Overview
              • Exhibit 120: Adapt Solutions Ltd. - Product / Service
              • Exhibit 121: Adapt Solutions Ltd. - Key offerings
            • 12.4 ATConversions
              • Exhibit 122: ATConversions - Overview
              • Exhibit 123: ATConversions - Product / Service
              • Exhibit 124: ATConversions - Key offerings
            • 12.5 BraunAbility
              • Exhibit 125: BraunAbility - Overview
              • Exhibit 126: BraunAbility - Product / Service
              • Exhibit 127: BraunAbility - Key offerings
            • 12.6 Bruno Independent Living Aids Inc.
              • Exhibit 128: Bruno Independent Living Aids Inc. - Overview
              • Exhibit 129: Bruno Independent Living Aids Inc. - Product / Service
              • Exhibit 130: Bruno Independent Living Aids Inc. - Key offerings
            • 12.7 Elap
              • Exhibit 131: Elap - Overview
              • Exhibit 132: Elap - Product / Service
              • Exhibit 133: Elap - Key offerings
            • 12.8 Electronic Mobility Controls LLC
              • Exhibit 134: Electronic Mobility Controls LLC - Overview
              • Exhibit 135: Electronic Mobility Controls LLC - Product / Service
              • Exhibit 136: Electronic Mobility Controls LLC - Key offerings
            • 12.9 FADIEL Italiana Srl
              • Exhibit 137: FADIEL Italiana Srl - Overview
              • Exhibit 138: FADIEL Italiana Srl - Product / Service
              • Exhibit 139: FADIEL Italiana Srl - Key offerings
            • 12.10 Ford Motor Co.
              • Exhibit 140: Ford Motor Co. - Overview
              • Exhibit 141: Ford Motor Co. - Business segments
              • Exhibit 142: Ford Motor Co. - Key news
              • Exhibit 143: Ford Motor Co. - Key offerings
              • Exhibit 144: Ford Motor Co. - Segment focus
            • 12.11 Freedom Motors USA
              • Exhibit 145: Freedom Motors USA - Overview
              • Exhibit 146: Freedom Motors USA - Product / Service
              • Exhibit 147: Freedom Motors USA - Key offerings
            • 12.12 Guidosimplex srl
              • Exhibit 148: Guidosimplex srl - Overview
              • Exhibit 149: Guidosimplex srl - Product / Service
              • Exhibit 150: Guidosimplex srl - Key offerings
            • 12.13 Jeff Gosling Hand Controls Ltd.
              • Exhibit 151: Jeff Gosling Hand Controls Ltd. - Overview
              • Exhibit 152: Jeff Gosling Hand Controls Ltd. - Product / Service
              • Exhibit 153: Jeff Gosling Hand Controls Ltd. - Key offerings
            • 12.14 PARAVAN GmbH
              • Exhibit 154: PARAVAN GmbH - Overview
              • Exhibit 155: PARAVAN GmbH - Product / Service
              • Exhibit 156: PARAVAN GmbH - Key offerings
            • 12.15 Sure Grip Hand Controls
              • Exhibit 157: Sure Grip Hand Controls - Overview
              • Exhibit 158: Sure Grip Hand Controls - Product / Service
              • Exhibit 159: Sure Grip Hand Controls - Key offerings
            • 12.16 Vantage Mobility International
              • Exhibit 160: Vantage Mobility International - Overview
              • Exhibit 161: Vantage Mobility International - Product / Service
              • Exhibit 162: Vantage Mobility International - Key offerings
            • 12.17 Veigel GmbH and Co. KG
              • Exhibit 163: Veigel GmbH and Co. KG - Overview
              • Exhibit 164: Veigel GmbH and Co. KG - Product / Service
              • Exhibit 165: Veigel GmbH and Co. KG - Key offerings

            13 Appendix

            • 13.1 Scope of the report
              • 13.2 Inclusions and exclusions checklist
                • Exhibit 166: Inclusions checklist
                • Exhibit 167: Exclusions checklist
              • 13.3 Currency conversion rates for US$
                • Exhibit 168: Currency conversion rates for US$
              • 13.4 Research methodology
                • Exhibit 169: Research methodology
                • Exhibit 170: Validation techniques employed for market sizing
                • Exhibit 171: Information sources
              • 13.5 List of abbreviations
                • Exhibit 172: List of abbreviations

              Research Methodology

              Technavio presents a detailed picture of the market by way of study, synthesis, and summation of data from multiple sources. The analysts have presented the various facets of the market with a particular focus on identifying the key industry influencers. The data thus presented is comprehensive, reliable, and the result of extensive research, both primary and secondary.

              INFORMATION SOURCES

              Primary sources

              • Manufacturers and suppliers
              • Channel partners
              • Industry experts
              • Strategic decision makers

              Secondary sources

              • Industry journals and periodicals
              • Government data
              • Financial reports of key industry players
              • Historical data
              • Press releases

              DATA ANALYSIS

              Data Synthesis

              • Collation of data
              • Estimation of key figures
              • Analysis of derived insights

              Data Validation

              • Triangulation with data models
              • Reference against proprietary databases
              • Corroboration with industry experts

              REPORT WRITING

              Qualitative

              • Market drivers
              • Market challenges
              • Market trends
              • Five forces analysis

              Quantitative

              • Market size and forecast
              • Market segmentation
              • Geographical insights
              • Competitive landscape

              Interested in this report?

              Get your sample now to see our research methodology and insights!

              Download Now

              Frequently Asked Questions

              Adaptive Driving Equipment market growth will increase by $ 1.51 bn during 2024-2028.

              The Adaptive Driving Equipment market is expected to grow at a CAGR of 7.71% during 2024-2028.

              Adaptive Driving Equipment market is segmented by Application( Passenger car, Commercial vehicle) Type( Wheelchair and scooter lifts, Wheelchair securements, Hand controls, Swivel seatings)

              Adapt Solutions Ltd., ATConversions, Bruno Independent Living Aids Inc., Drive Master, Elap, Electronic Mobility Controls LLC, FADIEL Italiana Srl, Focaccia Group Srl, Ford Motor Co., Freedom Motors USA, Guidosimplex srl, Handicare Group AB, Jeff Gosling Hand Controls Ltd., Kivi S.r.l, Koller Engineering Ltd., PARAVAN GmbH, Sure Grip Hand Controls, Vantage Mobility International, Veigel GmbH and Co. KG, BraunAbility are a few of the key vendors in the Adaptive Driving Equipment market.

              North America will register the highest growth rate of 37% among the other regions. Therefore, the Adaptive Driving Equipment market in North America is expected to garner significant business opportunities for the vendors during the forecast period.

              US, Canada, China, Germany, UK

              • Rising aging populationThe rising aging population is a significant driver of the global adaptive driving equipment market. As people age is the driving factor this market.
              • they may experience mobility challenges is the driving factor this market.
              • making it difficult to drive safely without assistance. The demand for adaptive driving solutions is increasing rapidly among the old age population. Older individuals often value their independence and autonomy. Adaptive driving equipment enables them to continue driving safely is the driving factor this market.
              • maintaining a sense of self-sufficiency and freedom. Adaptive driving equipment contributes to an improved quality of life for seniors by enabling them to participate in social activities is the driving factor this market.
              • run errands is the driving factor this market.
              • and maintain a sense of normalcy is the driving factor this market.
              • which is crucial for mental and emotional well-being. Furthermore is the driving factor this market.
              • with improvements in healthcare and living conditions is the driving factor this market.
              • people are living longer. As a result is the driving factor this market.
              • there a growing demographic of seniors who wish to remain active and engaged is the driving factor this market.
              • contributing to the demand for adaptive driving solutions. Age-related conditions is the driving factor this market.
              • like reduced reaction times is the driving factor this market.
              • diminished vision is the driving factor this market.
              • or physical limitations is the driving factor this market.
              • can impact driving ability. Adaptive driving equipment helps compensate for these challenges is the driving factor this market.
              • allowing seniors to drive more comfortably. As technology becomes more user-friendly is the driving factor this market.
              • seniors are increasingly adopting modern solutions. Adaptive driving equipment is the driving factor this market.
              • incorporating user-friendly interfaces and advanced safety features is the driving factor this market.
              • aligns with this trend. Furthermore is the driving factor this market.
              • family members and caregivers often seek solutions to support the independence of elderly individuals. Adaptive driving equipment provides a means for seniors to continue driving safely is the driving factor this market.
              • easing concerns for both the individuals and their support networks. The automotive industry recognizes the demographic shift towards an aging population. As a result is the driving factor this market.
              • manufacturers are investing in research and development to create adaptive driving technologies that cater to the specific needs of seniors. Therefore is the driving factor this market.
              • the rising aging population is a key catalyst for the growth of the adaptive driving equipment market is the driving factor this market.
              • driving innovation and solutions that cater to the mobility challenges associated with aging. Hence is the driving factor this market.
              • the global adaptive driving equipment market is expected to grow during the forecast period. is the driving factor this market.

              The Adaptive Driving Equipment market vendors should focus on grabbing business opportunities from the Passenger car segment as it accounted for the largest market share in the base year.
              RIA - Research AI Assistant
              Ask RIA