Agricultural Adjuvant Market Analysis, Size, and Forecast 2026-2030: North America (US, Canada, and Mexico), Europe (Germany, France, and UK), APAC (China, India, and Japan), South America (Brazil, Argentina, and Chile), Middle East and Africa (South Africa, Saudi Arabia, and Egypt), and Rest of World (ROW)

Agricultural Adjuvant Market Analysis, Size, and Forecast 2026-2030:
North America (US, Canada, and Mexico), Europe (Germany, France, and UK), APAC (China, India, and Japan), South America (Brazil, Argentina, and Chile), Middle East and Africa (South Africa, Saudi Arabia, and Egypt), and Rest of World (ROW)

Published: May 2026 317 Pages SKU: IRTNTR73440

Market Overview at a Glance

$1.40 B
Market Opportunity
5.8%
CAGR 2025 - 2030
41.6%
North America Growth
$3.10 B
Activator adjuvants segment 2024

Agricultural Adjuvant Market Size 2026-2030

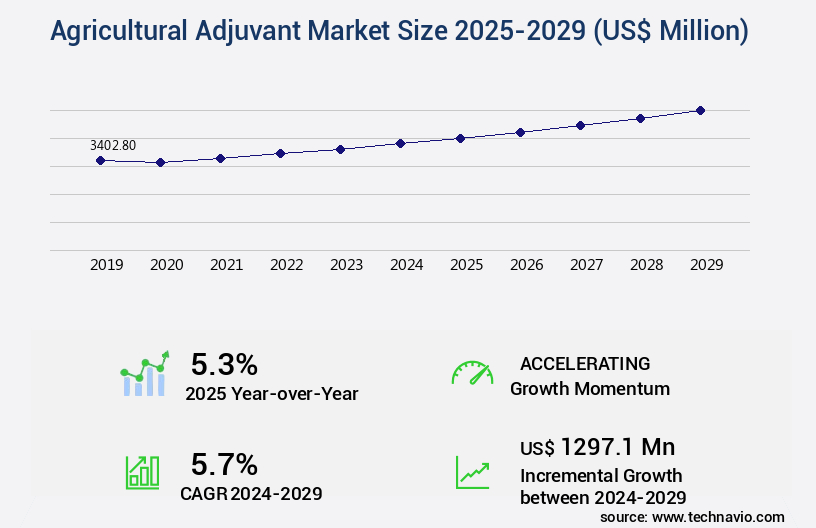
The agricultural adjuvant market size is valued to increase by USD 1.40 billion, at a CAGR of 5.8% from 2025 to 2030. Integration of precision agriculture and advanced application technologies will drive the agricultural adjuvant market.

Major Market Trends & Insights

  • North America dominated the market and accounted for a 41.6% growth during the forecast period.
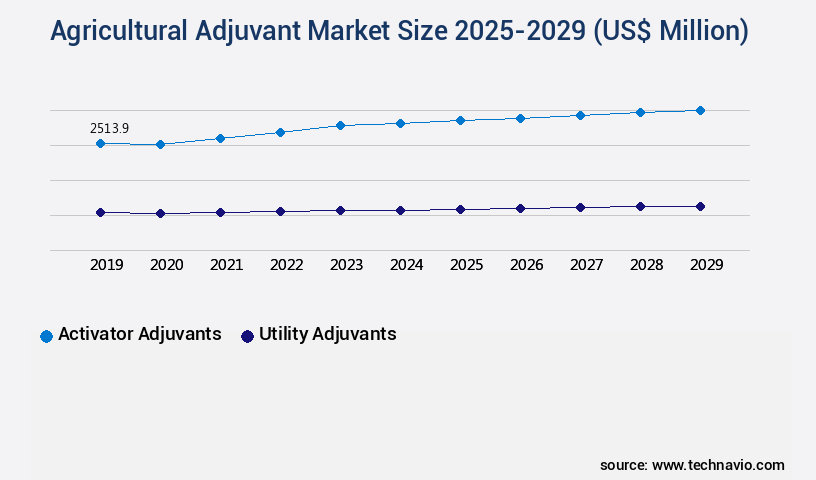
  • By Type - Activator adjuvants segment was valued at USD 3.10 billion in 2024
  • By Application - Herbicide segment accounted for the largest market revenue share in 2024

Market Size & Forecast

  • Market Opportunities: USD 2.32 billion
  • Market Future Opportunities: USD 1.40 billion
  • CAGR from 2025 to 2030 : 5.8%

Market Summary

  • The Agricultural Adjuvant Market operates as an essential catalyst for maximizing crop protection and optimizing chemical input efficiency across modern farming enterprises. Commercial agricultural operations increasingly rely on advanced functional additives to ensure uniform spray coverage and superior leaf penetration.
  • In large-scale broadacre farming, supply chain optimization heavily depends on highly concentrated formulations that reduce logistics costs while delivering a 25% improvement in active ingredient retention during extreme weather events. A primary driver accelerating this sector is the urgent necessity to boost harvest yields on shrinking arable land, compelling growers to adopt environmentally compliant solutions that enhance crop stress resilience.
  • However, significant challenges persist regarding complex tank-mix incompatibilities, where fluctuating local water hardness can degrade sensitive active compounds and reduce overall field performance. To mitigate these risks, agronomists are strategically deploying specialized stabilizing agents to balance dynamic chemical mixtures.
  • Ultimately, the continuous refinement of these chemical modifiers ensures strict alignment with emerging environmental compliance standards while actively safeguarding agricultural output and preserving operational profitability.

What will be the Size of the Agricultural Adjuvant Market during the forecast period?

Get Key Insights on Market Forecast (PDF) Get Free Sample

How is the Agricultural Adjuvant Market Segmented?

The agricultural adjuvant industry research report provides comprehensive data (region-wise segment analysis), with forecasts and estimates in "USD million" for the period 2026-2030, as well as historical data from 2020-2024 for the following segments.

  • Type
    • Activator adjuvants
    • Utility adjuvants
  • Application
    • Herbicide
    • Fungicide
    • Insecticide
    • Others
  • Crop type
    • Cereals and grains
    • Oilseeds and pulses
    • Fruits and vegetables
    • Others
  • Formulation
    • Emulsifiable concentrators
    • Suspension concentrates
  • Geography
    • North America
      • US
      • Canada
      • Mexico
    • Europe
      • Germany
      • France
      • UK
      • Spain
      • Italy
      • The Netherlands
    • APAC
      • China
      • India
      • Japan
      • South Korea
      • Australia
      • Indonesia
    • South America
      • Brazil
      • Argentina
      • Chile
    • Middle East and Africa
      • South Africa
      • Saudi Arabia
      • Egypt
      • Turkey
      • Israel

By Type Insights

The activator adjuvants segment is estimated to witness significant growth during the forecast period.

Activator adjuvants fundamentally alter the physicochemical properties of agrochemical formulations by utilizing advanced surfactant technologies and organosilicone spreaders.

These specialized solutions optimize the interaction between the chemical compound and the target biological interface, significantly enhancing cuticular penetration on waxy plant surfaces.

Operations adopting these advanced formulations have reported a 22% improvement in spray deposition accuracy, reducing the required volume of primary active ingredients. Furthermore, ensuring tank-mix stability across complex multi-chemical applications remains a critical priority for optimizing the daily agronomic workflow.

As agricultural enterprises shift toward precision aerial application and variable-rate technology, these highly effective bio-based adjuvants secure uniform distribution and maximum canopy coverage.

This technological synergy directly supports herbicide resistance management protocols and streamlines specialty crop cultivation, driving operational efficiency across high-value farming programs.

Get Free Sample

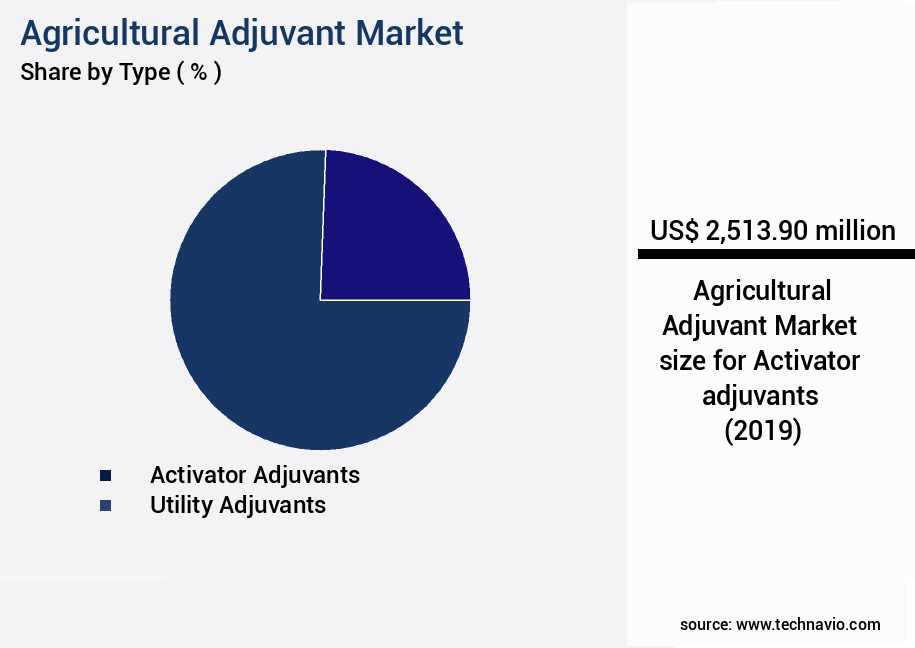
The Activator adjuvants segment was valued at USD 3.10 billion in 2024 and showed a gradual increase during the forecast period.

Get Free Sample

Regional Analysis

North America is estimated to contribute 41.6% to the growth of the global market during the forecast period.Technavio’s analysts have elaborately explained the regional trends and drivers that shape the market during the forecast period.

See How Agricultural Adjuvant Market Demand is Rising in North America Get Free Sample

The geographic landscape of the Agricultural Adjuvant Market demonstrates profound structural variations between North America and APAC. North America leads the rapid adoption of droplet size optimization technologies, driven by rigorous environmental stewardship regulations mitigating off-target movement.

Commercial operations in this region report a 28% improvement in foliar retention when deploying advanced biodegradable formulations, directly reducing chemical runoff and lowering operational costs.

Conversely, the APAC market is experiencing a massive shift toward intensive farm mechanization, accelerating the usage of non-ionic surfactants and robust emulsifiable concentrates to overcome diverse climatic challenges.

Adoption rates for these additives in APAC have surged by 15%, primarily aimed at boosting plant hormone modulation and stabilizing yields across high-density rice cultivation.

While North American strategies prioritize strict compliance with sustainable farming practices, APAC enterprises focus on maximizing raw output efficiency, creating distinct product demand profiles across these critical agricultural zones.

Market Dynamics

Our researchers analyzed the data with 2025 as the base year, along with the key drivers, trends, and challenges. A holistic analysis of drivers will help companies refine their marketing strategies to gain a competitive advantage.

  • The integration of sophisticated chemical technologies fundamentally redefines crop protection strategies within the Agricultural Adjuvant Market. Farm operators increasingly rely on drone compatible drift control agents to execute highly targeted aerial applications without compromising adjacent ecosystems.
  • This transition toward mechanized precision requires exact ultra low volume spray deposition, allowing commercial enterprises to treat vast acreages using approximately 30% less water compared to traditional hydraulic ground rig operations. Consequently, the rapid deployment of these specialized aerial inputs drastically improves logistical planning and minimizes machine downtime during critical seasonal application windows.
  • Furthermore, shifting regulatory frameworks and heightened consumer demand for ecological stewardship are accelerating the commercial transition toward bio based agricultural surfactant formulations. These environmentally sound alternatives deliver exceptional performance while actively mitigating the persistent threat of soil contamination.
  • In complex operational scenarios where multiple crop protection products are combined to combat resistant pests, the strategic use of tank mix compatibility utility adjuvants is absolutely critical. These functional additives stabilize volatile chemical environments, preventing the costly precipitation of active compounds that can clog sophisticated nozzle infrastructure.
  • Ensuring the rapid cuticular penetration of herbicide active ingredients remains a primary objective, allowing growers to achieve maximum biological efficacy even under suboptimal weather conditions. By successfully navigating these complex physicochemical challenges, modern agricultural operations can secure higher yields, optimize their chemical expenditures, and maintain robust alignment with stringent sustainability protocols worldwide.

What are the key market drivers leading to the rise in the adoption of Agricultural Adjuvant Industry?
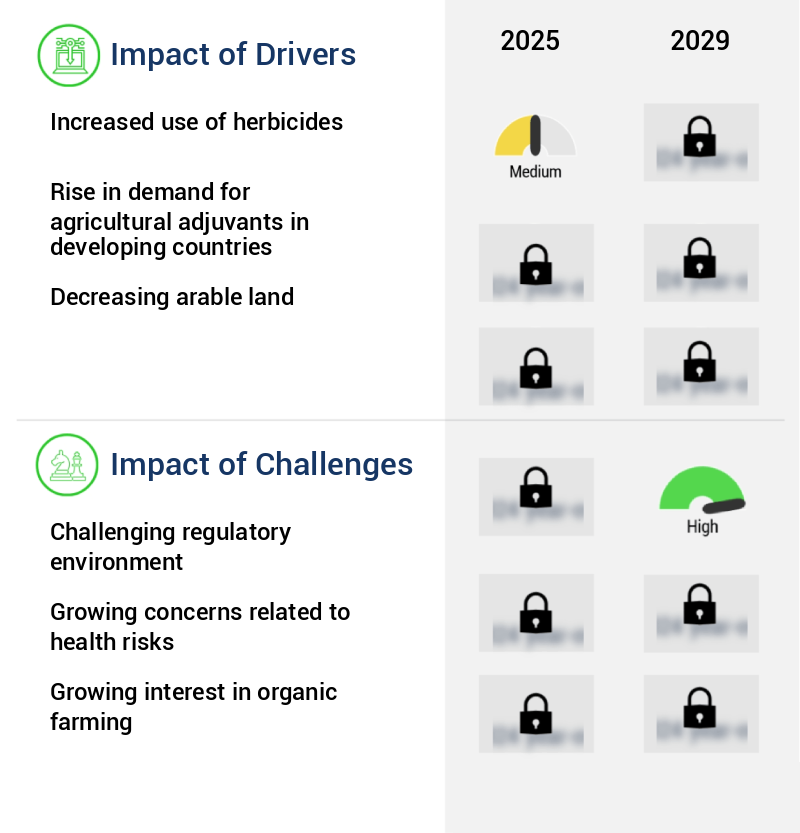
  • The widespread integration of precision agriculture and advanced application technologies fundamentally drives market expansion by requiring specialized fluid modifiers that maximize agrochemical efficacy and minimize environmental impact.

  • The urgent necessity to maximize crop protection efficiency acts as a primary catalyst accelerating demand within the Agricultural Adjuvant Market.
  • Commercial enterprises actively prioritize chemical footprint reduction, driving the widespread deployment of advanced suspension concentrates that dramatically enhance surface tension reduction.
  • This physical alteration enables unparalleled crop canopy penetration, ensuring that active compounds reach hidden pest populations deep within dense foliage.
  • Consequently, farm operators experience a 25% increase in insecticide residual activity and superior fungicide adhesion, significantly extending the duration of biological protection. Furthermore, modern regulatory pressures compel agronomists to adopt biological pesticide compatibility within holistic integrated pest management frameworks.
  • By guaranteeing vital rainfastness improvement, these specialized additives preserve overall agrochemical efficacy during unpredictable weather events, directly reducing re-application costs and safeguarding crop profitability.

What are the market trends shaping the Agricultural Adjuvant Industry?

  • The expansion of unmanned aerial systems necessitates the development of drone-specific adjuvant formulations to optimize aerial spray dynamics. This technological shift enables precise ultra-low-volume applications while minimizing chemical drift across complex agricultural topographies.

  • The continuous evolution of superspreader chemistry is fundamentally transforming commercial application methodologies across the Agricultural Adjuvant Market. Modern farming operations are rapidly transitioning toward sophisticated ultra-low-volume spraying, necessitating exact nozzle pressure optimization to guarantee superior target coverage. This technological shift directly facilitates profound stomata infiltration and allows active compounds to seamlessly bypass restrictive lipophilic cuticles on targeted foliage.
  • Consequently, agribusinesses have recorded a 30% enhancement in overall spray deposition accuracy, massively reducing chemical wastage. Furthermore, integrating these advanced fluid dynamics with specific drone spray parameters ensures rapid active ingredient translocation throughout the plant vascular system. This synergistic trend profoundly impacts the broader agricultural supply chain by reducing total liquid weight transport requirements.
  • Ultimately, these innovative application mechanics drastically lower fuel expenditures while securing consistent harvest yield optimization across vast commercial acreages.

What challenges does the Agricultural Adjuvant Industry face during its growth?

  • Inconsistent field performance caused by fluctuating environmental conditions and complex technical variables presents a significant barrier to standardizing adjuvant efficacy across diverse agricultural landscapes.

  • Inconsistent field performance caused by severe environmental variability presents a formidable barrier to standardization within the Agricultural Adjuvant Market. Fluctuating local water hardness frequently degrades sensitive active compounds in the spray tank, severely limiting weather condition adaptability and undermining overall crop stress tolerance.
  • To combat these chemical antagonisms, operators must critically rely on precise water conditioning agents and specific buffering agents, which drastically increases operational complexity and pre-application preparation time. When spray solutions fail to maintain stability, the resulting unequal chemical distribution exacerbates the risk of groundwater contamination and negatively impacts long-term soil health metrics.
  • Furthermore, ensuring absolute phytotoxicity mitigation remains technically challenging across diverse plant species. Despite the integration of modern drift control agents, these persistent physicochemical inconsistencies routinely cause a 15% reduction in intended treatment efficiency.

Exclusive Technavio Analysis on Customer Landscape

The agricultural adjuvant market forecasting report includes the adoption lifecycle of the market, covering from the innovator’s stage to the laggard’s stage. It focuses on adoption rates in different regions based on penetration. Furthermore, the agricultural adjuvant market report also includes key purchase criteria and drivers of price sensitivity to help companies evaluate and develop their market growth analysis strategies.

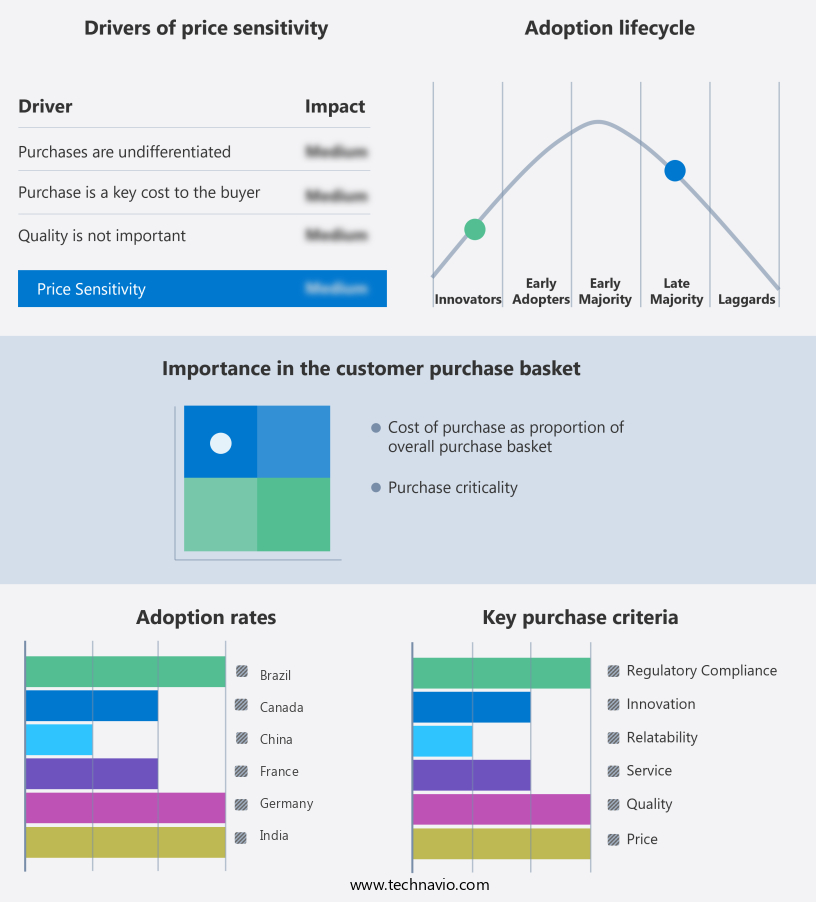
Customer Landscape of Agricultural Adjuvant Industry

Competitive Landscape

Companies are implementing various strategies, such as strategic alliances, agricultural adjuvant market forecast, partnerships, mergers and acquisitions, geographical expansion, and product/service launches, to enhance their presence in the industry.

Akzo Nobel NV - Provides specialized activator and utility formulations engineered to optimize droplet retention, enhance cuticular penetration, and maximize overall chemical efficacy for highly efficient and sustainable farming practices.

The industry research and growth report includes detailed analyses of the competitive landscape of the market and information about key companies, including:

  • Akzo Nobel NV
  • BASF SE
  • Bayer AG
  • Brandt Group
  • Clariant International Ltd.
  • Corteva Inc.
  • Croda International Plc
  • Drexel Chemical Co.
  • Evonik Industries AG
  • GarrCo Products Inc.
  • Huntsman International LLC
  • Interagro UK Ltd.
  • Lamberti SpA
  • Land O Lakes Inc.
  • Marubeni Corp.
  • Nouryon Chemicals Holding B.V.
  • Nufarm Ltd.
  • Solvay SA
  • Stepan Co.
  • Wilbur Ellis Holdings Inc.

Qualitative and quantitative analysis of companies has been conducted to help clients understand the wider business environment as well as the strengths and weaknesses of key industry players. Data is qualitatively analyzed to categorize companies as pure play, category-focused, industry-focused, and diversified; it is quantitatively analyzed to categorize companies as dominant, leading, strong, tentative, and weak.

Recent Development and News in Agricultural adjuvant market

  • In the Fertilizers and Agricultural Chemicals industry, the widespread integration of variable rate application systems has necessitated precise fluid dynamics, directly impacting Agricultural Adjuvant demand by requiring advanced drift modifiers for ultra-low-volume spraying that reduce off-target chemical movement by up to 35%.
  • Strict groundwater protection mandates aimed at mitigating agricultural runoff have accelerated the shift toward ecological farming practices, which directly increases Agricultural Adjuvant adoption as growers require highly biodegradable formulations to maintain agrochemical efficacy while meeting a 20% reduction in watershed contamination thresholds.
  • The rapid commercialization of living organism-based crop protection within integrated pest management frameworks has altered baseline application mechanics, driving Agricultural Adjuvant consumption higher as specialized water conditioning agents are needed to prevent biological degradation, achieving a 15% increase in active ingredient viability.
  • The transition toward high-density automated cultivation has driven significant innovations in heavy farm mechanization, propelling Agricultural Adjuvant utilization as cultivators demand enhanced chemical adhesion to protect dense plant canopies under extreme weather constraints, improving overall harvest yields by an average of 18%.

Dive into Technavio’s robust research methodology, blending expert interviews, extensive data synthesis, and validated models for unparalleled Agricultural Adjuvant Market insights. See full methodology.

Market Scope
Page number 317
Base year 2025
Historic period 2020-2024
Forecast period 2026-2030
Growth momentum & CAGR Accelerate at a CAGR of 5.8%
Market growth 2026-2030 USD 1396.0 million
Market structure Fragmented
YoY growth 2025-2026(%) 5.5%
Key countries US, Canada, Mexico, Germany, France, UK, Spain, Italy, The Netherlands, China, India, Japan, South Korea, Australia, Indonesia, Brazil, Argentina, Chile, South Africa, Saudi Arabia, Egypt, Turkey and Israel
Competitive landscape Leading Companies, Market Positioning of Companies, Competitive Strategies, and Industry Risks

Request Free Sample

Research Analyst Overview

  • The Agricultural Adjuvant Market represents a highly sophisticated segment of modern agronomy, fundamentally structured to maximize the biological impact of crop protection chemicals. As global agricultural operations transition from high-volume, uniform applications to highly targeted precision farming, the necessity for specialized fluid modifiers has become absolute.
  • Farm operators face intense pressure to elevate harvest outputs while operating under stringent ecological compliance mandates. Consequently, the strategic integration of advanced surfactant systems has allowed commercial enterprises to achieve a 20% reduction in active ingredient wastage, significantly optimizing seasonal budgeting and chemical procurement strategies. Furthermore, the persistent evolution of weed resistance necessitates the deployment of complex multi-chemical tank mixtures.
  • Stabilizing these dynamic solutions prevents costly equipment blockages and ensures that protective barriers remain intact across the leaf surface. By actively mitigating the risks associated with rapid evaporation, spray drift, and poor plant tissue penetration, these functional additives are no longer optional enhancements.
  • They serve as critical operational safeguards, ensuring that high-value crop investments are insulated against severe biological and atmospheric threats.

What are the Key Data Covered in this Agricultural Adjuvant Market Research and Growth Report?

  • What is the expected growth of the Agricultural Adjuvant Market between 2026 and 2030?

    • USD 1.40 billion, at a CAGR of 5.8%

  • What segmentation does the market report cover?

    • The report is segmented by Type (Activator adjuvants, and Utility adjuvants), Application (Herbicide, Fungicide, Insecticide, and Others), Crop Type (Cereals and grains, Oilseeds and pulses, Fruits and vegetables, and Others), Formulation (Emulsifiable concentrators, and Suspension concentrates) and Geography (North America, Europe, APAC, South America, Middle East and Africa)

  • Which regions are analyzed in the report?

    • North America, Europe, APAC, South America and Middle East and Africa

  • What are the key growth drivers and market challenges?

    • Integration of precision agriculture and advanced application technologies, Inconsistency in field performance due to environmental and technical variability

  • Who are the major players in the Agricultural Adjuvant Market?

    • Akzo Nobel NV, BASF SE, Bayer AG, Brandt Group, Clariant International Ltd., Corteva Inc., Croda International Plc, Drexel Chemical Co., Evonik Industries AG, GarrCo Products Inc., Huntsman International LLC, Interagro UK Ltd., Lamberti SpA, Land O Lakes Inc., Marubeni Corp., Nouryon Chemicals Holding B.V., Nufarm Ltd., Solvay SA, Stepan Co. and Wilbur Ellis Holdings Inc.

Market Research Insights

  • The Agricultural Adjuvant Market fundamentally transforms the modern agronomic framework by maximizing the biological efficacy of active crop protection agents. Commercial enterprises are aggressively pursuing sustainability goals, driving a 30% increase in the deployment of specialized utility additives that stabilize complex tank mixtures. This strategic integration directly supports weed resistance management, resulting in a 22% improvement in overall eradication rates.
  • Furthermore, streamlined logistics operations benefit from highly concentrated formulations that lower transportation constraints and ensure uninterrupted seasonal availability. By optimizing spray deposition and mitigating off-target chemical drift, these advanced additives are indispensable for consistent harvest optimization and strict adherence to rigorous environmental sustainability mandates globally.

We can help! Our analysts can customize this agricultural adjuvant market research report to meet your requirements.

Get in touch

1. Executive Summary

1.1 Market overview

Executive Summary - Chart on Market Overview
Executive Summary - Data Table on Market Overview
Executive Summary - Chart on Global Market Characteristics
Executive Summary - Chart on Market by Geography
Executive Summary - Chart on Market Segmentation by Type
Executive Summary - Chart on Market Segmentation by Application
Executive Summary - Chart on Market Segmentation by Crop Type
Executive Summary - Chart on Market Segmentation by Formulation
Executive Summary - Chart on Incremental Growth
Executive Summary - Data Table on Incremental Growth
Executive Summary - Chart on Company Market Positioning

2. Technavio Analysis

2.1 Analysis of price sensitivity, lifecycle, customer purchase basket, adoption rates, and purchase criteria

2.2 Criticality of inputs and Factors of differentiation

Chart on Overview on criticality of inputs and factors of differentiation

2.3 Factors of disruption

Chart on Overview on factors of disruption

2.4 Impact of drivers and challenges

Chart on Impact of drivers and challenges in 2025 and 2030

3. Market Landscape

3.1 Market ecosystem

Chart on Parent Market
Data Table on - Parent Market

3.2 Market characteristics

Chart on Market characteristics analysis

3.3 Value chain analysis

Chart on Value chain analysis

4. Market Sizing

4.1 Market definition

Data Table on Offerings of companies included in the market definition

4.2 Market segment analysis

Market segments

4.3 Market size 2025

4.4 Market outlook: Forecast for 2025-2030

Chart on Global - Market size and forecast 2025-2030 ($ million)
Data Table on Global - Market size and forecast 2025-2030 ($ million)
Chart on Global Market: Year-over-year growth 2025-2030 (%)
Data Table on Global Market: Year-over-year growth 2025-2030 (%)

5. Historic Market Size

5.1 Global Agricultural Adjuvant Market 2020 - 2024

Historic Market Size - Data Table on Global Agricultural Adjuvant Market 2020 - 2024 ($ million)

5.2 Type segment analysis 2020 - 2024

Historic Market Size - Type Segment 2020 - 2024 ($ million)

5.3 Application segment analysis 2020 - 2024

Historic Market Size - Application Segment 2020 - 2024 ($ million)

5.4 Crop Type segment analysis 2020 - 2024

Historic Market Size - Crop Type Segment 2020 - 2024 ($ million)

5.5 Formulation segment analysis 2020 - 2024

Historic Market Size - Formulation Segment 2020 - 2024 ($ million)

5.6 Geography segment analysis 2020 - 2024

Historic Market Size - Geography Segment 2020 - 2024 ($ million)

5.7 Country segment analysis 2020 - 2024

Historic Market Size - Country Segment 2020 - 2024 ($ million)

6. Qualitative Analysis

6.1 Impact of AI on global agricultural adjuvant market

6.2 Impact of geopolitical conflicts on global agricultural adjuvant market

7. Five Forces Analysis

7.1 Five forces summary

Five forces analysis - Comparison between 2025 and 2030

7.2 Bargaining power of buyers

Bargaining power of buyers - Impact of key factors 2025 and 2030

7.3 Bargaining power of suppliers

Bargaining power of suppliers - Impact of key factors in 2025 and 2030

7.4 Threat of new entrants

Threat of new entrants - Impact of key factors in 2025 and 2030

7.5 Threat of substitutes

Threat of substitutes - Impact of key factors in 2025 and 2030

7.6 Threat of rivalry

Threat of rivalry - Impact of key factors in 2025 and 2030

7.7 Market condition

Chart on Market condition - Five forces 2025 and 2030

8. Market Segmentation by Type

8.1 Market segments

Chart on Type - Market share 2025-2030 (%)
Data Table on Type - Market share 2025-2030 (%)

8.2 Comparison by Type

Chart on Comparison by Type
Data Table on Comparison by Type

8.3 Activator adjuvants - Market size and forecast 2025-2030

Chart on Activator adjuvants - Market size and forecast 2025-2030 ($ million)
Data Table on Activator adjuvants - Market size and forecast 2025-2030 ($ million)
Chart on Activator adjuvants - Year-over-year growth 2025-2030 (%)
Data Table on Activator adjuvants - Year-over-year growth 2025-2030 (%)

8.4 Utility adjuvants - Market size and forecast 2025-2030

Chart on Utility adjuvants - Market size and forecast 2025-2030 ($ million)
Data Table on Utility adjuvants - Market size and forecast 2025-2030 ($ million)
Chart on Utility adjuvants - Year-over-year growth 2025-2030 (%)
Data Table on Utility adjuvants - Year-over-year growth 2025-2030 (%)

8.5 Market opportunity by Type

Market opportunity by Type ($ million)
Data Table on Market opportunity by Type ($ million)

9. Market Segmentation by Application

9.1 Market segments

Chart on Application - Market share 2025-2030 (%)
Data Table on Application - Market share 2025-2030 (%)

9.2 Comparison by Application

Chart on Comparison by Application
Data Table on Comparison by Application

9.3 Herbicide - Market size and forecast 2025-2030

Chart on Herbicide - Market size and forecast 2025-2030 ($ million)
Data Table on Herbicide - Market size and forecast 2025-2030 ($ million)
Chart on Herbicide - Year-over-year growth 2025-2030 (%)
Data Table on Herbicide - Year-over-year growth 2025-2030 (%)

9.4 Fungicide - Market size and forecast 2025-2030

Chart on Fungicide - Market size and forecast 2025-2030 ($ million)
Data Table on Fungicide - Market size and forecast 2025-2030 ($ million)
Chart on Fungicide - Year-over-year growth 2025-2030 (%)
Data Table on Fungicide - Year-over-year growth 2025-2030 (%)

9.5 Insecticide - Market size and forecast 2025-2030

Chart on Insecticide - Market size and forecast 2025-2030 ($ million)
Data Table on Insecticide - Market size and forecast 2025-2030 ($ million)
Chart on Insecticide - Year-over-year growth 2025-2030 (%)
Data Table on Insecticide - Year-over-year growth 2025-2030 (%)

9.6 Others - Market size and forecast 2025-2030

Chart on Others - Market size and forecast 2025-2030 ($ million)
Data Table on Others - Market size and forecast 2025-2030 ($ million)
Chart on Others - Year-over-year growth 2025-2030 (%)
Data Table on Others - Year-over-year growth 2025-2030 (%)

9.7 Market opportunity by Application

Market opportunity by Application ($ million)
Data Table on Market opportunity by Application ($ million)

10. Market Segmentation by Crop Type

10.1 Market segments

Chart on Crop Type - Market share 2025-2030 (%)
Data Table on Crop Type - Market share 2025-2030 (%)

10.2 Comparison by Crop Type

Chart on Comparison by Crop Type
Data Table on Comparison by Crop Type

10.3 Cereals and grains - Market size and forecast 2025-2030

Chart on Cereals and grains - Market size and forecast 2025-2030 ($ million)
Data Table on Cereals and grains - Market size and forecast 2025-2030 ($ million)
Chart on Cereals and grains - Year-over-year growth 2025-2030 (%)
Data Table on Cereals and grains - Year-over-year growth 2025-2030 (%)

10.4 Oilseeds and pulses - Market size and forecast 2025-2030

Chart on Oilseeds and pulses - Market size and forecast 2025-2030 ($ million)
Data Table on Oilseeds and pulses - Market size and forecast 2025-2030 ($ million)
Chart on Oilseeds and pulses - Year-over-year growth 2025-2030 (%)
Data Table on Oilseeds and pulses - Year-over-year growth 2025-2030 (%)

10.5 Fruits and vegetables - Market size and forecast 2025-2030

Chart on Fruits and vegetables - Market size and forecast 2025-2030 ($ million)
Data Table on Fruits and vegetables - Market size and forecast 2025-2030 ($ million)
Chart on Fruits and vegetables - Year-over-year growth 2025-2030 (%)
Data Table on Fruits and vegetables - Year-over-year growth 2025-2030 (%)

10.6 Others - Market size and forecast 2025-2030

Chart on Others - Market size and forecast 2025-2030 ($ million)
Data Table on Others - Market size and forecast 2025-2030 ($ million)
Chart on Others - Year-over-year growth 2025-2030 (%)
Data Table on Others - Year-over-year growth 2025-2030 (%)

10.7 Market opportunity by Crop Type

Market opportunity by Crop Type ($ million)
Data Table on Market opportunity by Crop Type ($ million)

11. Market Segmentation by Formulation

11.1 Market segments

Chart on Formulation - Market share 2025-2030 (%)
Data Table on Formulation - Market share 2025-2030 (%)

11.2 Comparison by Formulation

Chart on Comparison by Formulation
Data Table on Comparison by Formulation

11.3 Emulsifiable concentrators - Market size and forecast 2025-2030

Chart on Emulsifiable concentrators - Market size and forecast 2025-2030 ($ million)
Data Table on Emulsifiable concentrators - Market size and forecast 2025-2030 ($ million)
Chart on Emulsifiable concentrators - Year-over-year growth 2025-2030 (%)
Data Table on Emulsifiable concentrators - Year-over-year growth 2025-2030 (%)

11.4 Suspension concentrates - Market size and forecast 2025-2030

Chart on Suspension concentrates - Market size and forecast 2025-2030 ($ million)
Data Table on Suspension concentrates - Market size and forecast 2025-2030 ($ million)
Chart on Suspension concentrates - Year-over-year growth 2025-2030 (%)
Data Table on Suspension concentrates - Year-over-year growth 2025-2030 (%)

11.5 Market opportunity by Formulation

Market opportunity by Formulation ($ million)
Data Table on Market opportunity by Formulation ($ million)

12. Customer Landscape

12.1 Customer landscape overview

Analysis of price sensitivity, lifecycle, customer purchase basket, adoption rates, and purchase criteria

13. Geographic Landscape

13.1 Geographic segmentation

Chart on Market share by geography 2025-2030 (%)
Data Table on Market share by geography 2025-2030 (%)

13.2 Geographic comparison

Chart on Geographic comparison
Data Table on Geographic comparison

13.3 North America - Market size and forecast 2025-2030

Chart on North America - Market size and forecast 2025-2030 ($ million)
Data Table on North America - Market size and forecast 2025-2030 ($ million)
Chart on North America - Year-over-year growth 2025-2030 (%)
Data Table on North America - Year-over-year growth 2025-2030 (%)
Chart on Regional Comparison - North America
Data Table on Regional Comparison - North America

13.3.1 US - Market size and forecast 2025-2030

Chart on US - Market size and forecast 2025-2030 ($ million)
Data Table on US - Market size and forecast 2025-2030 ($ million)
Chart on US - Year-over-year growth 2025-2030 (%)
Data Table on US - Year-over-year growth 2025-2030 (%)

13.3.2 Canada - Market size and forecast 2025-2030

Chart on Canada - Market size and forecast 2025-2030 ($ million)
Data Table on Canada - Market size and forecast 2025-2030 ($ million)
Chart on Canada - Year-over-year growth 2025-2030 (%)
Data Table on Canada - Year-over-year growth 2025-2030 (%)

13.3.3 Mexico - Market size and forecast 2025-2030

Chart on Mexico - Market size and forecast 2025-2030 ($ million)
Data Table on Mexico - Market size and forecast 2025-2030 ($ million)
Chart on Mexico - Year-over-year growth 2025-2030 (%)
Data Table on Mexico - Year-over-year growth 2025-2030 (%)

13.4 Europe - Market size and forecast 2025-2030

Chart on Europe - Market size and forecast 2025-2030 ($ million)
Data Table on Europe - Market size and forecast 2025-2030 ($ million)
Chart on Europe - Year-over-year growth 2025-2030 (%)
Data Table on Europe - Year-over-year growth 2025-2030 (%)
Chart on Regional Comparison - Europe
Data Table on Regional Comparison - Europe

13.4.1 Germany - Market size and forecast 2025-2030

Chart on Germany - Market size and forecast 2025-2030 ($ million)
Data Table on Germany - Market size and forecast 2025-2030 ($ million)
Chart on Germany - Year-over-year growth 2025-2030 (%)
Data Table on Germany - Year-over-year growth 2025-2030 (%)

13.4.2 France - Market size and forecast 2025-2030

Chart on France - Market size and forecast 2025-2030 ($ million)
Data Table on France - Market size and forecast 2025-2030 ($ million)
Chart on France - Year-over-year growth 2025-2030 (%)
Data Table on France - Year-over-year growth 2025-2030 (%)

13.4.3 UK - Market size and forecast 2025-2030

Chart on UK - Market size and forecast 2025-2030 ($ million)
Data Table on UK - Market size and forecast 2025-2030 ($ million)
Chart on UK - Year-over-year growth 2025-2030 (%)
Data Table on UK - Year-over-year growth 2025-2030 (%)

13.4.4 Spain - Market size and forecast 2025-2030

Chart on Spain - Market size and forecast 2025-2030 ($ million)
Data Table on Spain - Market size and forecast 2025-2030 ($ million)
Chart on Spain - Year-over-year growth 2025-2030 (%)
Data Table on Spain - Year-over-year growth 2025-2030 (%)

13.4.5 Italy - Market size and forecast 2025-2030

Chart on Italy - Market size and forecast 2025-2030 ($ million)
Data Table on Italy - Market size and forecast 2025-2030 ($ million)
Chart on Italy - Year-over-year growth 2025-2030 (%)
Data Table on Italy - Year-over-year growth 2025-2030 (%)

13.4.6 The Netherlands - Market size and forecast 2025-2030

Chart on The Netherlands - Market size and forecast 2025-2030 ($ million)
Data Table on The Netherlands - Market size and forecast 2025-2030 ($ million)
Chart on The Netherlands - Year-over-year growth 2025-2030 (%)
Data Table on The Netherlands - Year-over-year growth 2025-2030 (%)

13.5 APAC - Market size and forecast 2025-2030

Chart on APAC - Market size and forecast 2025-2030 ($ million)
Data Table on APAC - Market size and forecast 2025-2030 ($ million)
Chart on APAC - Year-over-year growth 2025-2030 (%)
Data Table on APAC - Year-over-year growth 2025-2030 (%)
Chart on Regional Comparison - APAC
Data Table on Regional Comparison - APAC

13.5.1 China - Market size and forecast 2025-2030

Chart on China - Market size and forecast 2025-2030 ($ million)
Data Table on China - Market size and forecast 2025-2030 ($ million)
Chart on China - Year-over-year growth 2025-2030 (%)
Data Table on China - Year-over-year growth 2025-2030 (%)

13.5.2 India - Market size and forecast 2025-2030

Chart on India - Market size and forecast 2025-2030 ($ million)
Data Table on India - Market size and forecast 2025-2030 ($ million)
Chart on India - Year-over-year growth 2025-2030 (%)
Data Table on India - Year-over-year growth 2025-2030 (%)

13.5.3 Japan - Market size and forecast 2025-2030

Chart on Japan - Market size and forecast 2025-2030 ($ million)
Data Table on Japan - Market size and forecast 2025-2030 ($ million)
Chart on Japan - Year-over-year growth 2025-2030 (%)
Data Table on Japan - Year-over-year growth 2025-2030 (%)

13.5.4 South Korea - Market size and forecast 2025-2030

Chart on South Korea - Market size and forecast 2025-2030 ($ million)
Data Table on South Korea - Market size and forecast 2025-2030 ($ million)
Chart on South Korea - Year-over-year growth 2025-2030 (%)
Data Table on South Korea - Year-over-year growth 2025-2030 (%)

13.5.5 Australia - Market size and forecast 2025-2030

Chart on Australia - Market size and forecast 2025-2030 ($ million)
Data Table on Australia - Market size and forecast 2025-2030 ($ million)
Chart on Australia - Year-over-year growth 2025-2030 (%)
Data Table on Australia - Year-over-year growth 2025-2030 (%)

13.5.6 Indonesia - Market size and forecast 2025-2030

Chart on Indonesia - Market size and forecast 2025-2030 ($ million)
Data Table on Indonesia - Market size and forecast 2025-2030 ($ million)
Chart on Indonesia - Year-over-year growth 2025-2030 (%)
Data Table on Indonesia - Year-over-year growth 2025-2030 (%)

13.6 South America - Market size and forecast 2025-2030

Chart on South America - Market size and forecast 2025-2030 ($ million)
Data Table on South America - Market size and forecast 2025-2030 ($ million)
Chart on South America - Year-over-year growth 2025-2030 (%)
Data Table on South America - Year-over-year growth 2025-2030 (%)
Chart on Regional Comparison - South America
Data Table on Regional Comparison - South America

13.6.1 Brazil - Market size and forecast 2025-2030

Chart on Brazil - Market size and forecast 2025-2030 ($ million)
Data Table on Brazil - Market size and forecast 2025-2030 ($ million)
Chart on Brazil - Year-over-year growth 2025-2030 (%)
Data Table on Brazil - Year-over-year growth 2025-2030 (%)

13.6.2 Argentina - Market size and forecast 2025-2030

Chart on Argentina - Market size and forecast 2025-2030 ($ million)
Data Table on Argentina - Market size and forecast 2025-2030 ($ million)
Chart on Argentina - Year-over-year growth 2025-2030 (%)
Data Table on Argentina - Year-over-year growth 2025-2030 (%)

13.6.3 Chile - Market size and forecast 2025-2030

Chart on Chile - Market size and forecast 2025-2030 ($ million)
Data Table on Chile - Market size and forecast 2025-2030 ($ million)
Chart on Chile - Year-over-year growth 2025-2030 (%)
Data Table on Chile - Year-over-year growth 2025-2030 (%)

13.7 Middle East and Africa - Market size and forecast 2025-2030

Chart on Middle East and Africa - Market size and forecast 2025-2030 ($ million)
Data Table on Middle East and Africa - Market size and forecast 2025-2030 ($ million)
Chart on Middle East and Africa - Year-over-year growth 2025-2030 (%)
Data Table on Middle East and Africa - Year-over-year growth 2025-2030 (%)
Chart on Regional Comparison - Middle East and Africa
Data Table on Regional Comparison - Middle East and Africa

13.7.1 South Africa - Market size and forecast 2025-2030

Chart on South Africa - Market size and forecast 2025-2030 ($ million)
Data Table on South Africa - Market size and forecast 2025-2030 ($ million)
Chart on South Africa - Year-over-year growth 2025-2030 (%)
Data Table on South Africa - Year-over-year growth 2025-2030 (%)

13.7.2 Saudi Arabia - Market size and forecast 2025-2030

Chart on Saudi Arabia - Market size and forecast 2025-2030 ($ million)
Data Table on Saudi Arabia - Market size and forecast 2025-2030 ($ million)
Chart on Saudi Arabia - Year-over-year growth 2025-2030 (%)
Data Table on Saudi Arabia - Year-over-year growth 2025-2030 (%)

13.7.3 Egypt - Market size and forecast 2025-2030

Chart on Egypt - Market size and forecast 2025-2030 ($ million)
Data Table on Egypt - Market size and forecast 2025-2030 ($ million)
Chart on Egypt - Year-over-year growth 2025-2030 (%)
Data Table on Egypt - Year-over-year growth 2025-2030 (%)

13.7.4 Turkey - Market size and forecast 2025-2030

Chart on Turkey - Market size and forecast 2025-2030 ($ million)
Data Table on Turkey - Market size and forecast 2025-2030 ($ million)
Chart on Turkey - Year-over-year growth 2025-2030 (%)
Data Table on Turkey - Year-over-year growth 2025-2030 (%)

13.7.5 Israel - Market size and forecast 2025-2030

Chart on Israel - Market size and forecast 2025-2030 ($ million)
Data Table on Israel - Market size and forecast 2025-2030 ($ million)
Chart on Israel - Year-over-year growth 2025-2030 (%)
Data Table on Israel - Year-over-year growth 2025-2030 (%)

13.8 Market opportunity by geography

Market opportunity by geography ($ million)
Data Tables on Market opportunity by geography ($ million)

14. Drivers, Challenges, and Opportunity

14.1 Market drivers

Integration of precision agriculture and advanced application technologies
Escalating global demand for enhanced crop productivity and yield optimization
Stringent regulatory frameworks and shift toward sustainable farming practice

14.2 Market challenges

Inconsistency in field performance due to environmental and technical variability
High initial capital expenditure and sustained research and development costs
Complexity of mixture compatibility and sophisticated formulation chemistry

14.3 Impact of drivers and challenges

Impact of drivers and challenges in 2025 and 2030

14.4 Market opportunities

Expansion of unmanned aerial systems and drone-specific adjuvant formulations
Rise of tank-mix customization and field-specific agrochemical optimization
Advancements in bio-based surfactant technologies

15. Competitive Landscape

15.1 Overview

15.2

Overview on criticality of inputs and factors of differentiation

15.3 Landscape disruption

Overview on factors of disruption

15.4 Industry risks

Impact of key risks on business

16. Competitive Analysis

16.1 Companies profiled

Companies covered

16.2 Company ranking index

16.3 Market positioning of companies

Matrix on companies position and classification

16.4 Akzo Nobel NV

Akzo Nobel NV - Overview
Akzo Nobel NV - Business segments
Akzo Nobel NV - Key offerings
Akzo Nobel NV - Segment focus
SWOT

16.5 BASF SE

BASF SE - Overview
BASF SE - Business segments
BASF SE - Key news
BASF SE - Key offerings
BASF SE - Segment focus
SWOT

16.6 Bayer AG

Bayer AG - Overview
Bayer AG - Business segments
Bayer AG - Key offerings
Bayer AG - Segment focus
SWOT

16.7 Clariant International Ltd.

Clariant International Ltd. - Overview
Clariant International Ltd. - Business segments
Clariant International Ltd. - Key offerings
Clariant International Ltd. - Segment focus
SWOT

16.8 Corteva Inc.

Corteva Inc. - Overview
Corteva Inc. - Business segments
Corteva Inc. - Key offerings
Corteva Inc. - Segment focus
SWOT

16.9 Croda International Plc

Croda International Plc - Overview
Croda International Plc - Business segments
Croda International Plc - Key offerings
Croda International Plc - Segment focus
SWOT

16.10 Evonik Industries AG

Evonik Industries AG - Overview
Evonik Industries AG - Business segments
Evonik Industries AG - Key offerings
Evonik Industries AG - Segment focus
SWOT

16.11 Huntsman International LLC

Huntsman International LLC - Overview
Huntsman International LLC - Business segments
Huntsman International LLC - Key offerings
Huntsman International LLC - Segment focus
SWOT

16.12 Land O Lakes Inc.

Land O Lakes Inc. - Overview
Land O Lakes Inc. - Product / Service
Land O Lakes Inc. - Key offerings
SWOT

16.13 Marubeni Corp.

Marubeni Corp. - Overview
Marubeni Corp. - Business segments
Marubeni Corp. - Key offerings
Marubeni Corp. - Segment focus
SWOT

16.14 Nouryon Chemicals Holding B.V.

Nouryon Chemicals Holding B.V. - Overview
Nouryon Chemicals Holding B.V. - Product / Service
Nouryon Chemicals Holding B.V. - Key offerings
SWOT

16.15 Nufarm Ltd.

Nufarm Ltd. - Overview
Nufarm Ltd. - Business segments
Nufarm Ltd. - Key offerings
Nufarm Ltd. - Segment focus
SWOT

16.16 Solvay SA

Solvay SA - Overview
Solvay SA - Business segments
Solvay SA - Key offerings
Solvay SA - Segment focus
SWOT

16.17 Stepan Co.

Stepan Co. - Overview
Stepan Co. - Business segments
Stepan Co. - Key offerings
Stepan Co. - Segment focus
SWOT

16.18 Wilbur Ellis Holdings Inc.

Wilbur Ellis Holdings Inc. - Overview
Wilbur Ellis Holdings Inc. - Product / Service
Wilbur Ellis Holdings Inc. - Key offerings
SWOT

17. Appendix

17.1 Scope of the report

Market definition
Objectives
Notes and caveats

17.2 Inclusions and exclusions checklist

Inclusions checklist
Exclusions checklist

17.3 Currency conversion rates for US$

17.4 Research methodology

17.5 Data procurement

Information sources

17.6 Data validation

17.7 Validation techniques employed for market sizing

17.8 Data synthesis

17.9 360 degree market analysis

17.10 List of abbreviations

Research Methodology

Technavio presents a detailed picture of the market by way of study, synthesis, and summation of data from multiple sources. The analysts have presented the various facets of the market with a particular focus on identifying the key industry influencers. The data thus presented is comprehensive, reliable, and the result of extensive research, both primary and secondary.

INFORMATION SOURCES

Primary sources

  • Manufacturers and suppliers
  • Channel partners
  • Industry experts
  • Strategic decision makers

Secondary sources

  • Industry journals and periodicals
  • Government data
  • Financial reports of key industry players
  • Historical data
  • Press releases

DATA ANALYSIS

Data Synthesis

  • Collation of data
  • Estimation of key figures
  • Analysis of derived insights

Data Validation

  • Triangulation with data models
  • Reference against proprietary databases
  • Corroboration with industry experts

REPORT WRITING

Qualitative

  • Market drivers
  • Market challenges
  • Market trends
  • Five forces analysis

Quantitative

  • Market size and forecast
  • Market segmentation
  • Geographical insights
  • Competitive landscape

Interested in this report?

Get your sample now to see our research methodology and insights!

Download Now

Frequently Asked Questions

Agricultural Adjuvant market growth will increase by USD 1396.0 million during 2026-2030.

The Agricultural Adjuvant market is expected to grow at a CAGR of 5.8% during 2026-2030.

Agricultural Adjuvant market is segmented by Type (Activator adjuvants, Utility adjuvants) Application (Herbicide, Fungicide, Insecticide, Others) Crop type (Cereals and grains, Oilseeds and pulses, Fruits and vegetables, Others) Formulation (Emulsifiable concentrators, Suspension concentrates)

Akzo Nobel NV, BASF SE, Bayer AG, Brandt Group, Clariant International Ltd., Corteva Inc., Croda International Plc, Drexel Chemical Co., Evonik Industries AG, GarrCo Products Inc., Huntsman International LLC, Interagro UK Ltd., Lamberti SpA, Land O Lakes Inc., Marubeni Corp., Nouryon Chemicals Holding B.V., Nufarm Ltd., Solvay SA, Stepan Co., Wilbur Ellis Holdings Inc. are a few of the key vendors in the Agricultural Adjuvant market.

North America will register the highest growth rate of 41.6% among the other regions. Therefore, the Agricultural Adjuvant market in North America is expected to garner significant business opportunities for the vendors during the forecast period.

US, Canada, Mexico, Germany, France, UK, Spain, Italy, The Netherlands, China, India, Japan, South Korea, Australia, Indonesia, Brazil, Argentina, Chile, South Africa, Saudi Arabia, Egypt, Turkey, Israel

  • Integration of precision agriculture and advanced application technologies is the driving factor this market.

The Agricultural Adjuvant market vendors should focus on grabbing business opportunities from the Type segment as it accounted for the largest market share in the base year.
RIA - Research AI Assistant
Ask RIA