AI For Sales Market Analysis, Size, and Forecast 2025-2029: North America (US and Canada), Europe (France, Germany, The Netherlands, and UK), APAC (China, India, Singapore, and South Korea), and Rest of World (ROW)

AI For Sales Market Analysis, Size, and Forecast 2025-2029:
North America (US and Canada), Europe (France, Germany, The Netherlands, and UK), APAC (China, India, Singapore, and South Korea), and Rest of World (ROW)

Published: Aug 2025 258 Pages SKU: IRTNTR80895

Market Overview at a Glance

$37.43 B
Market Opportunity
22.1%
CAGR
20.3
YoY growth 2024-2025(%)

AI for Sales Market Size 2025-2029

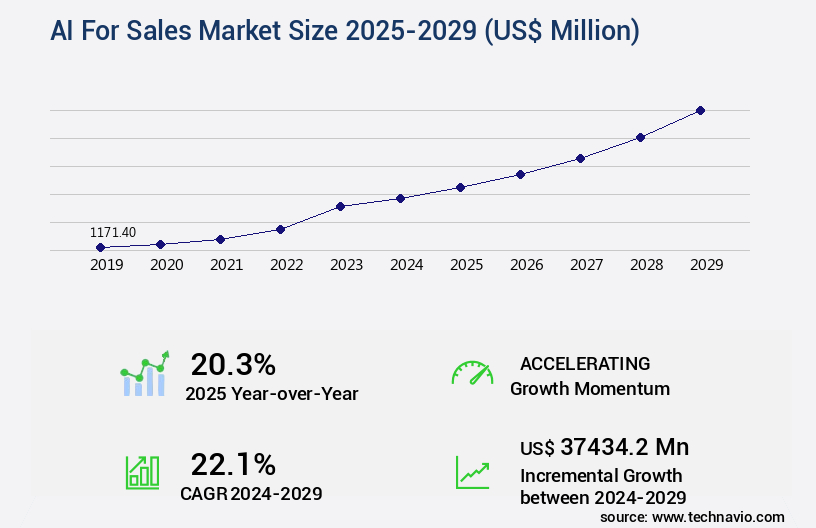
The ai for sales market size is valued to increase by USD 37.43 billion, at a CAGR of 22.1% from 2024 to 2029. Proliferation of generative AI and its transformative integration into core sales platforms will drive the ai for sales market.

Market Insights

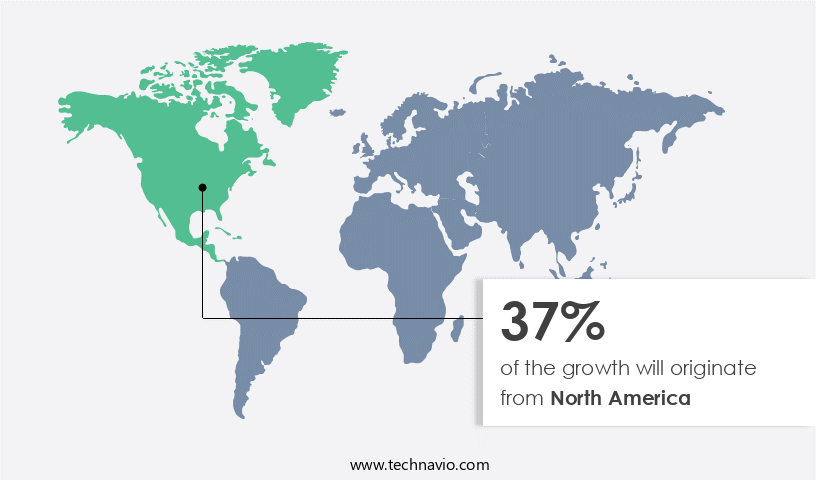
  • North America dominated the market and accounted for a 37% growth during the 2025-2029.
  • By Component - Software segment was valued at USD 675.10 billion in 2023
  • By Deployment - Public cloud segment accounted for the largest market revenue share in 2023

Market Size & Forecast

  • Market Opportunities: USD 4.00 million 
  • Market Future Opportunities 2024: USD 37434.20 million
  • CAGR from 2024 to 2029 : 22.1%

Market Summary

  • The market is experiencing significant growth as businesses increasingly adopt generative AI to transform their sales platforms. According to recent studies, over 70% of sales teams using AI report increased productivity and efficiency. This technology is imperative for hyper-personalization and enhancing customer experience, enabling sales teams to provide tailored solutions and recommendations. However, the integration of AI into sales processes also presents complex challenges. Navigating the web of data privacy, security, and ethical considerations is crucial to ensure compliance and build trust with customers. For instance, a leading manufacturing company leverages AI to optimize its supply chain operations, analyzing customer demand patterns and predicting inventory needs.
  • This not only improves operational efficiency but also enables the company to deliver products faster and more accurately. As AI continues to evolve, businesses must stay informed of the latest trends and best practices to effectively leverage this technology and maintain a competitive edge.

What will be the size of the AI For Sales Market during the forecast period?

AI For Sales Market Size

Get Key Insights on Market Forecast (PDF) Request Free Sample

  • The market continues to evolve, integrating advanced technologies such as machine learning algorithms, natural language processing, and predictive modeling techniques to streamline sales processes and enhance performance. One trend gaining traction is sales forecasting accuracy, which can significantly impact budgeting and product strategy decisions at the boardroom level. According to recent studies, AI-driven sales forecasting solutions can improve accuracy by up to 20% compared to traditional methods, enabling businesses to make data-driven decisions and optimize resources accordingly. Cloud-based sales platforms and sales reporting dashboards are increasingly popular, providing real-time sales data visualization and sales performance improvement. Hybrid sales solutions that combine on-premise and cloud-based functionalities offer flexibility and scalability.
  • Sales pipeline management and deal progression analysis are also critical areas where AI can add value, with deep learning applications enabling automatic lead qualification and customer segmentation. Sales team collaboration and sales content personalization are other areas where AI can enhance productivity. Sales strategy development and customer journey mapping can benefit from big data analytics and predictive modeling techniques. Sales process automation and sales target setting can also be optimized using AI, enabling sales teams to focus on high-value activities and improve overall efficiency. In conclusion, the market is transforming the way businesses manage their sales processes, enabling more accurate forecasting, improved productivity, and data-driven decision-making.
  • By integrating AI technologies such as machine learning, natural language processing, and predictive modeling, sales teams can optimize their operations, enhance performance, and stay competitive in today's dynamic business environment.

Unpacking the AI For Sales Market Landscape

In today's dynamic sales market, businesses are leveraging advanced AI technologies to optimize sales content, analyze sales calls, and integrate Salesforce with AI for enhanced productivity. According to recent studies, AI-driven sales content optimization can increase sales team productivity by up to 25%, while sales call analysis using conversational AI chatbots can improve sales effectiveness metrics by identifying opportunities for improvement in real-time. Furthermore, AI integration in salesforce can provide personalized recommendations based on customer relationship management data, lead scoring models, and sales data integration. Sales territory optimization using predictive analytics and sales engagement platforms can streamline sales processes, leading to cost savings and improved ROI.

Moreover, AI-powered sales forecasting, sales performance dashboards, and revenue optimization AI can help businesses make data-driven sales strategies, predict deal closure, and identify sales opportunities. Customer segmentation AI and account-based marketing AI can enable targeted personalized email marketing, while predictive lead routing and prospect identification AI can optimize sales pipeline automation. Sales intelligence platforms, AI-driven sales coaching, and sales training simulations can enhance sales team skills and performance. Contract lifecycle management and sales process optimization can ensure compliance and efficiency, while predictive sales analytics can help businesses anticipate churn and take proactive measures. Marketing automation integration and deal closure prediction models can further streamline sales operations, making AI an indispensable tool for modern sales teams.

Key Market Drivers Fueling Growth

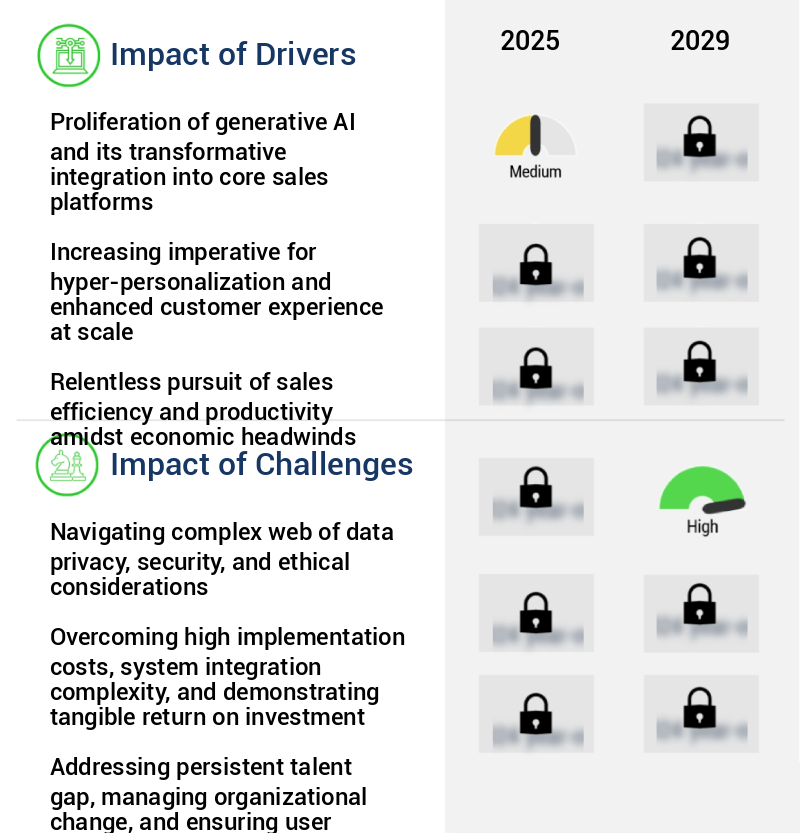
The integration of generative AI into core sales platforms, marked by its widespread adoption and growth, serves as the primary market driver.

  • The market is undergoing an unprecedented transformation, driven by the emergence and integration of generative artificial intelligence. Previously, AI in sales was predominantly utilized for predictive analytics, such as lead scoring or churn prediction, offering valuable but passive insights. However, the current trend is shifting towards active, generative AI that actively engages in the sales workflow. This evolution from analytical AI to generative AI significantly enhances the value proposition of these tools, making them indispensable collaborators for sales professionals instead of passive analytical engines. The democratization of advanced large language models has empowered developers to create tools capable of drafting personalized emails, generating persuasive product descriptions, summarizing lengthy client calls into actionable notes, and even creating dynamic sales scripts in real-time.
  • Another study revealed that sales teams using AI-powered tools experience an average of 15% increase in productivity and a 10% reduction in sales cycle length.

Prevailing Industry Trends & Opportunities

The imperative trend in the market is hyper-personalization for a professional, knowledgeable, and enhanced customer experience. 

  • In today's business world, the necessity for hyper-personalized customer interactions has become a primary catalyst fueling the growth of AI for sales applications. With the increasing saturation of information and heightened customer expectations, traditional sales methods no longer suffice, particularly in the B2B sector. Modern buyers demand tailored engagements that address their unique industry challenges and organizational context. Artificial intelligence (AI) serves as the technological backbone to deliver such personalization at an unprecedented scale. AI platforms process and analyze extensive datasets from multiple sources, such as customer relationship management systems, enterprise resource planning software, social media activity, firmographic data, and records of past interactions.
  • By leveraging AI, businesses can enhance forecast accuracy, boost conversion rates, and foster stronger customer relationships. The ability to understand and respond to customer needs in a timely and effective manner sets companies apart in a competitive market.

Significant Market Challenges

The intricate web of data privacy, security, and ethical considerations poses a significant challenge to the industry's growth, requiring professionals to navigate these complexities with expertise and rigor. 

  • The market is undergoing significant evolution, expanding its reach across various sectors to optimize sales processes and enhance customer engagement. These advanced technologies process and analyze vast amounts of data, making them indispensable tools in today's data-driven business environment. This surge in adoption is driven by the need to streamline sales operations, improve customer experiences, and gain a competitive edge. However, the implementation of AI for sales technologies poses challenges related to data privacy, security, and ethics.
  • With the increasing importance of data protection regulations like the GDPR and CCPA, ensuring compliance is no longer an option but a necessity. 

AI For Sales Market Size

In-Depth Market Segmentation: AI For Sales Market

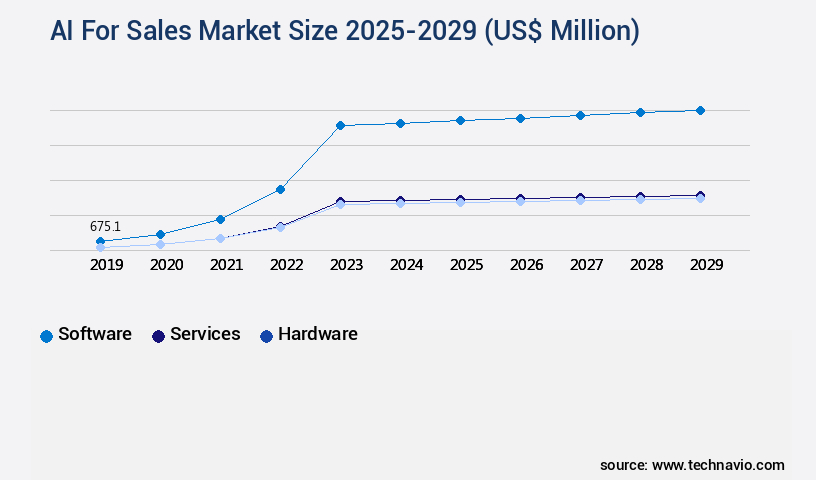
The ai for sales industry research report provides comprehensive data (region-wise segment analysis), with forecasts and estimates in "USD million" for the period 2025-2029, as well as historical data from 2019-2023 for the following segments.

  • Component
    • Software
    • Services
    • Hardware
  • Deployment
    • Public cloud
    • Hybrid
    • On premises
  • Application
    • Predictive analytics
    • Customer experience
    • Sentiment analysis
    • Content marketing
  • End-user
    • Retail
    • Banking
    • Manufacturing
    • Healthcare
  • Geography
    • North America
      • US
      • Canada
    • Europe
      • France
      • Germany
      • The Netherlands
      • UK
    • APAC
      • China
      • India
      • Singapore
      • South Korea
    • Rest of World (ROW)

By Component Insights

The software segment is estimated to witness significant growth during the forecast period.

The market continues to evolve, with software solutions leading the charge. According to recent reports, the software segment accounts for over 70% of the market share, delivered primarily through the Software as a Service model. These platforms offer advanced capabilities, including sales content optimization, sales call analysis, salesforce integration AI, sales team productivity, personalized recommendations AI, customer relationship management, sales data integration, lead scoring models, sales territory optimization, sales engagement platforms, sales compensation plans, customer segmentation AI, sales pipeline automation, AI-driven sales coaching, data-driven sales strategies, AI-powered sales forecasting, sales performance dashboards, account-based marketing AI, personalized email marketing, revenue optimization AI, contract lifecycle management, sales process optimization, sales intelligence platforms, predictive lead routing, prospect identification AI, predictive sales analytics, conversational AI chatbots, sales effectiveness metrics, deal closure prediction, sales opportunity identification, sales training simulations, marketing automation integration, and churn prediction models.

Leading CRM providers like Salesforce, Microsoft, and HubSpot have integrated AI tools, such as Sales GPT and Service GPT, into their offerings, enabling automated email drafting, call summarization, and personalized communication at scale.

AI For Sales Market Size

Request Free Sample

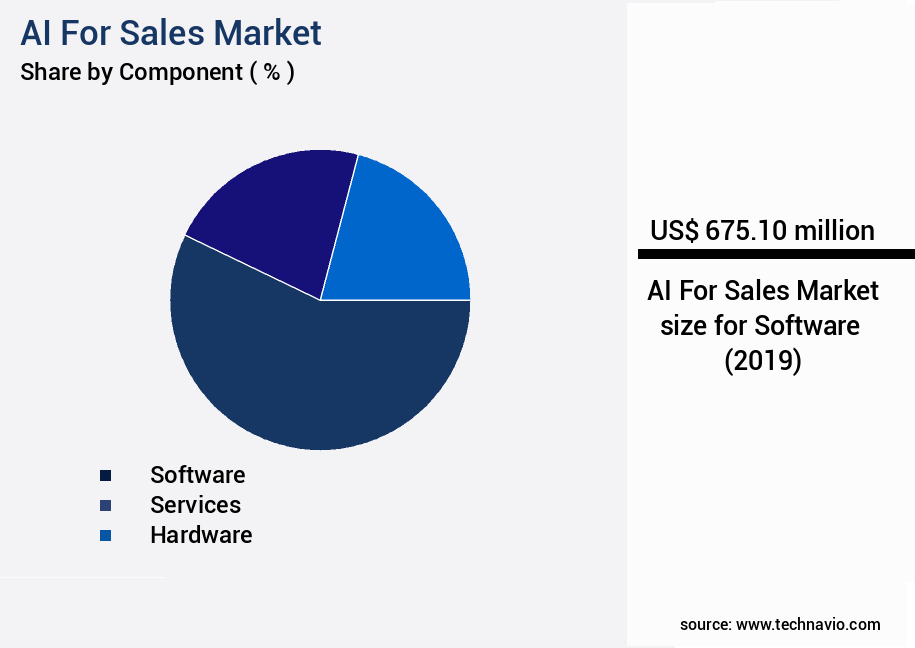
The Software segment was valued at USD 675.10 billion in 2019 and showed a gradual increase during the forecast period.

AI For Sales Market Size

Request Free Sample

Regional Analysis

North America is estimated to contribute 37% to the growth of the global market during the forecast period.Technavio's analysts have elaborately explained the regional trends and drivers that shape the market during the forecast period.

AI For Sales Market Share by Geography

See How AI For Sales Market Demand is Rising in North America Request Free Sample

The market is experiencing significant growth, with North America leading the charge as the undisputed global leader. This region's advantage is rooted in its mature technological infrastructure, a high concentration of leading AI companies, and substantial venture capital investment. In the United States alone, AI-powered sales tools are seeing widespread adoption across industries, including technology, financial services, retail, and healthcare. This trend is fueled by the intensely competitive business landscape, where companies are continually seeking operational efficiencies, customer personalization, and revenue optimization. Advanced AI functionalities, such as predictive lead scoring, natural language processing for sentiment analysis in sales calls, and generative AI for creating personalized outreach content, have become standard practice for large enterprises and are rapidly permeating the small and medium-sized business sector.

AI For Sales Market Share by Geography

 Customer Landscape of AI For Sales Industry

Competitive Intelligence by Technavio Analysis: Leading Players in the AI for Sales Market

Companies are implementing various strategies, such as strategic alliances, ai for sales market forecast, partnerships, mergers and acquisitions, geographical expansion, and product/service launches, to enhance their presence in the industry.

Affinity - The company provides a robust foundation for creating tailored business solutions. Amazon SageMaker facilitates the development of sophisticated machine learning models, enhancing sales processes. Amazon Connect and Contact Lens integrate AI technology to analyze sales calls, offering valuable conversation insights.

The industry research and growth report includes detailed analyses of the competitive landscape of the market and information about key companies, including:

  • Affinity
  • Amazon Web Services Inc.
  • Clari Inc.
  • Cresta
  • Demandbase Inc.
  • Drift.com Inc.
  • Freshworks Inc.
  • Gong.io Inc.
  • Google LLC
  • HubSpot Inc.
  • International Business Machines Corp.
  • Microsoft Corp.
  • OpenAI
  • Oracle Corp.
  • Outreach Corp.
  • People.ai
  • Regie.ai
  • Salesloft Inc.
  • Zoho Corp. Pvt. Ltd.

Qualitative and quantitative analysis of companies has been conducted to help clients understand the wider business environment as well as the strengths and weaknesses of key industry players. Data is qualitatively analyzed to categorize companies as pure play, category-focused, industry-focused, and diversified; it is quantitatively analyzed to categorize companies as dominant, leading, strong, tentative, and weak.

Recent Development and News in AI for Sales Market

  • In August 2024, Salesforce, a leading CRM provider, announced the launch of Salesforce Einstein GPT, an AI-powered sales assistant designed to generate personalized emails and recommendations for sales professionals. This new product expansion underscores Salesforce's commitment to leveraging AI in sales and marks a significant advancement in the market (Salesforce Press Release, 2024).
  • In January 2025, Microsoft and LinkedIn, two tech giants, entered into a strategic partnership to integrate Microsoft's AI-powered sales solution, Dynamics 365, with LinkedIn's professional networking platform. This collaboration aims to provide sales teams with enhanced lead generation and prospecting capabilities (Microsoft News Center, 2025).
  • In March 2025, IBM announced the acquisition of Predixion Software, a leading AI-based predictive analytics and machine learning solutions provider. This acquisition is expected to strengthen IBM's AI for Sales offerings and expand its market presence (IBM Press Release, 2025).
  • In May 2025, Google Cloud and Zillow, the real estate marketplace, announced a partnership to integrate Google's AI-powered sales solutions into Zillow's platform. This collaboration will enable real estate agents to use AI to analyze market trends, generate leads, and personalize customer interactions (Google Cloud Blog, 2025).

Dive into Technavio's robust research methodology, blending expert interviews, extensive data synthesis, and validated models for unparalleled AI For Sales Market insights. See full methodology.

Market Scope

Report Coverage

Details

Page number

258

Base year

2024

Historic period

2019-2023

Forecast period

2025-2029

Growth momentum & CAGR

Accelerate at a CAGR of 22.1%

Market growth 2025-2029

USD 37434.2 million

Market structure

Fragmented

YoY growth 2024-2025(%)

20.3

Key countries

US, China, India, UK, Singapore, Canada, France, South Korea, The Netherlands, and Germany

Competitive landscape

Leading Companies, Market Positioning of Companies, Competitive Strategies, and Industry Risks

Request Free Sample

Why Choose Technavio for AI for Sales Market Insights?

"Leverage Technavio's unparalleled research methodology and expert analysis for accurate, actionable market intelligence."

The market is experiencing rapid growth as businesses increasingly leverage artificial intelligence (AI) to enhance their sales processes and gain a competitive edge. AI for sales refers to the use of advanced machine learning algorithms and predictive analytics to automate and optimize various sales functions, from lead generation and qualification to forecasting and customer engagement. Compared to traditional sales methods, AI for sales offers numerous advantages.

For instance, AI can analyze vast amounts of data in real-time, enabling sales teams to identify trends, opportunities, and risks that might otherwise go unnoticed. Moreover, AI can help sales teams prioritize leads based on their likelihood to convert, reducing the time spent on unqualified leads and increasing overall efficiency. AI for sales also offers significant improvements in customer engagement. With natural language processing and sentiment analysis capabilities, AI can understand customer needs and preferences, enabling sales teams to provide personalized recommendations and offers.

Furthermore, AI-powered chatbots and virtual assistants can handle routine inquiries, freeing up sales representatives to focus on high-value interactions. The integration of AI in sales processes is not without challenges, however. One of the primary concerns is data privacy and security, as AI relies on large amounts of data to function effectively. Companies must ensure that they have robust data security measures in place to protect sensitive customer information. Despite these challenges, the benefits of AI for sales far outweigh the risks. According to a recent study, companies that use AI for sales see a 10% increase in revenue growth compared to those that don't.

Furthermore, AI can help sales teams adapt to changing market conditions and customer preferences, enabling them to respond quickly and effectively to new opportunities. In conclusion, The market is poised for significant growth as more businesses recognize the benefits of using AI to optimize their sales processes. From lead generation and qualification to customer engagement and forecasting, AI offers numerous advantages over traditional sales methods, making it an essential tool for sales teams looking to stay competitive in today's fast-paced business environment.

What are the Key Data Covered in this AI for Sales Market Research and Growth Report?

  • What is the expected growth of the AI For Sales Market between 2025 and 2029?

    • USD 37.43 billion, at a CAGR of 22.1%

  • What segmentation does the market report cover?

    • The report is segmented by Component (Software, Services, and Hardware), Deployment (Public cloud, Hybrid, and On premises), Application (Predictive analytics, Customer experience, Sentiment analysis, and Content marketing), End-user (Retail, Banking, Manufacturing, and Healthcare), and Geography (North America, APAC, Europe, South America, and Middle East and Africa)

  • Which regions are analyzed in the report?

    • North America, APAC, Europe, South America, and Middle East and Africa

  • What are the key growth drivers and market challenges?

    • Proliferation of generative AI and its transformative integration into core sales platforms, Navigating complex web of data privacy, security, and ethical considerations

  • Who are the major players in the AI For Sales Market?

    • Affinity, Amazon Web Services Inc., Clari Inc., Cresta, Demandbase Inc., Drift.com Inc., Freshworks Inc., Gong.io Inc., Google LLC, HubSpot Inc., International Business Machines Corp., Microsoft Corp., OpenAI, Oracle Corp., Outreach Corp., People.ai, Regie.ai, Salesloft Inc., and Zoho Corp. Pvt. Ltd.

We can help! Our analysts can customize this ai for sales market research report to meet your requirements.

Get in touch

1 Executive Summary

  • 1.1 Market overview
    • Executive Summary - Chart on Market Overview
    • Executive Summary - Data Table on Market Overview
    • Executive Summary - Chart on Global Market Characteristics
    • Executive Summary - Chart on Market by Geography
    • Executive Summary - Chart on Market Segmentation by Component
    • Executive Summary - Chart on Market Segmentation by Deployment
    • Executive Summary - Chart on Market Segmentation by Application
    • Executive Summary - Chart on Market Segmentation by End-user
    • Executive Summary - Chart on Incremental Growth
    • Executive Summary - Data Table on Incremental Growth
    • Executive Summary - Chart on Company Market Positioning

2 Technavio Analysis

  • 2.1 Analysis of price sensitivity, lifecycle, customer purchase basket, adoption rates, and purchase criteria
    • Analysis of price sensitivity, lifecycle, customer purchase basket, adoption rates, and purchase criteria
  • 2.2 Criticality of inputs and Factors of differentiation
    • Overview on criticality of inputs and factors of differentiation
  • 2.3 Factors of disruption
    • Overview on factors of disruption
  • 2.4 Impact of drivers and challenges
    • Impact of drivers and challenges in 2024 and 2029

3 Market Landscape

  • 3.1 Market ecosystem
    • Parent Market
    • Data Table on - Parent Market
  • 3.2 Market characteristics
    • Market characteristics analysis
  • 3.3 Value chain analysis
    • Value chain analysis

4 Market Sizing

  • 4.1 Market definition
    • Offerings of companies included in the market definition
  • 4.2 Market segment analysis
    • Market segments
  • 4.3 Market size 2024
    • 4.4 Market outlook: Forecast for 2024-2029
      • Chart on Global - Market size and forecast 2024-2029 ($ million)
      • Data Table on Global - Market size and forecast 2024-2029 ($ million)
      • Chart on Global Market: Year-over-year growth 2024-2029 (%)
      • Data Table on Global Market: Year-over-year growth 2024-2029 (%)

    5 Historic Market Size

    • 5.1 Global AI For Sales Market 2019 - 2023
      • Historic Market Size - Data Table on Global AI For Sales Market 2019 - 2023 ($ million)
    • 5.2 Component segment analysis 2019 - 2023
      • Historic Market Size - Component Segment 2019 - 2023 ($ million)
    • 5.3 Deployment segment analysis 2019 - 2023
      • Historic Market Size - Deployment Segment 2019 - 2023 ($ million)
    • 5.4 Application segment analysis 2019 - 2023
      • Historic Market Size - Application Segment 2019 - 2023 ($ million)
    • 5.5 End-user segment analysis 2019 - 2023
      • Historic Market Size - End-user Segment 2019 - 2023 ($ million)
    • 5.6 Geography segment analysis 2019 - 2023
      • Historic Market Size - Geography Segment 2019 - 2023 ($ million)
    • 5.7 Country segment analysis 2019 - 2023
      • Historic Market Size - Country Segment 2019 - 2023 ($ million)

    6 Five Forces Analysis

    • 6.1 Five forces summary
      • Five forces analysis - Comparison between 2024 and 2029
    • 6.2 Bargaining power of buyers
      • Bargaining power of buyers - Impact of key factors 2024 and 2029
    • 6.3 Bargaining power of suppliers
      • Bargaining power of suppliers - Impact of key factors in 2024 and 2029
    • 6.4 Threat of new entrants
      • Threat of new entrants - Impact of key factors in 2024 and 2029
    • 6.5 Threat of substitutes
      • Threat of substitutes - Impact of key factors in 2024 and 2029
    • 6.6 Threat of rivalry
      • Threat of rivalry - Impact of key factors in 2024 and 2029
    • 6.7 Market condition
      • Chart on Market condition - Five forces 2024 and 2029

    7 Market Segmentation by Component

    • 7.1 Market segments
      • Chart on Component - Market share 2024-2029 (%)
      • Data Table on Component - Market share 2024-2029 (%)
    • 7.2 Comparison by Component
      • Chart on Comparison by Component
      • Data Table on Comparison by Component
    • 7.3 Software - Market size and forecast 2024-2029
      • Chart on Software - Market size and forecast 2024-2029 ($ million)
      • Data Table on Software - Market size and forecast 2024-2029 ($ million)
      • Chart on Software - Year-over-year growth 2024-2029 (%)
      • Data Table on Software - Year-over-year growth 2024-2029 (%)
    • 7.4 Services - Market size and forecast 2024-2029
      • Chart on Services - Market size and forecast 2024-2029 ($ million)
      • Data Table on Services - Market size and forecast 2024-2029 ($ million)
      • Chart on Services - Year-over-year growth 2024-2029 (%)
      • Data Table on Services - Year-over-year growth 2024-2029 (%)
    • 7.5 Hardware - Market size and forecast 2024-2029
      • Chart on Hardware - Market size and forecast 2024-2029 ($ million)
      • Data Table on Hardware - Market size and forecast 2024-2029 ($ million)
      • Chart on Hardware - Year-over-year growth 2024-2029 (%)
      • Data Table on Hardware - Year-over-year growth 2024-2029 (%)
    • 7.6 Market opportunity by Component
      • Market opportunity by Component ($ million)
      • Data Table on Market opportunity by Component ($ million)

    8 Market Segmentation by Deployment

    • 8.1 Market segments
      • Chart on Deployment - Market share 2024-2029 (%)
      • Data Table on Deployment - Market share 2024-2029 (%)
    • 8.2 Comparison by Deployment
      • Chart on Comparison by Deployment
      • Data Table on Comparison by Deployment
    • 8.3 Public cloud - Market size and forecast 2024-2029
      • Chart on Public cloud - Market size and forecast 2024-2029 ($ million)
      • Data Table on Public cloud - Market size and forecast 2024-2029 ($ million)
      • Chart on Public cloud - Year-over-year growth 2024-2029 (%)
      • Data Table on Public cloud - Year-over-year growth 2024-2029 (%)
    • 8.4 Hybrid - Market size and forecast 2024-2029
      • Chart on Hybrid - Market size and forecast 2024-2029 ($ million)
      • Data Table on Hybrid - Market size and forecast 2024-2029 ($ million)
      • Chart on Hybrid - Year-over-year growth 2024-2029 (%)
      • Data Table on Hybrid - Year-over-year growth 2024-2029 (%)
    • 8.5 On premises - Market size and forecast 2024-2029
      • Chart on On premises - Market size and forecast 2024-2029 ($ million)
      • Data Table on On premises - Market size and forecast 2024-2029 ($ million)
      • Chart on On premises - Year-over-year growth 2024-2029 (%)
      • Data Table on On premises - Year-over-year growth 2024-2029 (%)
    • 8.6 Market opportunity by Deployment
      • Market opportunity by Deployment ($ million)
      • Data Table on Market opportunity by Deployment ($ million)

    9 Market Segmentation by Application

    • 9.1 Market segments
      • Chart on Application - Market share 2024-2029 (%)
      • Data Table on Application - Market share 2024-2029 (%)
    • 9.2 Comparison by Application
      • Chart on Comparison by Application
      • Data Table on Comparison by Application
    • 9.3 Predictive analytics - Market size and forecast 2024-2029
      • Chart on Predictive analytics - Market size and forecast 2024-2029 ($ million)
      • Data Table on Predictive analytics - Market size and forecast 2024-2029 ($ million)
      • Chart on Predictive analytics - Year-over-year growth 2024-2029 (%)
      • Data Table on Predictive analytics - Year-over-year growth 2024-2029 (%)
    • 9.4 Customer experience - Market size and forecast 2024-2029
      • Chart on Customer experience - Market size and forecast 2024-2029 ($ million)
      • Data Table on Customer experience - Market size and forecast 2024-2029 ($ million)
      • Chart on Customer experience - Year-over-year growth 2024-2029 (%)
      • Data Table on Customer experience - Year-over-year growth 2024-2029 (%)
    • 9.5 Sentiment analysis - Market size and forecast 2024-2029
      • Chart on Sentiment analysis - Market size and forecast 2024-2029 ($ million)
      • Data Table on Sentiment analysis - Market size and forecast 2024-2029 ($ million)
      • Chart on Sentiment analysis - Year-over-year growth 2024-2029 (%)
      • Data Table on Sentiment analysis - Year-over-year growth 2024-2029 (%)
    • 9.6 Content marketing - Market size and forecast 2024-2029
      • Chart on Content marketing - Market size and forecast 2024-2029 ($ million)
      • Data Table on Content marketing - Market size and forecast 2024-2029 ($ million)
      • Chart on Content marketing - Year-over-year growth 2024-2029 (%)
      • Data Table on Content marketing - Year-over-year growth 2024-2029 (%)
    • 9.7 Market opportunity by Application
      • Market opportunity by Application ($ million)
      • Data Table on Market opportunity by Application ($ million)

    10 Market Segmentation by End-user

    • 10.1 Market segments
      • Chart on End-user - Market share 2024-2029 (%)
      • Data Table on End-user - Market share 2024-2029 (%)
    • 10.2 Comparison by End-user
      • Chart on Comparison by End-user
      • Data Table on Comparison by End-user
    • 10.3 Retail - Market size and forecast 2024-2029
      • Chart on Retail - Market size and forecast 2024-2029 ($ million)
      • Data Table on Retail - Market size and forecast 2024-2029 ($ million)
      • Chart on Retail - Year-over-year growth 2024-2029 (%)
      • Data Table on Retail - Year-over-year growth 2024-2029 (%)
    • 10.4 Banking - Market size and forecast 2024-2029
      • Chart on Banking - Market size and forecast 2024-2029 ($ million)
      • Data Table on Banking - Market size and forecast 2024-2029 ($ million)
      • Chart on Banking - Year-over-year growth 2024-2029 (%)
      • Data Table on Banking - Year-over-year growth 2024-2029 (%)
    • 10.5 Manufacturing - Market size and forecast 2024-2029
      • Chart on Manufacturing - Market size and forecast 2024-2029 ($ million)
      • Data Table on Manufacturing - Market size and forecast 2024-2029 ($ million)
      • Chart on Manufacturing - Year-over-year growth 2024-2029 (%)
      • Data Table on Manufacturing - Year-over-year growth 2024-2029 (%)
    • 10.6 Healthcare - Market size and forecast 2024-2029
      • Chart on Healthcare - Market size and forecast 2024-2029 ($ million)
      • Data Table on Healthcare - Market size and forecast 2024-2029 ($ million)
      • Chart on Healthcare - Year-over-year growth 2024-2029 (%)
      • Data Table on Healthcare - Year-over-year growth 2024-2029 (%)
    • 10.7 Market opportunity by End-user
      • Market opportunity by End-user ($ million)
      • Data Table on Market opportunity by End-user ($ million)

    11 Customer Landscape

    • 11.1 Customer landscape overview
      • Analysis of price sensitivity, lifecycle, customer purchase basket, adoption rates, and purchase criteria

    12 Geographic Landscape

    • 12.1 Geographic segmentation
      • Chart on Market share by geography 2024-2029 (%)
      • Data Table on Market share by geography 2024-2029 (%)
    • 12.2 Geographic comparison
      • Chart on Geographic comparison
      • Data Table on Geographic comparison
    • 12.3 North America - Market size and forecast 2024-2029
      • Chart on North America - Market size and forecast 2024-2029 ($ million)
      • Data Table on North America - Market size and forecast 2024-2029 ($ million)
      • Chart on North America - Year-over-year growth 2024-2029 (%)
      • Data Table on North America - Year-over-year growth 2024-2029 (%)
    • 12.4 APAC - Market size and forecast 2024-2029
      • Chart on APAC - Market size and forecast 2024-2029 ($ million)
      • Data Table on APAC - Market size and forecast 2024-2029 ($ million)
      • Chart on APAC - Year-over-year growth 2024-2029 (%)
      • Data Table on APAC - Year-over-year growth 2024-2029 (%)
    • 12.5 Europe - Market size and forecast 2024-2029
      • Chart on Europe - Market size and forecast 2024-2029 ($ million)
      • Data Table on Europe - Market size and forecast 2024-2029 ($ million)
      • Chart on Europe - Year-over-year growth 2024-2029 (%)
      • Data Table on Europe - Year-over-year growth 2024-2029 (%)
    • 12.6 South America - Market size and forecast 2024-2029
      • Chart on South America - Market size and forecast 2024-2029 ($ million)
      • Data Table on South America - Market size and forecast 2024-2029 ($ million)
      • Chart on South America - Year-over-year growth 2024-2029 (%)
      • Data Table on South America - Year-over-year growth 2024-2029 (%)
    • 12.7 Middle East and Africa - Market size and forecast 2024-2029
      • Chart on Middle East and Africa - Market size and forecast 2024-2029 ($ million)
      • Data Table on Middle East and Africa - Market size and forecast 2024-2029 ($ million)
      • Chart on Middle East and Africa - Year-over-year growth 2024-2029 (%)
      • Data Table on Middle East and Africa - Year-over-year growth 2024-2029 (%)
    • 12.8 US - Market size and forecast 2024-2029
      • Chart on US - Market size and forecast 2024-2029 ($ million)
      • Data Table on US - Market size and forecast 2024-2029 ($ million)
      • Chart on US - Year-over-year growth 2024-2029 (%)
      • Data Table on US - Year-over-year growth 2024-2029 (%)
    • 12.9 China - Market size and forecast 2024-2029
      • Chart on China - Market size and forecast 2024-2029 ($ million)
      • Data Table on China - Market size and forecast 2024-2029 ($ million)
      • Chart on China - Year-over-year growth 2024-2029 (%)
      • Data Table on China - Year-over-year growth 2024-2029 (%)
    • 12.10 India - Market size and forecast 2024-2029
      • Chart on India - Market size and forecast 2024-2029 ($ million)
      • Data Table on India - Market size and forecast 2024-2029 ($ million)
      • Chart on India - Year-over-year growth 2024-2029 (%)
      • Data Table on India - Year-over-year growth 2024-2029 (%)
    • 12.11 Singapore - Market size and forecast 2024-2029
      • Chart on Singapore - Market size and forecast 2024-2029 ($ million)
      • Data Table on Singapore - Market size and forecast 2024-2029 ($ million)
      • Chart on Singapore - Year-over-year growth 2024-2029 (%)
      • Data Table on Singapore - Year-over-year growth 2024-2029 (%)
    • 12.12 UK - Market size and forecast 2024-2029
      • Chart on UK - Market size and forecast 2024-2029 ($ million)
      • Data Table on UK - Market size and forecast 2024-2029 ($ million)
      • Chart on UK - Year-over-year growth 2024-2029 (%)
      • Data Table on UK - Year-over-year growth 2024-2029 (%)
    • 12.13 Canada - Market size and forecast 2024-2029
      • Chart on Canada - Market size and forecast 2024-2029 ($ million)
      • Data Table on Canada - Market size and forecast 2024-2029 ($ million)
      • Chart on Canada - Year-over-year growth 2024-2029 (%)
      • Data Table on Canada - Year-over-year growth 2024-2029 (%)
    • 12.14 France - Market size and forecast 2024-2029
      • Chart on France - Market size and forecast 2024-2029 ($ million)
      • Data Table on France - Market size and forecast 2024-2029 ($ million)
      • Chart on France - Year-over-year growth 2024-2029 (%)
      • Data Table on France - Year-over-year growth 2024-2029 (%)
    • 12.15 South Korea - Market size and forecast 2024-2029
      • Chart on South Korea - Market size and forecast 2024-2029 ($ million)
      • Data Table on South Korea - Market size and forecast 2024-2029 ($ million)
      • Chart on South Korea - Year-over-year growth 2024-2029 (%)
      • Data Table on South Korea - Year-over-year growth 2024-2029 (%)
    • 12.16 Germany - Market size and forecast 2024-2029
      • Chart on Germany - Market size and forecast 2024-2029 ($ million)
      • Data Table on Germany - Market size and forecast 2024-2029 ($ million)
      • Chart on Germany - Year-over-year growth 2024-2029 (%)
      • Data Table on Germany - Year-over-year growth 2024-2029 (%)
    • 12.17 The Netherlands - Market size and forecast 2024-2029
      • Chart on The Netherlands - Market size and forecast 2024-2029 ($ million)
      • Data Table on The Netherlands - Market size and forecast 2024-2029 ($ million)
      • Chart on The Netherlands - Year-over-year growth 2024-2029 (%)
      • Data Table on The Netherlands - Year-over-year growth 2024-2029 (%)
    • 12.18 Market opportunity by geography
      • Market opportunity by geography ($ million)
      • Data Tables on Market opportunity by geography ($ million)

    13 Drivers, Challenges, and Opportunity/Restraints

    • 13.1 Market drivers
      • 13.2 Market challenges
        • 13.3 Impact of drivers and challenges
          • Impact of drivers and challenges in 2024 and 2029
        • 13.4 Market opportunities/restraints

          14 Competitive Landscape

          • 14.1 Overview
            • 14.2 Competitive Landscape
              • Overview on criticality of inputs and factors of differentiation
            • 14.3 Landscape disruption
              • Overview on factors of disruption
            • 14.4 Industry risks
              • Impact of key risks on business

            15 Competitive Analysis

            • 15.1 Companies profiled
              • Companies covered
            • 15.2 Company ranking index
              • Company ranking index
            • 15.3 Market positioning of companies
              • Matrix on companies position and classification
            • 15.4 Amazon Web Services Inc.
              • Amazon Web Services Inc. - Overview
              • Amazon Web Services Inc. - Product / Service
              • Amazon Web Services Inc. - Key news
              • Amazon Web Services Inc. - Key offerings
              • SWOT
            • 15.5 Clari Inc.
              • Clari Inc. - Overview
              • Clari Inc. - Product / Service
              • Clari Inc. - Key offerings
              • SWOT
            • 15.6 Cresta
              • Cresta - Overview
              • Cresta - Product / Service
              • Cresta - Key offerings
              • SWOT
            • 15.7 Drift.com Inc.
              • Drift.com Inc. - Overview
              • Drift.com Inc. - Product / Service
              • Drift.com Inc. - Key offerings
              • SWOT
            • 15.8 Freshworks Inc.
              • Freshworks Inc. - Overview
              • Freshworks Inc. - Product / Service
              • Freshworks Inc. - Key offerings
              • SWOT
            • 15.9 Gong.io Inc.
              • Gong.io Inc. - Overview
              • Gong.io Inc. - Product / Service
              • Gong.io Inc. - Key offerings
              • SWOT
            • 15.10 Google LLC
              • Google LLC - Overview
              • Google LLC - Product / Service
              • Google LLC - Key offerings
              • SWOT
            • 15.11 HubSpot Inc.
              • HubSpot Inc. - Overview
              • HubSpot Inc. - Product / Service
              • HubSpot Inc. - Key news
              • HubSpot Inc. - Key offerings
              • SWOT
            • 15.12 International Business Machines Corp.
              • International Business Machines Corp. - Overview
              • International Business Machines Corp. - Business segments
              • International Business Machines Corp. - Key news
              • International Business Machines Corp. - Key offerings
              • International Business Machines Corp. - Segment focus
              • SWOT
            • 15.13 Microsoft Corp.
              • Microsoft Corp. - Overview
              • Microsoft Corp. - Business segments
              • Microsoft Corp. - Key news
              • Microsoft Corp. - Key offerings
              • Microsoft Corp. - Segment focus
              • SWOT
            • 15.14 OpenAI
              • OpenAI - Overview
              • OpenAI - Product / Service
              • OpenAI - Key offerings
              • SWOT
            • 15.15 Oracle Corp.
              • Oracle Corp. - Overview
              • Oracle Corp. - Business segments
              • Oracle Corp. - Key news
              • Oracle Corp. - Key offerings
              • Oracle Corp. - Segment focus
              • SWOT
            • 15.16 Outreach Corp.
              • Outreach Corp. - Overview
              • Outreach Corp. - Product / Service
              • Outreach Corp. - Key offerings
              • SWOT
            • 15.17 Salesloft Inc.
              • Salesloft Inc. - Overview
              • Salesloft Inc. - Product / Service
              • Salesloft Inc. - Key offerings
              • SWOT
            • 15.18 Zoho Corp. Pvt. Ltd.
              • Zoho Corp. Pvt. Ltd. - Overview
              • Zoho Corp. Pvt. Ltd. - Product / Service
              • Zoho Corp. Pvt. Ltd. - Key news
              • Zoho Corp. Pvt. Ltd. - Key offerings
              • SWOT

            16 Appendix

            • 16.1 Scope of the report
              • 16.2 Inclusions and exclusions checklist
                • Inclusions checklist
                • Exclusions checklist
              • 16.3 Currency conversion rates for US$
                • Currency conversion rates for US$
              • 16.4 Research methodology
                • Research methodology
              • 16.5 Data procurement
                • Information sources
              • 16.6 Data validation
                • Data validation
              • 16.7 Validation techniques employed for market sizing
                • Validation techniques employed for market sizing
              • 16.8 Data synthesis
                • Data synthesis
              • 16.9 360 degree market analysis
                • 360 degree market analysis
              • 16.10 List of abbreviations
                • List of abbreviations

              Research Methodology

              Technavio presents a detailed picture of the market by way of study, synthesis, and summation of data from multiple sources. The analysts have presented the various facets of the market with a particular focus on identifying the key industry influencers. The data thus presented is comprehensive, reliable, and the result of extensive research, both primary and secondary.

              INFORMATION SOURCES

              Primary sources

              • Manufacturers and suppliers
              • Channel partners
              • Industry experts
              • Strategic decision makers

              Secondary sources

              • Industry journals and periodicals
              • Government data
              • Financial reports of key industry players
              • Historical data
              • Press releases

              DATA ANALYSIS

              Data Synthesis

              • Collation of data
              • Estimation of key figures
              • Analysis of derived insights

              Data Validation

              • Triangulation with data models
              • Reference against proprietary databases
              • Corroboration with industry experts

              REPORT WRITING

              Qualitative

              • Market drivers
              • Market challenges
              • Market trends
              • Five forces analysis

              Quantitative

              • Market size and forecast
              • Market segmentation
              • Geographical insights
              • Competitive landscape

              Interested in this report?

              Get your sample now to see our research methodology and insights!

              Download Now

              Frequently Asked Questions

              Ai For Sales market growth will increase by $ 37434.2 mn during 2025-2029 .

              The Ai For Sales market is expected to grow at a CAGR of 22.1% during 2025-2029 .

              Ai For Sales market is segmented by Component( Software, Services, Hardware) Deployment( Public cloud, Hybrid, On premises) Application( Predictive analytics, Customer experience, Sentiment analysis, Content marketing)

              Affinity, Amazon Web Services Inc., Clari Inc., Cresta, Demandbase Inc., Drift.com Inc., Freshworks Inc., Gong.io Inc., Google LLC, HubSpot Inc., International Business Machines Corp., Microsoft Corp., OpenAI, Oracle Corp., Outreach Corp., People.ai, Regie.ai, Salesloft Inc., Zoho Corp. Pvt. Ltd. are a few of the key vendors in the Ai For Sales market.

              North America will register the highest growth rate of 37% among the other regions. Therefore, the Ai For Sales market in North America is expected to garner significant business opportunities for the vendors during the forecast period.

              US, China, India, UK, Singapore, Canada, France, South Korea, The Netherlands, Germany

              • Proliferation of generative AI and its transformative integration into core sales platformsThe global AI for sales market is experiencing a period of unprecedented acceleration is the driving factor this market.
              • primarily fueled by the mainstream emergence and rapid integration of generative artificial intelligence. Before this development is the driving factor this market.
              • AI for sales was largely confined to predictive analytics is the driving factor this market.
              • such as lead scoring or churn prediction is the driving factor this market.
              • which provided valuable but passive insights. The current paradigm shift is the driving factor this market.
              • however is the driving factor this market.
              • is toward active is the driving factor this market.
              • generative AI that participates directly in the sales workflow. This evolution from analytical AI to generative AI has fundamentally altered the value proposition of these tools is the driving factor this market.
              • making them indispensable co-pilots for sales professionals rather than just background analytical engines. The democratization of sophisticated large language models has enabled developers to create tools that can draft personalized emails is the driving factor this market.
              • generate compelling product descriptions is the driving factor this market.
              • summarize lengthy client calls into actionable notes is the driving factor this market.
              • and even create dynamic sales scripts in real time. This capability directly addresses some of the most time consuming aspects of a sales role is the driving factor this market.
              • thereby unlocking significant productivity gains. Major enterprise software providers have aggressively moved to embed these capabilities into their flagship products is the driving factor this market.
              • creating a powerful market driver through competitive necessity and platform lock in. In March 2023 is the driving factor this market.
              • Salesforce is the driving factor this market.
              • a dominant force in the Customer Relationship Management sector is the driving factor this market.
              • announced its Einstein GPT is the driving factor this market.
              • the first generative AI for CRM. This initiative is the driving factor this market.
              • now evolved into the broader Einstein 1 Platform is the driving factor this market.
              • injects generative AI across its Sales Cloud is the driving factor this market.
              • Service Cloud is the driving factor this market.
              • and Marketing Cloud. Its features is the driving factor this market.
              • such as Sales Emails is the driving factor this market.
              • which auto drafts context aware emails is the driving factor this market.
              • and Call Summaries is the driving factor this market.
              • demonstrate a clear strategy to make AI an ambient is the driving factor this market.
              • ever present assistant for its users. This move by the market leader created a ripple effect is the driving factor this market.
              • compelling competitors to respond in kind. Shortly thereafter is the driving factor this market.
              • also in March 2023 is the driving factor this market.
              • Microsoft unveiled its Dynamics 365 Copilot is the driving factor this market.
              • leveraging its strategic partnership with OpenAI to integrate similar generative capabilities across its business applications suite. The Microsoft Copilot for Sales specifically offers AI assistance within the tools sales teams use daily is the driving factor this market.
              • such as Outlook and Teams is the driving factor this market.
              • to summarize email threads is the driving factor this market.
              • provide meeting preparation briefs is the driving factor this market.
              • and update CRM records automatically. This fierce competition between tech giants is a significant propellant for the market is the driving factor this market.
              • as it accelerates innovation and drives down the barriers to adoption for enterprises already invested in these ecosystems. The trend is not limited to the largest players. In March 2023 is the driving factor this market.
              • HubSpot is the driving factor this market.
              • a key player in the small and medium business segment is the driving factor this market.
              • launched ChatSpot.ai is the driving factor this market.
              • a conversational CRM assistant is the driving factor this market.
              • and has since continued to weave AI powered content and campaign generation tools into its platform. Furthermore is the driving factor this market.
              • the integration of AI into communication platforms has blurred the lines between sales enablement and communication tools. In June 2023 is the driving factor this market.
              • Zoom expanded the capabilities of its AI-powered tool is the driving factor this market.
              • now known as AI Companion is the driving factor this market.
              • to provide intelligent recaps is the driving factor this market.
              • chaptering of recorded sales calls is the driving factor this market.
              • and automated identification of next steps. This instance highlights how AI is being integrated at every touchpoint of the sales process is the driving factor this market.
              • making its adoption not just a choice for efficiency but a necessity for staying competitive in a rapidly evolving digital sales environment. The cumulative effect is a market where AI is no longer a peripheral feature but a core component of the modern sales technology stack. is the driving factor this market.

              The Ai For Sales market vendors should focus on grabbing business opportunities from the Software segment as it accounted for the largest market share in the base year.